Grundlæggende statistik
| Institutionelle aktier (lange) | 192.539.826 - 51,04% (ex 13D/G) - change of 32,22MM shares 20,10% MRQ |
| Institutionel værdi (lang) | $ 5.966.589 USD ($1000) |
Institutionelt ejerskab og aktionærer
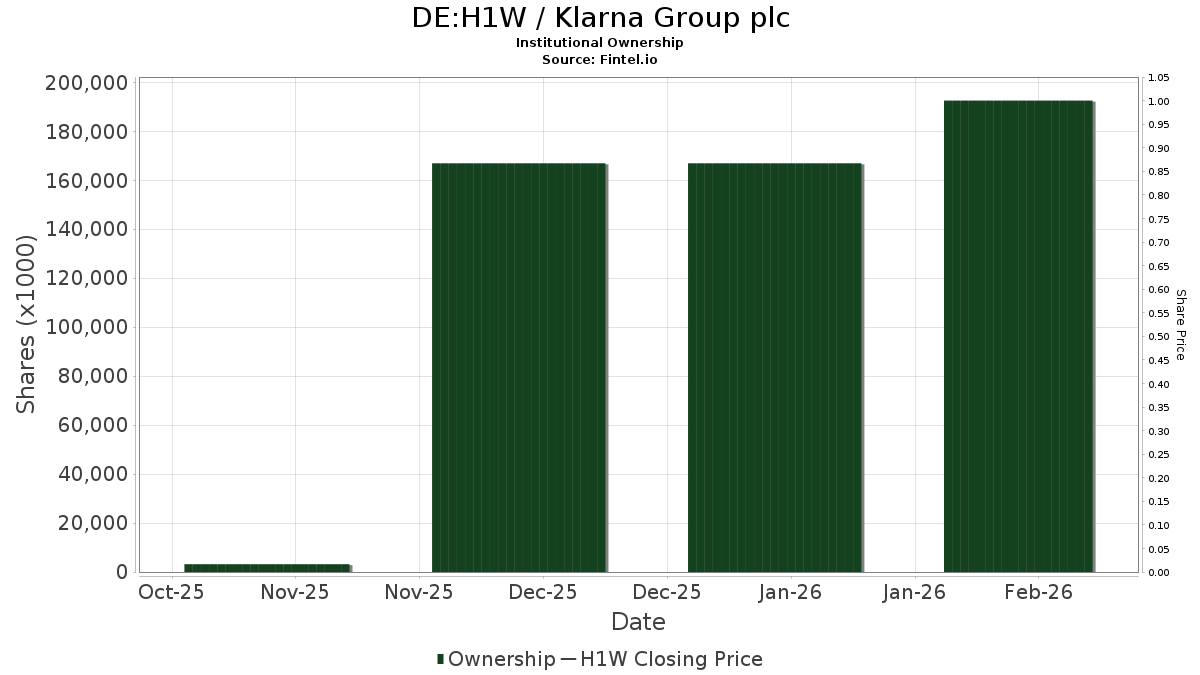
Klarna Group plc (DE:H1W) har 181 institutionelle ejere og aktionærer, der har indsendt 13D/G- eller 13F-formularer til Securities Exchange Commission (SEC). Disse institutioner har i alt 192,539,826 aktier. Største aktionærer omfatter Sc Us (ttgp), Ltd., Commonwealth Bank Of Australia, Softbank Group Corp, Silver Lake Group, L.L.C., Wellington Management Group Llp, Dragoneer Investment Group, LLC, Scge Management, L.p., Harbourvest Partners Llc, HMI Capital Management, L.P., and Technology Crossover Management X, Ltd. .
Klarna Group plc (XTRA:H1W) institutionel ejerskabsstruktur viser aktuelle positioner i virksomheden efter institutioner og fonde, samt seneste ændringer i positionsstørrelse. Større aktionærer kan omfatte individuelle investorer, investeringsforeninger, hedgefonde eller institutioner. Skema 13D angiver, at investoren besidder (eller besidder) mere end 5 % af virksomheden og har til hensigt (eller har til hensigt at) aktivt at forfølge en ændring i forretningsstrategi. Skema 13G indikerer en passiv investering på over 5%.
Fondens stemningsscore
Fund Sentiment Score (fka Ownership Accumulation Score) finder de aktier, der bliver mest købt af fonde. Det er resultatet af en sofistikeret, multi-faktor kvantitativ model, der identificerer virksomheder med de højeste niveauer af institutionel akkumulering. Scoringsmodellen bruger en kombination af den samlede stigning i oplyste ejere, ændringerne i porteføljeallokeringer i disse ejere og andre målinger. Tallet går fra 0 til 100, hvor højere tal indikerer et højere niveau af akkumulering for sine jævnaldrende, og 50 er gennemsnittet.
Opdateringsfrekvens: Dagligt
Se Ownership Explorer, som giver en liste over højest rangerende virksomheder.
AI+ Ask Fintel’s AI assistant about Klarna Group plc.
Select a question to share a public post with an AI-crafted answer.
Thinking of good questions…
13F og NPORT arkivering
Detaljer om 13F-arkivering er gratis. Detaljer om NP-ansøgninger kræver et premium-medlemskab. Grønne rækker angiver nye positioner. Røde rækker angiver lukkede positioner. Klik på linket ikon for at se den fulde transaktionshistorik.
Opgrader
for at låse premium-data op og eksportere til Excel ![]() .
.
| Fil dato | Kilde | Investor | Type | Gennemsnitlig pris (Øst) |
Aktier | Δ Aktier (%) |
Rapporteret Værdi ($1000) |
Δ Værdi (%) |
Port Alloc (%) |
|
|---|---|---|---|---|---|---|---|---|---|---|
| 2026-02-13 | 13F | Morgan Stanley | 394.305 | 276,80 | 11.399 | 197,24 | ||||
| 2025-11-14 | 13F | Citadel Advisors Llc | 2.021.303 | 74.081 | ||||||
| 2025-11-14 | 13F | Citadel Advisors Llc | Call | 48.800 | 1.789 | |||||
| 2025-11-14 | 13F | Mubadala Investment Co PJSC | 2.991.658 | 109.644 | ||||||
| 2025-11-14 | 13F | Citadel Advisors Llc | Put | 103.600 | 3.797 | |||||
| 2025-11-14 | 13F | Wolverine Trading, Llc | Put | 20.700 | 796 | |||||
| 2026-02-13 | 13F | Van Eck Associates Corp | 11.500 | 0 | ||||||
| 2026-02-03 | 13F/A | Bank Of America Corp /de/ | 46.356 | 1.699 | ||||||
| 2025-11-14 | 13F | DZ BANK AG Deutsche Zentral Genossenschafts Bank, Frankfurt am Main | 9.272 | 336 | ||||||
| 2025-11-14 | 13F | Holocene Advisors, LP | 485.534 | 17.795 | ||||||
| 2026-02-10 | 13F | Ritter Daniher Financial Advisory LLC / DE | 80 | 2 | ||||||
| 2026-02-10 | 13F | Bank of New York Mellon Corp | 16.532 | 478 | ||||||
| 2025-11-14 | 13F | Wolverine Trading, Llc | Call | 21.800 | 838 | |||||
| 2026-02-11 | 13F | LPL Financial LLC | 15.557 | 11,15 | 450 | -12,30 | ||||
| 2026-02-12 | 13F | Nuveen, LLC | 1.051.215 | 30.391 | ||||||
| 2025-11-14 | 13F | MIC Capital Management UK LLP | 2.714.928 | 99.502 | ||||||
| 2026-02-13 | 13F | Dnca Finance | 117.000 | 134,00 | 3.382 | 84,61 | ||||
| 2026-01-29 | 13F | Renaissance Capital LLC | 21.889 | 633 | ||||||
| 2026-02-06 | 13F | Global Retirement Partners, LLC | 900 | 800,00 | 26 | 766,67 | ||||
| 2026-02-03 | 13F | SBI Securities Co., Ltd. | 2.891 | 42,06 | 84 | 12,16 | ||||
| 2025-11-14 | 13F | Stockbridge Partners LLC | 82.119 | 3.010 | ||||||
| 2026-02-12 | 13F | Principal Securities, Inc. | 0 | -100,00 | 0 | |||||
| 2025-11-14 | 13F | Zimmer Partners, LP | 50.000 | 1.832 | ||||||
| 2026-01-23 | 13F | Robeco Institutional Asset Management B.V. | 150.000 | 150,00 | 4.336 | 97,18 | ||||
| 2026-02-13 | 13F | Silver Lake Group, L.L.C. | 14.470.343 | 0,00 | 418.338 | -21,12 | ||||
| 2026-02-06 | 13F | Pnc Financial Services Group, Inc. | 150 | 4 | ||||||
| 2026-01-29 | 13F | Teachers Retirement System Of The State Of Kentucky | 101.131 | -9,92 | 3 | -50,00 | ||||
| 2026-01-08 | 13F | Wealth Enhancement Advisory Services, Llc | 0 | -100,00 | 0 | -100,00 | ||||
| 2026-02-11 | 13F | Prestige Wealth Management Group LLC | 0 | -100,00 | 0 | |||||
| 2026-02-09 | 13F | Wcm Investment Management, Llc | 121.219 | -70,95 | 3.521 | -78,05 | ||||
| 2026-02-06 | 13F | Technology Crossover Management X, Ltd. | 3.844.736 | 0,00 | 111.151 | -21,12 | ||||
| 2026-02-13 | 13F | MAI Capital Management | 2.500 | 43,68 | 72 | 14,29 | ||||
| 2025-11-14 | 13F | Sandia Investment Management LP | 11.000 | 403 | ||||||
| 2026-02-06 | 13F | Gsa Capital Partners Llp | 30.204 | 1 | ||||||
| 2026-02-09 | 13F | Legal & General Group Plc | 8.695 | 114,74 | 251 | 69,59 | ||||
| 2026-02-13 | 13F | Alyeska Investment Group, L.P. | 405.000 | -35,64 | 11.709 | -49,23 | ||||
| 2025-11-14 | 13F | Tower Research Capital LLC (TRC) | 100 | 4 | ||||||
| 2025-11-14 | 13F | T. Rowe Price Investment Management, Inc. | 1.854.942 | 68 | ||||||
| 2025-11-14 | 13F | Luxor Capital Group, LP | 379.230 | 13.327 | ||||||
| 2026-01-22 | 13F | Bartlett & Co. Wealth Management Llc | 138 | 4 | ||||||
| 2026-01-30 | 13F | Skylands Capital, LLC | 0 | -100,00 | 0 | |||||
| 2026-01-30 | 13F | Rachor Investment Advisory Services, LLC | 31 | 1 | ||||||
| 2025-11-14 | 13F | Blackstone Group Inc | 605.844 | 22.204 | ||||||
| 2026-01-14 | 13F | Tradewinds Capital Management, LLC | 100 | 3 | ||||||
| 2025-11-14 | 13F | Gilder Gagnon Howe & Co Llc | 96.141 | 3.524 | ||||||
| 2026-01-27 | 13F | Atlantic Edge Private Wealth Management, LLC | 0 | -100,00 | 0 | -100,00 | ||||
| 2026-02-12 | 13F | SkyBridge Capital II, LLC | 21.600 | 0,00 | 624 | -21,11 | ||||
| 2025-11-14 | 13F | MSA Advisors, LLC | 99.768 | 3.656 | ||||||
| 2025-11-12 | 13F | Creekmur Asset Management LLC | 20 | 1 | ||||||
| 2025-11-04 | 13F | Jones Financial Companies Lllp | 1.155 | 46 | ||||||
| 2026-01-22 | 13F | WELLCOME TRUST LTD (THE) as trustee of the WELLCOME TRUST | 3.158.340 | 0,00 | 91.308 | -21,12 | ||||
| 2026-02-12 | 13F | BlackRock, Inc. | 2.098.448 | -10,75 | 60.666 | -29,60 | ||||
| 2025-11-14 | 13F | Point72 (DIFC) Ltd | 4 | 0 | ||||||
| 2026-02-13 | 13F | Harvard Management Co Inc | 459.163 | 0,00 | 13.274 | -21,12 | ||||
| 2026-02-11 | 13F | Jpmorgan Chase & Co | 23.771 | -94,55 | 687 | -95,70 | ||||
| 2026-02-12 | 13F | Commonwealth Bank Of Australia | 17.407.235 | 503.243 | ||||||
| 2025-11-14 | 13F | Tiger Global Management Llc | 175.000 | 6.414 | ||||||
| 2026-02-13 | 13F | Wells Fargo & Company/mn | 119.516 | 79.577,33 | 3.455 | 69.000,00 | ||||
| 2025-11-14 | 13F | Coatue Management Llc | 330.000 | 12.095 | ||||||
| 2026-02-03 | 13F | Enhancing Capital LLC | 11.200 | 324 | ||||||
| 2026-02-11 | 13F | Franklin Resources Inc | 0 | -100,00 | 0 | |||||
| 2026-02-09 | 13F | Geode Capital Management, Llc | 136.166 | 3.937 | ||||||
| 2026-02-11 | 13F | Capital Research Global Investors | 0 | -100,00 | 0 | |||||
| 2026-02-13 | 13F | Stifel Financial Corp | 29.122 | 842 | ||||||
| 2026-02-06 | 13F | EverSource Wealth Advisors, LLC | 268 | 2.580,00 | 8 | |||||
| 2026-01-23 | 13F | Farther Finance Advisors, LLC | 1.676 | 48 | ||||||
| 2026-02-13 | 13F | Sc Us (ttgp), Ltd. | 55.029.211 | 0,00 | 1.590.894 | -21,12 | ||||
| 2026-02-12 | 13F | Monashee Investment Management LLC | 0 | -100,00 | 0 | -100,00 | ||||
| 2025-11-14 | 13F | Point72 Asset Management, L.P. | 381.646 | 13.987 | ||||||
| 2026-01-30 | 13F | Laurel Wealth Advisors LLC | 24 | 1 | ||||||
| 2026-01-16 | 13F | PFS Partners, LLC | 10 | 0,00 | 0 | |||||
| 2025-11-14 | 13F | Advisor Group Holdings, Inc. | 2.091 | 80 | ||||||
| 2026-02-12 | 13F | WestCap Management, LLC | 1.068.564 | 30.892 | ||||||
| 2025-11-14 | 13F | Davidson Kempner Capital Management Lp | 125.000 | 4.581 | ||||||
| 2025-11-14 | 13F | HMI Capital Management, L.P. | 4.452.097 | 163.169 | ||||||
| 2026-01-29 | 13F | WT Asset Management Ltd | 0 | -100,00 | 0 | -100,00 | ||||
| 2026-02-13 | 13F | Kestra Advisory Services, LLC | 5.664 | 164 | ||||||
| 2025-11-13 | 13F | Fmr Llc | 993.210 | 36.401 | ||||||
| 2026-02-11 | 13F | Simplex Trading, Llc | 67.051 | 353,45 | 1.938 | |||||
| 2026-02-10 | 13F | Goldman Sachs Group Inc | 3.534.740 | 316,01 | 102.189 | 228,16 | ||||
| 2026-02-10 | 13F | Goldman Sachs Group Inc | Put | 443.700 | 12.827 | |||||
| 2026-02-10 | 13F | Bnp Paribas Arbitrage, Sa | 29.245 | 1.462.150,00 | 845 | |||||
| 2026-02-12 | 13F | Jane Street Group, Llc | 282.775 | 282,53 | 8.175 | 201,77 | ||||
| 2025-11-14 | 13F | Anomaly Capital Management, LP | 614.033 | 22.504 | ||||||
| 2026-02-12 | 13F | Jane Street Group, Llc | Put | 165.700 | 48,74 | 4.790 | 17,34 | |||
| 2026-02-12 | 13F | Counterpoint Mutual Funds LLC | 99.851 | 2.887 | ||||||
| 2026-02-12 | 13F | Jane Street Group, Llc | Call | 118.400 | 45,45 | 3.423 | 14,72 | |||
| 2026-02-13 | 13F | Vontobel Holding Ltd. | Put | 0 | -100,00 | 0 | -100,00 | |||
| 2026-02-13 | 13F | SRS Capital Advisors, Inc. | 500 | 0,00 | 14 | -22,22 | ||||
| 2026-01-12 | 13F | Salem Investment Counselors Inc | 22.300 | 5.475,00 | 645 | 4.500,00 | ||||
| 2026-02-09 | 13F | Emerald Mutual Fund Advisers Trust | 17.146 | 0,00 | 496 | -21,18 | ||||
| 2025-11-14 | 13F | Janus Henderson Group Plc | 9.828 | 360 | ||||||
| 2026-01-16 | 13F | Compagnie Lombard Odier SCmA | 1.650 | 43,48 | 48 | 11,90 | ||||
| 2025-11-14 | 13F | Polymer Capital Management (US) LLC | 17.000 | 623 | ||||||
| 2026-01-16 | 13F | FNY Investment Advisers, LLC | 0 | -100,00 | 0 | |||||
| 2026-02-13 | 13F | Caitong International Asset Management Co., Ltd | 4.053 | 19,63 | 117 | -5,65 | ||||
| 2026-02-13 | 13F | Walleye Trading LLC | 58.108 | 2.233,65 | 1.680 | 1.745,05 | ||||
| 2026-02-13 | 13F | Walleye Trading LLC | Put | 83.500 | 666,06 | 2.414 | 504,76 | |||
| 2026-02-13 | 13F | Walleye Trading LLC | Call | 37.400 | 663,27 | 1.081 | 503,91 | |||
| 2025-11-14 | 13F | Azora Capital LP | 1.100.782 | 40.344 | ||||||
| 2026-02-09 | 13F | Huntington National Bank | 151 | 4 | ||||||
| 2026-02-06 | 13F | Banque Cantonale Vaudoise | 2.602 | 75 | ||||||
| 2026-02-13 | 13F | Peak6 Llc | 10.680 | 309 | ||||||
| 2025-11-14 | 13F | Ion Asset Management Ltd. | 50.000 | 1.832 | ||||||
| 2026-02-09 | 13F | Harbour Investments, Inc. | 103 | 3 | ||||||
| 2026-02-13 | 13F | Hudson Bay Capital Management LP | 0 | -100,00 | 0 | -100,00 | ||||
| 2026-02-13 | 13F | Peak6 Llc | Call | 21.600 | 624 | |||||
| 2026-02-13 | 13F | Peak6 Llc | Put | 94.300 | 2.726 | |||||
| 2025-11-14 | 13F | Dragoneer Investment Group, LLC | 8.283.616 | 303.595 | ||||||
| 2026-02-10 | 13F | Td Asset Management Inc | 0 | -100,00 | 0 | |||||
| 2026-02-13 | 13F | Falcon Edge Capital, LP | 376.200 | 0,00 | 10.876 | -21,12 | ||||
| 2025-11-14 | 13F | Ilex Capital Partners (UK) LLP | 34.619 | 1.269 | ||||||
| 2026-02-13 | 13F | State Street Corp | 19.116 | 553 | ||||||
| 2026-01-30 | 13F | Kohmann Bosshard Financial Services, LLC | 126 | 4 | ||||||
| 2026-02-13 | 13F | Squarepoint Ops LLC | 144.363 | 12,24 | 4.174 | -11,46 | ||||
| 2026-01-22 | 13F | Massachusetts Financial Services Co /ma/ | 0 | -100,00 | 0 | -100,00 | ||||
| 2026-02-02 | 13F | Montag A & Associates Inc | 500 | 14 | ||||||
| 2025-11-14 | 13F | Wellington Management Group Llp | 9.517.988 | 348.834 | ||||||
| 2026-02-10 | 13F | Seven Grand Managers, Llc | 50.000 | 0,00 | 1.446 | -21,12 | ||||
| 2026-02-11 | 13F | Nikko Asset Management Americas, Inc. | 759.624 | 21.930 | ||||||
| 2026-01-12 | 13F | CVA Family Office, LLC | 32 | 1 | ||||||
| 2026-02-05 | 13F | DnB Asset Management AS | 223.572 | -55,62 | 6.457 | -65,03 | ||||
| 2025-11-14 | 13F | Whitebark Investors LP | 60.000 | 2.199 | ||||||
| 2025-12-09 | 13F/A | Tudor Investment Corp Et Al | 155.000 | 5.681 | ||||||
| 2025-11-14 | 13F | Freestone Grove Partners LP | 34.706 | 1.272 | ||||||
| 2025-11-14 | 13F | Petrus Trust Company, LTA | 121.980 | 4.471 | ||||||
| 2025-11-14 | 13F | SummitTX Capital, L.P. | 41.549 | 1.523 | ||||||
| 2025-11-14 | 13F | Point72 Europe (London) LLP | 7.500 | 275 | ||||||
| 2026-02-03 | 13F | Costello Asset Management, INC | 100 | 0,00 | 3 | -33,33 | ||||
| 2025-11-14 | 13F | National Bank Of Canada /fi/ | 5.000 | 182 | ||||||
| 2025-11-14 | 13F | Longaeva Partners L.P. | 405.590 | 14.865 | ||||||
| 2026-02-06 | 13F | IFP Advisors, Inc | 0 | -100,00 | 0 | -100,00 | ||||
| 2025-11-14 | 13F | Qube Research & Technologies Ltd | 79.276 | 2.905 | ||||||
| 2026-01-26 | 13F | Asset Dedication, LLC | 811 | 23 | ||||||
| 2026-02-11 | 13F | Group One Trading, L.p. | 0 | -100,00 | 0 | |||||
| 2026-01-26 | 13F | Cwm, Llc | 1.498 | 172,86 | 0 | |||||
| 2026-02-11 | 13F | BIT Capital GmbH | 0 | -100,00 | 0 | |||||
| 2025-11-14 | 13F | Honeycomb Asset Management LP | 1.041.228 | 38.161 | ||||||
| 2026-02-10 | 13F | Norges Bank | 1.777.365 | 51.384 | ||||||
| 2026-01-26 | 13F | JNBA Financial Advisors | 376 | 0,00 | 11 | -23,08 | ||||
| 2025-11-14 | 13F | ExodusPoint Capital Management, LP | Put | 25.000 | 913 | |||||
| 2025-11-14 | 13F | LMR Partners LLP | 173.587 | 6.362 | ||||||
| 2026-02-12 | 13F | Renaissance Technologies Llc | 745.900 | 21.564 | ||||||
| 2026-02-13 | 13F | Barclays Plc | 19.147 | 583,82 | 554 | 442,16 | ||||
| 2025-11-14 | 13F | ExodusPoint Capital Management, LP | 250.000 | 9.162 | ||||||
| 2026-01-07 | 13F | Harbour Capital Advisors, LLC | 8.025 | 229 | ||||||
| 2026-02-12 | 13F | Marex Group plc | 7.176 | 207 | ||||||
| 2025-11-13 | 13F | Russell Investments Group, Ltd. | 525.102 | 19.272 | ||||||
| 2026-02-13 | 13F | Inspire Advisors, LLC | 11.916 | 345 | ||||||
| 2026-02-13 | 13F | Marshall Wace, Llp | 588.351 | 1,94 | 17.009 | -19,59 | ||||
| 2026-02-12 | 13F | Bank Of Montreal /can/ | 26.518 | 767 | ||||||
| 2025-11-14 | 13F | Harbourvest Partners Llc | 5.023.320 | 184.105 | ||||||
| 2026-01-27 | 13F | Zurcher Kantonalbank (Zurich Cantonalbank) | 4.080 | -2,13 | 118 | -23,03 | ||||
| 2025-11-14 | 13F | Oxford Asset Management Llp | 12.980 | 476 | ||||||
| 2026-02-10 | 13F | Ilmarinen Mutual Pension Insurance Co | 514.788 | 15 | ||||||
| 2026-02-13 | 13F | Soros Fund Management Llc | 0 | -100,00 | 0 | -100,00 | ||||
| 2025-11-14 | 13F | Schonfeld Strategic Advisors LLC | 18.913 | 693 | ||||||
| 2025-11-12 | 13F | SQN Investors LP | 348.000 | 12.754 | ||||||
| 2025-11-14 | 13F | Caisse De Depot Et Placement Du Quebec | 485.270 | 17.785 | ||||||
| 2026-02-06 | 13F | Walmart Inc. | 2.400.000 | 0,00 | 69.384 | -21,12 | ||||
| 2026-02-13 | 13F | Healthcare Of Ontario Pension Plan Trust Fund | 775.000 | 0,00 | 22.405 | -21,12 | ||||
| 2026-01-08 | 13F | Adirondack Trust Co | 19 | 0,00 | 1 | |||||
| 2025-11-14 | 13F | Softbank Group Corp | 15.400.224 | 564.418 | ||||||
| 2026-02-12 | 13F | Federation des caisses Desjardins du Quebec | 6.983 | 794,11 | 202 | 617,86 | ||||
| 2026-01-20 | 13F | Signaturefd, Llc | 262 | 8 | ||||||
| 2025-11-14 | 13F | Lighthouse Investment Partners, LLC | 27.480 | 1.007 | ||||||
| 2025-11-14 | 13F | Adage Capital Partners Gp, L.l.c. | 292.713 | 10.728 | ||||||
| 2026-02-10 | 13F | Quantbot Technologies LP | 0 | -100,00 | 0 | |||||
| 2026-02-06 | 13F | Larson Financial Group LLC | 0 | -100,00 | 0 | -100,00 | ||||
| 2026-02-13 | 13F | Sculptor Capital LP | Put | 350.500 | 10.133 | |||||
| 2026-02-13 | 13F | Sculptor Capital LP | 348.000 | 132,00 | 10.061 | 83,01 | ||||
| 2026-02-13 | 13F | Centiva Capital, LP | 0 | -100,00 | 0 | |||||
| 2026-02-13 | 13F | Verition Fund Management LLC | 12.187 | 352 | ||||||
| 2026-02-13 | 13F | Scge Management, L.p. | 5.266.524 | 0,00 | 152.255 | -21,12 | ||||
| 2026-01-23 | 13F | Inlight Wealth Management, LLC | 121 | 3 | ||||||
| 2025-11-14 | 13F | Burkehill Global Management, LP | 250.000 | 9.162 | ||||||
| 2026-01-15 | 13F | Royal Fund Management, LLC | 30.600 | 885 | ||||||
| 2025-11-14 | 13F | Vista Equity Partners Management, Llc | 1.148.592 | 42.096 | ||||||
| 2025-11-14 | 13F | Royal Bank Of Canada | 778.027 | 28.515 | ||||||
| 2025-11-18 | 13F | Advisory Services Network, LLC | 138 | 5 | ||||||
| 2025-11-14 | 13F | Woodline Partners LP | 15.000 | 550 | ||||||
| 2026-02-11 | 13F | ARK Investment Management LLC | 736.657 | 59,55 | 21.297 | 25,86 | ||||
| 2025-11-13 | 13F | Canada Pension Plan Investment Board | 1.357.464 | 49.751 | ||||||
| 2026-02-10 | 13F | State of Wyoming | 31.676 | 916 | ||||||
| 2026-02-13 | 13F | Walleye Capital LLC | 89.623 | 46,15 | 2.591 | 15,31 | ||||
| 2025-11-14 | 13F/A | Tenere Capital LLC | 57.984 | 2.125 | ||||||
| 2025-11-14 | 13F | Price T Rowe Associates Inc /md/ | 1.282.362 | 47 | ||||||
| 2026-01-09 | 13F | SG Americas Securities, LLC | 17.378 | -26,60 | 1 | |||||
| 2025-11-14 | 13F | Balyasny Asset Management Llc | 511.824 | 18.758 | ||||||
| 2025-11-14 | 13F | Susquehanna International Group, Llp | Call | 112.300 | 4.116 | |||||
| 2026-01-29 | 13F | UBS Group AG | 1.376.248 | 32,88 | 39.787 | 4,82 | ||||
| 2025-11-14 | 13F | Susquehanna International Group, Llp | Put | 183.200 | 6.714 | |||||
| 2025-11-14 | 13F | Susquehanna International Group, Llp | 222.770 | 8.165 | ||||||
| 2026-01-30 | 13F | Us Bancorp \de\ | 0 | -100,00 | 0 | -100,00 | ||||
| 2026-02-06 | 13F | GPS Wealth Strategies Group, LLC | 100 | 3 | ||||||
| 2026-02-06 | 13F | Leonteq Securities AG | 1.012 | 29 | ||||||
| 2026-02-13 | 13F | Vontobel Holding Ltd. | 27.170 | -8,16 | 785 | -27,58 | ||||
| 2025-11-14 | 13F | Murchinson Ltd. | 20.000 | 733 | ||||||
| 2025-11-14 | 13F | D. E. Shaw & Co., Inc. | 225.000 | 8.246 | ||||||
| 2026-01-16 | 13F | Crewe Advisors LLC | 141 | 41,00 | 4 | 33,33 | ||||
| 2026-02-13 | 13F | Citigroup Inc | 8.492 | 246 | ||||||
| 2026-02-04 | 13F | Atlantic Union Bankshares Corp | 100 | 3 | ||||||
| 2026-01-27 | 13F | TD Waterhouse Canada Inc. | 1.659 | 44,26 | 48 | 11,90 | ||||
| 2026-02-11 | 13F | Deutsche Bank Ag\ | 35.153 | 10,59 | 1.016 | -12,71 | ||||
| 2026-02-13 | 13F | Ubs Asset Management Americas Inc | 1.581.085 | 3,77 | 45.709 | -18,15 | ||||
| 2025-11-14 | 13F | Millennium Management Llc | 1.111.573 | 40.739 | ||||||
| 2026-01-23 | 13F | U.S. Capital Wealth Advisors, LLC | 51.370 | 1.485 | ||||||
| 2026-01-20 | 13F | Toth Financial Advisory Corp | 200 | 0,00 | 6 | -28,57 | ||||
| 2025-11-14 | 13F | Boothbay Fund Management, Llc | 74.189 | 2.719 | ||||||
| 2025-11-14 | 13F | Rockefeller Capital Management L.P. | 100 | 4 | ||||||
| 2026-01-13 | 13F | CoreCap Advisors, LLC | 50 | 1 | ||||||
| 2026-02-13 | 13F | Neuberger Berman Group LLC | 0 | -100,00 | 0 | |||||
| 2025-11-14 | 13F | XTX Topco Ltd | 37.516 | 1.375 | ||||||
| 2026-02-10 | 13F | Basepoint Wealth LLC | 50 | 1 | ||||||
| 2026-01-23 | 13F | Sumitomo Mitsui Trust Holdings, Inc. | 812.743 | 53,50 | 23.496 | 21,08 | ||||
| 2026-02-05 | 13F | Allworth Financial LP | 0 | -100,00 | 0 | -100,00 | ||||
| 2025-11-14 | 13F | Weiss Asset Management LP | 25.000 | 916 | ||||||
| 2026-02-13 | 13F | First Trust Advisors Lp | 0 | -100,00 | 0 | |||||
| 2026-02-13 | 13F | Entropy Technologies, LP | 18.789 | 543 | ||||||
| 2026-02-13 | 13F | Quarry LP | 560 | 16 |
Other Listings
| US:KLAR | 18,11 $ |