Grundlæggende statistik
| Institutionelle aktier (lange) | 31.243.882 - 61,46% (ex 13D/G) - change of -6,05MM shares -16,22% MRQ |
| Institutionel værdi (lang) | $ 1.621.082 USD ($1000) |
Institutionelt ejerskab og aktionærer
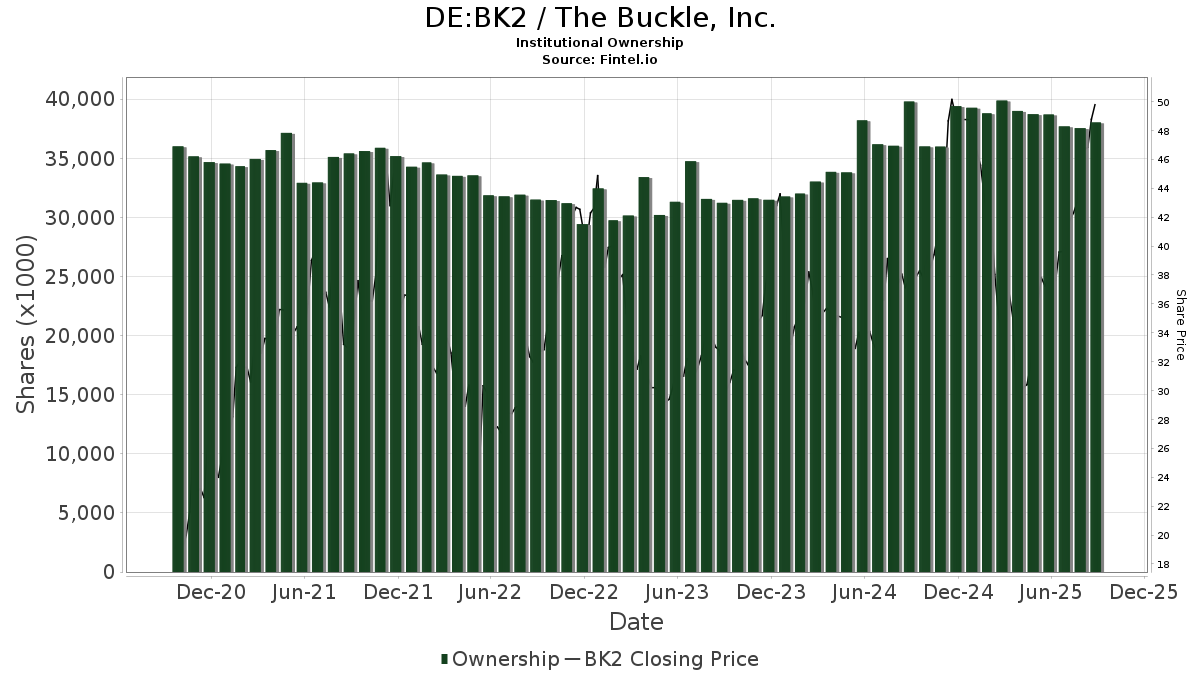
The Buckle, Inc. (DE:BK2) har 320 institutionelle ejere og aktionærer, der har indsendt 13D/G- eller 13F-formularer til Securities Exchange Commission (SEC). Disse institutioner har i alt 31,243,882 aktier. Største aktionærer omfatter BlackRock, Inc., Vanguard Group Inc, Charles Schwab Investment Management Inc, State Street Corp, Dimensional Fund Advisors Lp, American Century Companies Inc, Morgan Stanley, Renaissance Technologies Llc, Goldman Sachs Group Inc, and Geode Capital Management, Llc .
The Buckle, Inc. (DB:BK2) institutionel ejerskabsstruktur viser aktuelle positioner i virksomheden efter institutioner og fonde, samt seneste ændringer i positionsstørrelse. Større aktionærer kan omfatte individuelle investorer, investeringsforeninger, hedgefonde eller institutioner. Skema 13D angiver, at investoren besidder (eller besidder) mere end 5 % af virksomheden og har til hensigt (eller har til hensigt at) aktivt at forfølge en ændring i forretningsstrategi. Skema 13G indikerer en passiv investering på over 5%.
The share price as of April 24, 2026 is 47,26 / share. Previously, on April 28, 2025, the share price was 30,31 / share. This represents an increase of 55,92% over that period.
Fondens stemningsscore
Fund Sentiment Score (fka Ownership Accumulation Score) finder de aktier, der bliver mest købt af fonde. Det er resultatet af en sofistikeret, multi-faktor kvantitativ model, der identificerer virksomheder med de højeste niveauer af institutionel akkumulering. Scoringsmodellen bruger en kombination af den samlede stigning i oplyste ejere, ændringerne i porteføljeallokeringer i disse ejere og andre målinger. Tallet går fra 0 til 100, hvor højere tal indikerer et højere niveau af akkumulering for sine jævnaldrende, og 50 er gennemsnittet.
Opdateringsfrekvens: Dagligt
Se Ownership Explorer, som giver en liste over højest rangerende virksomheder.
AI+ Ask Fintel’s AI assistant about The Buckle, Inc..
Select a question to share a public post with an AI-crafted answer.
Thinking of good questions…
13F og NPORT arkivering
Detaljer om 13F-arkivering er gratis. Detaljer om NP-ansøgninger kræver et premium-medlemskab. Grønne rækker angiver nye positioner. Røde rækker angiver lukkede positioner. Klik på linket ikon for at se den fulde transaktionshistorik.
Opgrader
for at låse premium-data op og eksportere til Excel ![]() .
.
| Fil dato | Kilde | Investor | Type | Gennemsnitlig pris (Øst) |
Aktier | Δ Aktier (%) |
Rapporteret Værdi ($1000) |
Δ Værdi (%) |
Port Alloc (%) |
|
|---|---|---|---|---|---|---|---|---|---|---|
| 2026-02-06 | 13F | ProShare Advisors LLC | 68.100 | 4,07 | 3.638 | -5,24 | ||||
| 2026-02-06 | 13F | Sierra Summit Advisors Llc | 14.955 | 799 | ||||||
| 2026-02-06 | 13F | Gsa Capital Partners Llp | 0 | -100,00 | 0 | |||||
| 2026-02-17 | 13F | California State Teachers Retirement System | 29.478 | 4,42 | 1.575 | -4,95 | ||||
| 2026-02-13 | 13F | Manufacturers Life Insurance Company, The | 0 | -100,00 | 0 | |||||
| 2026-02-13 | 13F | Walleye Capital LLC | 0 | -100,00 | 0 | |||||
| 2026-02-13 | 13F | SRS Capital Advisors, Inc. | 17 | -99,82 | 1 | -100,00 | ||||
| 2026-02-17 | 13F | Alliancebernstein L.p. | 37.142 | 1,37 | 1.984 | -7,68 | ||||
| 2026-02-05 | 13F | Thrivent Financial For Lutherans | 37.017 | 43,96 | 2 | 0,00 | ||||
| 2026-02-14 | 13F | Rockefeller Capital Management L.P. | 0 | -100,00 | 0 | |||||
| 2025-11-12 | 13F | Empirical Asset Management, LLC | 0 | -100,00 | 0 | |||||
| 2026-02-02 | 13F | Pittenger & Anderson Inc | 557 | 0,00 | 30 | -9,37 | ||||
| 2026-02-11 | 13F | O'shaughnessy Asset Management, Llc | 29.996 | 5,01 | 1.602 | -4,36 | ||||
| 2025-10-30 | 13F | CBOE Vest Financial, LLC | 0 | -100,00 | 0 | |||||
| 2026-02-03 | 13F | SBI Securities Co., Ltd. | 346 | -62,88 | 18 | -66,67 | ||||
| 2026-02-17 | 13F | XTX Topco Ltd | 39.920 | 227,75 | 2.133 | 198,60 | ||||
| 2026-02-11 | 13F | Fox Run Management, L.l.c. | 15.186 | -38,74 | 811 | -44,22 | ||||
| 2026-02-17 | 13F | Freestone Grove Partners LP | 4.656 | 249 | ||||||
| 2025-11-06 | 13F | Ameritas Advisory Services, LLC | 0 | -100,00 | 0 | -100,00 | ||||
| 2026-02-12 | 13F | Dimensional Fund Advisors Lp | 1.311.917 | 0,64 | 70.084 | -8,35 | ||||
| 2025-11-03 | 13F | SummerHaven Investment Management, LLC | 0 | -100,00 | 0 | -100,00 | ||||
| 2025-11-14 | 13F | Point72 (DIFC) Ltd | 9.341 | 548 | ||||||
| 2026-04-15 | 13F | Monument Capital Management | 4.559 | -24,71 | 230 | -29,10 | ||||
| 2026-02-12 | 13F | Swiss National Bank | 60.600 | 1,85 | 3.237 | -7,25 | ||||
| 2026-02-17 | 13F | Creative Planning | 73.264 | 111,21 | 3.914 | 92,38 | ||||
| 2025-11-06 | 13F | Whipplewood Advisors, LLC | 0 | -100,00 | 0 | |||||
| 2026-02-10 | 13F | Acadian Asset Management Llc | 62.505 | 3 | ||||||
| 2026-01-27 | 13F | Belpointe Asset Management LLC | 12.022 | 7,20 | 642 | -2,28 | ||||
| 2026-02-11 | 13F | Manchester Capital Management LLC | 24 | 1 | ||||||
| 2026-02-17 | 13F | Tower Research Capital LLC (TRC) | 1.128 | -64,88 | 60 | -68,09 | ||||
| 2026-02-13 | 13F | National Bank Of Canada /fi/ | 2 | 0 | ||||||
| 2026-04-23 | 13F | Marquette Asset Management, LLC | 0 | -100,00 | 0 | |||||
| 2026-02-13 | 13F | Public Employees Retirement Association Of Colorado | 3.456 | 0,00 | 0 | |||||
| 2026-02-17 | 13F | Graham Capital Management, L.P. | 8.226 | -38,20 | 439 | -43,72 | ||||
| 2026-02-17 | 13F | Aster Capital Management (DIFC) Ltd | 435 | 23 | ||||||
| 2026-04-10 | 13F | Novem Group | 9.293 | 0,00 | 468 | -5,85 | ||||
| 2026-04-24 | 13F | Root Financial Partners, LLC | 316 | 68,09 | 16 | 50,00 | ||||
| 2026-02-04 | 13F | Versor Investments LP | 17.731 | 196,46 | 947 | 170,57 | ||||
| 2025-11-13 | 13F | Glenmede Investment Management, LP | 7.477 | 3,85 | 439 | 34,36 | ||||
| 2026-02-17 | 13F | Bridgeway Capital Management Inc | 45.000 | -10,00 | 2.404 | -18,07 | ||||
| 2026-02-13 | 13F | Parkside Financial Bank & Trust | 356 | 6,91 | 19 | 0,00 | ||||
| 2026-01-29 | 13F | Teachers Retirement System Of The State Of Kentucky | 7.540 | -11,92 | 0 | |||||
| 2026-02-12 | 13F | DRW Securities, LLC | 11.247 | 89,95 | 601 | 73,91 | ||||
| 2026-02-17 | 13F | Quantinno Capital Management LP | 10.612 | 55,76 | 567 | 41,85 | ||||
| 2026-02-12 | 13F | Wealthspire Advisors, LLC | 0 | -100,00 | 0 | |||||
| 2026-02-17 | 13F | Qube Research & Technologies Ltd | 453.383 | 155,90 | 24.220 | 133,05 | ||||
| 2026-02-04 | 13F | Pacer Advisors, Inc. | 0 | -100,00 | 0 | |||||
| 2026-04-21 | 13F | Robeco Institutional Asset Management B.V. | 3.998 | 0,00 | 201 | -5,63 | ||||
| 2026-02-11 | 13F | Inceptionr Llc | 0 | -100,00 | 0 | |||||
| 2026-01-12 | 13F | Rialto Wealth Management, LLC | 5 | -16,67 | 0 | |||||
| 2026-02-17 | 13F | MIRAE ASSET GLOBAL ETFS HOLDINGS Ltd. | 14.635 | -0,33 | 782 | -9,29 | ||||
| 2025-11-13 | 13F | CLARET ASSET MANAGEMENT Corp | 0 | -100,00 | 0 | -100,00 | ||||
| 2026-04-16 | 13F | Baron Wealth Management LLC | 7.997 | 15,86 | 403 | 9,24 | ||||
| 2026-01-26 | 13F | Cwm, Llc | 11.388 | 0,18 | 1 | |||||
| 2026-02-13 | 13F | Cornerstone Financial Management LLC | 10 | 1 | ||||||
| 2026-02-12 | 13F | Sprott Inc. | 220.000 | 0,00 | 11.752 | -8,93 | ||||
| 2026-04-08 | 13F | DiNuzzo Private Wealth, Inc. | 6 | 0,00 | 0 | |||||
| 2025-11-14 | 13F | Balyasny Asset Management Llc | 0 | -100,00 | 0 | |||||
| 2026-02-17 | 13F | Caption Management, LLC | Call | 0 | -100,00 | 0 | ||||
| 2026-02-11 | 13F | Simplex Trading, Llc | Call | 200 | -83,33 | 11 | ||||
| 2026-04-13 | 13F | True Wealth Design, LLC | 79 | 0,00 | 4 | -25,00 | ||||
| 2026-01-29 | 13F | Dunhill Financial, LLC | 37 | 2 | ||||||
| 2026-02-11 | 13F | Simplex Trading, Llc | Put | 5.800 | 286,67 | 310 | ||||
| 2026-02-11 | 13F | Simplex Trading, Llc | 2.708 | 82,85 | 145 | |||||
| 2025-11-03 | 13F | Cypress Capital Management LLC (WY) | 0 | -100,00 | 0 | -100,00 | ||||
| 2026-02-12 | 13F | CIBC Private Wealth Group, LLC | 7 | 0 | ||||||
| 2026-02-13 | 13F | Walleye Trading LLC | Call | 0 | -100,00 | 0 | ||||
| 2026-01-26 | 13F | Mirae Asset Global Investments Co., Ltd. | 27.229 | -3,06 | 1.375 | -16,51 | ||||
| 2026-02-11 | 13F | Allianz Asset Management GmbH | 33.682 | -62,46 | 1.799 | -65,82 | ||||
| 2026-02-10 | 13F | Bnp Paribas Arbitrage, Sa | 230.810 | 49,90 | 12.330 | 36,50 | ||||
| 2026-02-13 | 13F | Walleye Trading LLC | 0 | -100,00 | 0 | |||||
| 2026-04-07 | 13F | Signaturefd, Llc | 3.397 | 25,07 | 171 | 17,93 | ||||
| 2026-04-13 | 13F | Massmutual Trust Co Fsb/adv | 114 | -9,52 | 6 | -16,67 | ||||
| 2026-02-10 | 13F | Bank of New York Mellon Corp | 645.524 | 24,57 | 34.484 | 13,45 | ||||
| 2026-02-13 | 13F | Smartleaf Asset Management LLC | 869 | 21,71 | 47 | 9,52 | ||||
| 2026-02-10 | 13F | Bruce G. Allen Investments, LLC | 8 | 100,00 | 0 | |||||
| 2026-02-12 | 13F | Nuveen, LLC | 397.010 | -2,30 | 21.208 | -11,03 | ||||
| 2025-11-06 | 13F | Bryce Point Capital, LLC | 0 | -100,00 | 0 | |||||
| 2026-02-17 | 13F | Optiver Holding B.V. | 0 | -100,00 | 0 | |||||
| 2026-02-17 | 13F | Trexquant Investment LP | 60.209 | -7,45 | 3.216 | -15,72 | ||||
| 2026-01-27 | 13F | Zurcher Kantonalbank (Zurich Cantonalbank) | 6.331 | 0,00 | 338 | -8,89 | ||||
| 2026-02-12 | 13F | Commonwealth Equity Services, Llc | 4.450 | -27,97 | 238 | |||||
| 2026-04-24 | 13F | Yousif Capital Management, Llc | 8.047 | -0,96 | 405 | -7,53 | ||||
| 2026-04-22 | 13F | Pictet Asset Management Holding SA | 5.205 | 21,73 | 262 | 14,91 | ||||
| 2026-02-09 | 13F | Quest Partners LLC | 18.214 | -15,12 | 973 | -22,73 | ||||
| 2026-02-12 | 13F | Skandinaviska Enskilda Banken AB (publ) | 83.566 | -32,88 | 4.464 | -38,87 | ||||
| 2026-02-18 | 13F | Vident Advisory, LLC | 14.982 | 2,15 | 800 | -6,98 | ||||
| 2026-02-17 | 13F | Magnetar Financial LLC | 56.744 | 3.031 | ||||||
| 2026-04-14 | 13F | Bay Harbor Wealth Management, LLC | 10 | 25,00 | 1 | |||||
| 2026-02-11 | 13F | Group One Trading, L.p. | 1.866 | 2,08 | 100 | -7,48 | ||||
| 2026-02-11 | 13F | Group One Trading, L.p. | Put | 300 | -62,50 | 16 | -65,22 | |||
| 2026-02-11 | 13F | IMA Wealth, Inc. | 28 | 1 | ||||||
| 2026-02-13 | 13F | Public Sector Pension Investment Board | 0 | -100,00 | 0 | |||||
| 2026-02-06 | 13F | Lsv Asset Management | 5.500 | 0,00 | 0 | |||||
| 2026-02-13 | 13F | Barclays Plc | 56.692 | -14,75 | 3.028 | -22,36 | ||||
| 2026-02-17 | 13F | Susquehanna International Group, Llp | Call | 28.800 | -55,00 | 1.538 | -59,03 | |||
| 2026-02-12 | 13F | BlackRock, Inc. | 4.699.599 | 4,70 | 251.053 | -4,65 | ||||
| 2026-02-17 | 13F | Susquehanna International Group, Llp | Put | 42.800 | -51,14 | 2.286 | -55,51 | |||
| 2026-02-09 | 13F | Geode Capital Management, Llc | 902.590 | 0,50 | 48.223 | -8,48 | ||||
| 2026-02-17 | 13F | Numerai GP LLC | 5.529 | -81,85 | 295 | -83,48 | ||||
| 2026-02-13 | 13F | Ubs Asset Management Americas Inc | 54.632 | -1,28 | 2.918 | -10,10 | ||||
| 2026-02-02 | 13F | Horizon Investments, LLC | 27.978 | 3,31 | 1.404 | -11,03 | ||||
| 2026-04-21 | 13F | Gilpin Wealth Management, Llc | 7 | 250,00 | 0 | |||||
| 2026-02-17 | 13F | Citadel Advisors Llc | Put | 21.400 | 181,58 | 1.143 | 156,85 | |||
| 2026-02-12 | 13F | Campbell & CO Investment Adviser LLC | 45.534 | 2.432 | ||||||
| 2026-02-17 | 13F | Citadel Advisors Llc | Call | 32.700 | -38,88 | 1.747 | -44,36 | |||
| 2026-02-17 | 13F | Citadel Advisors Llc | 63.425 | 52,72 | 3.388 | 39,08 | ||||
| 2026-02-05 | 13F | Chase Investment Counsel Corp | 23.318 | 1 | ||||||
| 2025-11-21 | 13F | Nebula Research & Development LLC | 0 | -100,00 | 0 | |||||
| 2026-04-16 | 13F | Capital Advisors, Ltd. LLC | 369 | 0,00 | 0 | |||||
| 2026-02-11 | 13F | Cerity Partners LLC | 6.054 | 44,80 | 323 | 31,84 | ||||
| 2026-02-13 | 13F | Victory Capital Management Inc | 696.957 | 11,38 | 37.231 | 1,43 | ||||
| 2026-01-28 | 13F | Salomon & Ludwin, LLC | 261 | -23,68 | 14 | -26,32 | ||||
| 2026-01-14 | 13F | TrueMark Investments, LLC | 0 | -100,00 | 0 | |||||
| 2026-04-13 | 13F | Artemis Investment Management LLP | 0 | -100,00 | 0 | |||||
| 2026-01-28 | 13F | WPG Advisers, LLC | 86 | 0,00 | 5 | -20,00 | ||||
| 2026-04-06 | 13F | CX Institutional | 30 | -45,45 | 0 | |||||
| 2026-02-05 | 13F | Cambridge Investment Research Advisors, Inc. | 8.893 | -0,74 | 0 | |||||
| 2026-02-17 | 13F | Algert Global Llc | 143.037 | -22,05 | 8 | -30,00 | ||||
| 2026-02-13 | 13F | First Trust Advisors Lp | 71.482 | -4,42 | 3.819 | -12,97 | ||||
| 2026-02-10 | 13F | Nomura Asset Management Co Ltd | 510 | 0,00 | 27 | -6,90 | ||||
| 2026-02-09 | 13F | Optimist Retirement Group LLC | 8.519 | -0,47 | 455 | -9,36 | ||||
| 2026-01-28 | 13F | DekaBank Deutsche Girozentrale | 25.954 | 0,00 | 1 | 0,00 | ||||
| 2026-02-17 | 13F | Kensington Investment Counsel, LLC | 4.095 | -1,87 | 219 | -10,66 | ||||
| 2026-01-05 | 13F | RK Asset Management, LLC | 197.182 | -1,36 | 11 | -9,09 | ||||
| 2025-11-17 | 13F | Caxton Associates Llp | 0 | -100,00 | 0 | -100,00 | ||||
| 2026-02-13 | 13F | Umb Bank N A/mo | 1.777 | 7,83 | 95 | -2,08 | ||||
| 2026-02-13 | 13F | Squarepoint Ops LLC | 122.807 | 43,55 | 6.560 | 30,73 | ||||
| 2026-02-13 | 13F | Segall Bryant & Hamill, Llc | 12.896 | -73,69 | 689 | -76,06 | ||||
| 2026-02-12 | 13F | Jane Street Group, Llc | 0 | -100,00 | 0 | -100,00 | ||||
| 2026-01-21 | 13F | Newbridge Financial Services Group, Inc. | 2.164 | 0,00 | 116 | -8,73 | ||||
| 2026-02-17 | 13F | Jones Financial Companies Lllp | 652 | 0,77 | 35 | -10,53 | ||||
| 2026-02-10 | 13F | Quantbot Technologies LP | 7.763 | -87,81 | 415 | -88,91 | ||||
| 2025-11-14 | 13F | Aigen Investment Management, Lp | 0 | -100,00 | 0 | |||||
| 2026-02-17 | 13F | Northern Trust Corp | 298.965 | -6,37 | 15.971 | -14,73 | ||||
| 2026-02-19 | 13F | Invesco Ltd. | 340.416 | 2,48 | 18.185 | -6,67 | ||||
| 2026-02-13 | 13F | American Century Companies Inc | 1.265.095 | 4,56 | 67.581 | -4,78 | ||||
| 2026-02-17 | 13F | Altshuler Shaham Ltd | 71 | -2,74 | 4 | -25,00 | ||||
| 2026-02-13 | 13F | Landscape Capital Management, L.l.c. | 89.806 | -9,18 | 4.797 | -17,29 | ||||
| 2026-04-16 | 13F | Clark Asset Management, LLC | 5.717 | 0,00 | 288 | -5,90 | ||||
| 2026-02-17 | 13F | Capstone Investment Advisors, Llc | 0 | -100,00 | 0 | -100,00 | ||||
| 2026-02-17 | 13F | ExodusPoint Capital Management, LP | 0 | -100,00 | 0 | -100,00 | ||||
| 2025-11-14 | 13F | Aquatic Capital Management LLC | 0 | -100,00 | 0 | |||||
| 2026-02-17 | 13F | Capital Fund Management S.a. | 24.096 | -41,65 | 1.287 | -46,86 | ||||
| 2026-01-29 | 13F | Polaris Capital Management, LLC | 25.000 | 3,73 | 1.336 | -5,52 | ||||
| 2026-01-15 | 13F | Range Financial Group LLC | 9.376 | 4,70 | 501 | -4,76 | ||||
| 2026-04-17 | 13F | AdvisorNet Financial, Inc | 400 | 0,00 | 20 | -4,76 | ||||
| 2026-02-17 | 13F | Schonfeld Strategic Advisors LLC | 22.445 | -76,59 | 1.199 | -78,68 | ||||
| 2026-02-05 | 13F | Burford Brothers, Inc. | 16.438 | 1,18 | 878 | -7,87 | ||||
| 2025-11-14 | 13F | Point72 Asia (Singapore) Pte. Ltd. | 0 | -100,00 | 0 | |||||
| 2026-02-17 | 13F | Two Sigma Advisers, Lp | 122.911 | 33,44 | 6.566 | 21,51 | ||||
| 2025-11-12 | 13F | CIBC Bancorp USA Inc. | 4.142 | 243 | ||||||
| 2026-04-21 | 13F | GHP Investment Advisors, Inc. | 2 | 0 | ||||||
| 2026-04-24 | 13F | James Investment Research Inc | 11.528 | 0,13 | 581 | -5,69 | ||||
| 2026-02-12 | 13F | Hrt Financial Lp | 50.304 | -17,01 | 3 | -33,33 | ||||
| 2026-02-13 | 13F | Edgestream Partners, L.P. | 20.979 | -80,40 | 1.121 | -82,16 | ||||
| 2026-02-13 | 13F | Maverick Capital Ltd | 61.083 | -40,50 | 3.263 | -45,82 | ||||
| 2026-01-28 | 13F | Klp Kapitalforvaltning As | 13.100 | -2,96 | 700 | -11,63 | ||||
| 2026-02-17 | 13F | State Of Wisconsin Investment Board | 6.573 | 47,11 | 351 | 33,97 | ||||
| 2026-02-12 | 13F | Ankerstar Wealth, LLC | 12 | 1 | ||||||
| 2026-01-16 | 13F | Oldfather Financial Services, LLC | 43.986 | 0,01 | 2.350 | -8,95 | ||||
| 2026-01-16 | 13F | Crewe Advisors LLC | 6 | 0 | ||||||
| 2026-02-11 | 13F | Group One Trading, L.p. | Call | 0 | -100,00 | 0 | -100,00 | |||
| 2026-03-06 | 13F | Hsbc Holdings Plc | 0 | -100,00 | 0 | |||||
| 2026-02-13 | 13F | Baird Financial Group, Inc. | 52.249 | -33,70 | 2.791 | -39,61 | ||||
| 2026-02-12 | 13F | Advisors Asset Management, Inc. | 240.259 | -9,36 | 12.835 | -17,46 | ||||
| 2026-02-13 | 13F | Bridgewater Associates, LP | 0 | -100,00 | 0 | |||||
| 2026-02-05 | 13F | HFM Investment Advisors, LLC | 3 | 0,00 | 0 | |||||
| 2026-02-17 | 13F | Two Sigma Investments, Lp | 211.694 | -12,71 | 11.309 | -20,51 | ||||
| 2026-02-05 | 13F | Amalgamated Bank | 8.798 | 0,43 | 0 | |||||
| 2026-01-16 | 13F | Empirical Financial Services, LLC d.b.a. Empirical Wealth Management | 19.674 | 22,94 | 1.051 | 11,94 | ||||
| 2026-02-17 | 13F | Janus Henderson Group Plc | 13.040 | -92,81 | 697 | -93,46 | ||||
| 2026-02-13 | 13F | Morgan Stanley | 1.244.389 | 26,84 | 66.475 | 15,51 | ||||
| 2026-02-17 | 13F | Signature Equity Partners, LLC | 17 | 1 | ||||||
| 2026-01-23 | 13F | Beacon Harbor Wealth Advisors, Inc. | 0 | -100,00 | 0 | |||||
| 2026-02-17 | 13F | Beacon Investment Advisors Llc | 35.725 | 1,27 | 1.908 | -7,78 | ||||
| 2026-02-17 | 13F | Summit Street Capital Management, LLC | 262.060 | -22,42 | 13.999 | -29,35 | ||||
| 2026-04-07 | 13F | CoreCap Advisors, LLC | 1.320 | 0,00 | 66 | -5,71 | ||||
| 2026-02-10 | 13F | Commonwealth Of Pennsylvania Public School Empls Retrmt Sys | 7.457 | -2,79 | 398 | -11,36 | ||||
| 2026-02-13 | 13F | Y-Intercept (Hong Kong) Ltd | 103.353 | 5.521 | ||||||
| 2026-02-12 | 13F | EAM Investors, LLC | 0 | -100,00 | 0 | |||||
| 2026-02-13 | 13F | Prudential Financial Inc | 29.304 | -7,21 | 1.565 | -15,50 | ||||
| 2026-02-17 | 13F | Summit Global Investments | 23.874 | 36,12 | 1 | 0,00 | ||||
| 2026-01-21 | 13F | Flagship Harbor Advisors, Llc | 5 | 0 | ||||||
| 2026-02-13 | 13F | Ieq Capital, Llc | 34.382 | 8,19 | 1.837 | -1,50 | ||||
| 2026-02-17 | 13F | D. E. Shaw & Co., Inc. | 43.636 | -36,21 | 2.331 | -41,90 | ||||
| 2026-02-17 | 13F | Lazard Asset Management Llc | 25.506 | 261,33 | 1.363 | 228,99 | ||||
| 2026-02-06 | 13F | Pnc Financial Services Group, Inc. | 1.696 | 4,18 | 91 | -5,26 | ||||
| 2026-02-09 | 13F | Jackson Creek Investment Advisors LLC | 39.051 | -4,11 | 2 | 0,00 | ||||
| 2026-02-11 | 13F | Vestcor Inc | 65.603 | 55,24 | 4 | 50,00 | ||||
| 2026-02-04 | 13F | Swiss Life Asset Management Ltd | 4.039 | 216 | ||||||
| 2026-04-07 | 13F | Farther Finance Advisors, LLC | 233 | 323,64 | 12 | 450,00 | ||||
| 2026-02-11 | 13F | Jpmorgan Chase & Co | 231.819 | -19,76 | 12.384 | -26,94 | ||||
| 2026-02-17 | 13F | Royal Bank Of Canada | 7.617 | -70,68 | 407 | -73,28 | ||||
| 2026-01-28 | 13F | Universal- Beteiligungs- und Servicegesellschaft mbH | 8.684 | -10,12 | 465 | -17,84 | ||||
| 2026-02-10 | 13F | State of Wyoming | 24.468 | -15,70 | 1.307 | -23,21 | ||||
| 2026-02-13 | 13F | Great West Life Assurance Co /can/ | 33.767 | 7,19 | 2 | 0,00 | ||||
| 2026-02-17 | 13F | Point72 Asset Management, L.P. | 0 | -100,00 | 0 | |||||
| 2026-02-13 | 13F | Diametric Capital, LP | 11.020 | 589 | ||||||
| 2026-02-13 | 13F | Quarry LP | 84 | -92,46 | 4 | -93,85 | ||||
| 2025-11-14 | 13F | Walleye Trading LLC | Put | 0 | -100,00 | 0 | -100,00 | |||
| 2026-02-10 | 13F | Intech Investment Management Llc | 134.849 | 172,32 | 7.204 | 148,04 | ||||
| 2026-02-12 | 13F | Renaissance Technologies Llc | 1.095.202 | -5,28 | 58.506 | -13,75 | ||||
| 2026-04-09 | 13F | Wealth Alliance Advisory Group, LLC | 54.700 | 77,02 | 2.755 | 66,91 | ||||
| 2026-01-27 | 13F | WealthCollab, LLC | 567 | 0,00 | 30 | -9,09 | ||||
| 2026-02-17 | 13F/A | RBF Capital, LLC | 30.000 | 0,00 | 1.603 | -8,93 | ||||
| 2026-02-11 | 13F | LPL Financial LLC | 4.712 | -19,32 | 252 | -26,61 | ||||
| 2026-02-02 | 13F | Qrg Capital Management, Inc. | 13.400 | 21,50 | 716 | 10,68 | ||||
| 2026-02-17 | 13F | Engineers Gate Manager LP | 83.206 | 52,45 | 4.445 | 38,83 | ||||
| 2026-02-17 | 13F | Russell Investments Group, Ltd. | 35.364 | -23,12 | 1.889 | -29,99 | ||||
| 2026-02-12 | 13F | Steward Partners Investment Advisory, Llc | 4.330 | 231 | ||||||
| 2026-04-20 | 13F | State of Alaska, Department of Revenue | 26.441 | -1,72 | 1 | 0,00 | ||||
| 2026-02-09 | 13F | Huntington National Bank | 0 | -100,00 | 0 | |||||
| 2026-02-13 | 13F | BNP Paribas Asset Management Holding S.A. | 0 | -100,00 | 0 | |||||
| 2026-02-13 | 13F | Dynamic Technology Lab Private Ltd | 5.888 | -58,77 | 314 | -62,53 | ||||
| 2026-01-30 | 13F | Turning Point Benefit Group, Inc. | 16 | 1 | ||||||
| 2026-02-09 | 13F | Royce & Associates Lp | 150.942 | -8,75 | 8.063 | -16,90 | ||||
| 2026-01-20 | 13F | Harbor Capital Advisors, Inc. | 275 | -1,79 | 0 | |||||
| 2026-02-17 | 13F | PharVision Advisers, LLC | 0 | -100,00 | 0 | |||||
| 2026-02-12 | 13F | Federation des caisses Desjardins du Quebec | 150 | 0,00 | 8 | 0,00 | ||||
| 2026-02-12 | 13F | State Board Of Administration Of Florida Retirement System | 26.471 | 0,71 | 1.414 | -8,24 | ||||
| 2026-02-05 | 13F | Allworth Financial LP | 840 | 7,14 | 45 | -2,22 | ||||
| 2026-02-13 | 13F | JustInvest LLC | 6.577 | 1,62 | 351 | -7,39 | ||||
| 2026-04-13 | 13F | IFP Advisors, Inc | 2.752 | 10,92 | 139 | 4,55 | ||||
| 2026-04-15 | 13F | Fortitude Family Office, LLC | 35 | 133,33 | 2 | |||||
| 2026-01-23 | 13F | Assetmark, Inc | 6 | 0 | ||||||
| 2026-04-20 | 13F | Jfs Wealth Advisors, Llc | 31 | 19,23 | 2 | 0,00 | ||||
| 2026-02-17 | 13F | Susquehanna International Group, Llp | 0 | -100,00 | 0 | |||||
| 2025-11-14 | 13F | Skopos Labs, Inc. | 0 | -100,00 | 0 | |||||
| 2026-02-03 | 13F | Bokf, Na | 9.843 | -0,49 | 526 | -9,48 | ||||
| 2025-11-12 | 13F | Bellwether Advisors, LLC | 0 | -100,00 | 0 | |||||
| 2025-10-30 | 13F | Twin Peaks Wealth Advisors, LLC | 0 | -100,00 | 0 | |||||
| 2026-02-17 | 13F | Lotus Technology Management, LP | 45.108 | 2.410 | ||||||
| 2026-02-17 | 13F | Palisade Capital Management Llc/nj | 482.384 | -10,73 | 25.769 | -18,71 | ||||
| 2026-02-05 | 13F | Td Private Client Wealth Llc | 64 | 3 | ||||||
| 2026-02-09 | 13F | Hantz Financial Services, Inc. | 702 | 51,62 | 0 | |||||
| 2026-04-24 | 13F | My Purposeful Wealth Corp. | 61.439 | 0,00 | 3.094 | -5,73 | ||||
| 2025-11-14 | 13F | Wolverine Trading, Llc | Call | 4.500 | 266 | |||||
| 2026-02-13 | 13F | Walleye Capital LLC | Put | 0 | -100,00 | 0 | ||||
| 2026-02-17 | 13F | Occudo Quantitative Strategies Lp | 6.102 | -49,64 | 326 | -54,23 | ||||
| 2026-02-09 | 13F | Hartland & Co., LLC | 0 | -100,00 | 0 | |||||
| 2026-01-16 | 13F | Longboard Asset Management, LP | 0 | -100,00 | 0 | |||||
| 2026-01-08 | 13F | Lincoln Capital LLC | 10.300 | 550 | ||||||
| 2025-11-13 | 13F | Jump Financial, LLC | 0 | -100,00 | 0 | |||||
| 2026-01-15 | 13F | Nisa Investment Advisors, Llc | 20.751 | -17,76 | 1.109 | -25,14 | ||||
| 2026-02-13 | 13F | Centiva Capital, LP | 6.510 | 348 | ||||||
| 2026-02-17 | 13F | Tudor Investment Corp Et Al | 150.189 | 838,51 | 8.023 | 755,33 | ||||
| 2026-02-17 | 13F | Miller Value Partners, Llc | 0 | -100,00 | 0 | |||||
| 2026-02-17 | 13F | Gotham Asset Management, LLC | 28.830 | 96,59 | 1.540 | 79,07 | ||||
| 2026-02-04 | 13F | Oregon Public Employees Retirement Fund | 6.918 | 1,50 | 370 | -7,52 | ||||
| 2026-02-17 | 13F | Voloridge Investment Management, Llc | 63.644 | 3.400 | ||||||
| 2026-02-13 | 13F | Natixis | 0 | -100,00 | 0 | |||||
| 2026-04-23 | 13F | Klein Pavlis & Peasley Financial, Inc. | 23.100 | 4,05 | 1.163 | -1,86 | ||||
| 2026-04-07 | 13F | Retirement Wealth Solutions LLC | 8 | 166,67 | 0 | |||||
| 2026-02-04 | 13F | Virginia Retirement Systems Et Al | 0 | -100,00 | 0 | |||||
| 2026-02-13 | 13F | Verition Fund Management LLC | 5.329 | -53,90 | 285 | -58,11 | ||||
| 2026-01-29 | 13F | UBS Group AG | 489.306 | 32,57 | 26.139 | 20,73 | ||||
| 2026-02-17 | 13F | Miller Capital Partners, Inc. | 700 | 37 | ||||||
| 2026-02-12 | 13F | New York State Common Retirement Fund | 201.230 | -4,73 | 10.750 | -13,24 | ||||
| 2026-02-13 | 13F | Walleye Capital LLC | Call | 0 | -100,00 | 0 | ||||
| 2026-02-17 | 13F | SageView Advisory Group, LLC | 3 | 0 | ||||||
| 2026-02-13 | 13F | Sei Investments Co | 50.681 | -9,18 | 2.707 | -17,29 | ||||
| 2026-03-03 | 13F/A | Absoluto Partners Gestao de Recursos Ltda | 0 | -100,00 | 0 | |||||
| 2026-01-30 | 13F | Us Bancorp \de\ | 345 | -2,82 | 18 | -10,00 | ||||
| 2026-02-17 | 13F | Mercer Global Advisors Inc /adv | 20.519 | 3,19 | 1.096 | -6,00 | ||||
| 2026-02-10 | 13F | Rothschild Investment Llc | 88 | 60,00 | 5 | 33,33 | ||||
| 2026-04-09 | 13F | OFS Enterprise LLC | 43.349 | 2.183 | ||||||
| 2025-11-14 | 13F | Draper Asset Management, LLC | 0 | -100,00 | 0 | -100,00 | ||||
| 2026-02-17 | 13F | Brevan Howard Capital Management LP | 0 | -100,00 | 0 | |||||
| 2026-02-13 | 13F | Impala Asset Management LLC | 400.119 | 68,12 | 21.374 | 53,10 | ||||
| 2026-02-06 | 13F | Global Retirement Partners, LLC | 3.238 | 1.371,82 | 173 | 1.333,33 | ||||
| 2026-01-28 | 13F | Arizona State Retirement System | 8.556 | -5,79 | 457 | -14,10 | ||||
| 2026-04-10 | 13F | Viking Fund Management Llc | 8.000 | 403 | ||||||
| 2026-02-17 | 13F | Price T Rowe Associates Inc /md/ | 18.306 | 8,26 | 1 | |||||
| 2026-02-03 | 13F | Jlb & Associates Inc | 5.000 | 0,00 | 267 | -8,87 | ||||
| 2025-11-14 | 13F | Point72 Europe (London) LLP | 253 | 15 | ||||||
| 2026-02-13 | 13F | Mariner, LLC | 8.581 | 15,31 | 459 | 5,05 | ||||
| 2026-02-17 | 13F | Aqr Capital Management Llc | 206.288 | 6,41 | 11.020 | -3,10 | ||||
| 2026-03-12 | 13F/A | Peak6 Llc | Call | 33.200 | -60,00 | 1.774 | -63,58 | |||
| 2026-02-18 | 13F | Garton & Associates Financial Advisors LLC | 178 | 10 | ||||||
| 2026-02-17 | 13F | Millennium Management Llc | 50.148 | -45,22 | 2.679 | -50,12 | ||||
| 2026-01-29 | 13F | Vanguard Group Inc | 3.970.767 | 2,30 | 212.118 | -6,83 | ||||
| 2025-11-17 | 13F | PDT Partners, LLC | 0 | -100,00 | 0 | -100,00 | ||||
| 2026-02-17 | 13F | Public Employees Retirement System Of Ohio | 819 | -3,19 | 44 | -12,24 | ||||
| 2026-02-13 | 13F | State Street Corp | 1.321.675 | 4,33 | 70.604 | -4,99 | ||||
| 2026-02-13 | 13F | Macquarie Group Ltd | 0 | -100,00 | 0 | |||||
| 2026-01-21 | 13F | Unison Advisors LLC | 42.045 | 0,63 | 2.246 | -8,33 | ||||
| 2026-02-02 | 13F | Principal Financial Group Inc | 144.098 | -1,14 | 7.698 | -9,98 | ||||
| 2025-11-05 | 13F | Ceera Investments, Llc | 0 | -100,00 | 0 | |||||
| 2026-04-06 | 13F | Versant Capital Management, Inc | 528 | -36,61 | 27 | -40,91 | ||||
| 2026-02-13 | 13F | S&t Bank/pa | 675 | -2,03 | 36 | -10,00 | ||||
| 2026-01-22 | 13F/A | Cresset Asset Management, LLC | 0 | -100,00 | 0 | |||||
| 2026-02-10 | 13F | Goldman Sachs Group Inc | 1.043.548 | 44,90 | 55.746 | 31,96 | ||||
| 2026-02-17 | 13F | Kemnay Advisory Services Inc. | 1.506 | 80 | ||||||
| 2026-04-15 | 13F | Exchange Traded Concepts, Llc | 6.978 | 276,38 | 351 | 254,55 | ||||
| 2026-02-11 | 13F | Deutsche Bank Ag\ | 28.013 | -70,72 | 1.496 | -73,34 | ||||
| 2026-02-03 | 13F | Denali Advisors Llc | 107.700 | -19,99 | 5.753 | -27,13 | ||||
| 2026-02-18 | 13F | Mackenzie Financial Corp | 36.133 | 65,81 | 1.937 | 51,49 | ||||
| 2026-02-11 | 13F | Parallel Advisors, LLC | 287 | 0,00 | 15 | -6,25 | ||||
| 2026-02-17 | 13F | Boothbay Fund Management, Llc | 0 | -100,00 | 0 | |||||
| 2026-02-09 | 13F | Legal & General Group Plc | 82.778 | -1,44 | 4.422 | -10,23 | ||||
| 2025-11-12 | 13F | 111 Capital | 0 | -100,00 | 0 | |||||
| 2026-02-12 | 13F | MetLife Investment Management, LLC | 17.767 | -4,52 | 949 | -13,02 | ||||
| 2026-02-12 | 13F | Cloud Capital Management, LLC | 0 | -100,00 | 0 | |||||
| 2026-02-17 | 13F | Nomura Holdings Inc | 0 | -100,00 | 0 | |||||
| 2026-02-05 | 13F | Bessemer Group Inc | 193 | 12,87 | 0 | |||||
| 2026-02-13 | 13F | Charles Schwab Investment Management Inc | 1.370.398 | 0,42 | 73.207 | -8,55 | ||||
| 2026-02-13 | 13F | Citigroup Inc | 43.390 | 152,14 | 2.318 | 129,63 | ||||
| 2026-02-02 | 13F | Fifth Third Bancorp | 316 | 6,04 | 17 | -5,88 | ||||
| 2026-02-11 | 13F | Franklin Resources Inc | 37.327 | 1,68 | 1.994 | -7,39 | ||||
| 2026-02-13 | 13F | Entropy Technologies, LP | 12.480 | 667 | ||||||
| 2026-02-17 | 13F | Voleon Capital Management Lp | 123.282 | 46,39 | 6.586 | 33,30 | ||||
| 2026-02-09 | 13F | Keating Financial Advisory Services, Inc. | 20 | 1 | ||||||
| 2026-02-11 | 13F | Winton Capital Group Ltd | 19.990 | 7,04 | 1.068 | -2,56 | ||||
| 2026-02-13 | 13F | Rafferty Asset Management, LLC | 6.460 | 12,64 | 345 | 2,68 | ||||
| 2026-01-29 | 13F | D.a. Davidson & Co. | 6.445 | 51,83 | 344 | 38,15 | ||||
| 2026-02-13 | 13F | Marshall Wace, Llp | 0 | -100,00 | 0 | |||||
| 2026-04-09 | 13F | Everhart Financial Group, Inc. | 5.996 | -1,87 | 302 | -7,67 | ||||
| 2026-02-13 | 13F | Arrowstreet Capital, Limited Partnership | 12.841 | 686 | ||||||
| 2026-02-17 | 13F | DZ BANK AG Deutsche Zentral Genossenschafts Bank, Frankfurt am Main | 17.979 | 38,52 | 908 | 19,32 | ||||
| 2026-02-17 | 13F | Twinbeech Capital Lp | 6.500 | 347 | ||||||
| 2026-02-09 | 13F | Jefferies Financial Group Inc. | 18.777 | 83,01 | 1.003 | 66,89 | ||||
| 2026-02-12 | 13F | Jane Street Group, Llc | Call | 24.900 | 49,10 | 1.330 | 35,85 | |||
| 2026-01-23 | 13F | Optima Capital Llc | 9 | 0 | ||||||
| 2026-02-03 | 13F | Everence Capital Management Inc | 5.380 | 0,00 | 0 | |||||
| 2026-02-12 | 13F | Jane Street Group, Llc | Put | 15.500 | 23,02 | 828 | 12,04 | |||
| 2025-11-14 | 13F | Bridgefront Capital, LLC | 0 | -100,00 | 0 | -100,00 | ||||
| 2026-02-06 | 13F | Bare Financial Services, Inc | 49 | -41,67 | 3 | -50,00 | ||||
| 2026-02-17 | 13F | Advisor Group Holdings, Inc. | 1.913 | -29,23 | 102 | -33,77 | ||||
| 2026-02-17 | 13F | Raymond James Financial Inc | 12.696 | -20,25 | 678 | -27,33 | ||||
| 2026-04-16 | 13F | SG Americas Securities, LLC | 13.618 | -50,87 | 1 | -100,00 | ||||
| 2025-11-14 | 13F | Cubist Systematic Strategies, LLC | 93.196 | 207,09 | 5.467 | 297,24 | ||||
| 2026-02-11 | 13F | Ameritas Investment Partners, Inc. | 17.617 | 941 | ||||||
| 2026-02-17 | 13F | Maryland State Retirement & Pension System | 4.389 | 1,36 | 234 | -7,51 | ||||
| 2026-02-12 | 13F | Quadrant Capital Group Llc | 1.310 | 3,39 | 70 | -6,76 | ||||
| 2026-04-20 | 13F | Banque Cantonale Vaudoise | 6.455 | 0,00 | 325 | -5,80 | ||||
| 2026-02-13 | 13F | Pinnacle Wealth Planning Services, Inc. | 804 | 43 | ||||||
| 2026-02-09 | 13F | Annis Gardner Whiting Capital Advisors, LLC | 21 | 0,00 | 1 | 0,00 | ||||
| 2026-04-15 | 13F | Redhawk Wealth Advisors, Inc. | 0 | -100,00 | 0 | |||||
| 2026-04-17 | 13F | Vermillion Wealth Management, Inc. | 3 | 0 | ||||||
| 2026-02-17 | 13F | Sherbrooke Park Advisers Llc | 0 | -100,00 | 0 | |||||
| 2026-02-13 | 13F | Fieldview Capital Management, LLC | 0 | -100,00 | 0 | |||||
| 2026-02-12 | 13F | Aviva Plc | 8.637 | 5,37 | 461 | -3,96 | ||||
| 2026-04-06 | 13F | GAMMA Investing LLC | 3.038 | -13,77 | 153 | -19,15 | ||||
| 2026-02-17 | 13F | Susquehanna Advisors Group, Inc. | 38.464 | 2.055 | ||||||
| 2026-02-12 | 13F | Principal Securities, Inc. | 0 | -100,00 | 0 | -100,00 | ||||
| 2026-02-17 | 13F | Glenmede Trust Co Na | 6.076 | -2,88 | 325 | 35,56 | ||||
| 2026-02-06 | 13F | Handelsbanken Fonder AB | 11.700 | 0,00 | 1 | |||||
| 2026-04-24 | 13F | Strs Ohio | 14.300 | -2,72 | 720 | -8,28 | ||||
| 2026-02-11 | 13F | Illinois Municipal Retirement Fund | 16.207 | 8,50 | 866 | -1,26 | ||||
| 2026-02-12 | 13F | Bank Of Montreal /can/ | 4.874 | -0,77 | 260 | -9,72 | ||||
| 2026-01-29 | 13F | Comerica Bank | 6.600 | -21,33 | 353 | -28,46 | ||||
| 2025-11-14 | 13F | ISAM Funds (UK) Ltd | 0 | -100,00 | 0 | |||||
| 2026-02-12 | 13F | Ensign Peak Advisors, Inc | 3.659 | -69,91 | 195 | -72,65 | ||||
| 2026-02-17 | 13F | Prelude Capital Management, Llc | 4.992 | 267 | ||||||
| 2026-02-12 | 13F | WealthPLAN Partners, LLC | 46.625 | 0,00 | 2.491 | -8,92 | ||||
| 2026-04-23 | 13F | Private Wealth Management Group, LLC | 33 | 0,00 | 2 | 0,00 | ||||
| 2026-01-29 | 13F | Camelot Portfolios, LLC | 4.017 | -15,24 | 215 | -22,74 | ||||
| 2026-04-22 | 13F | Sterling Capital Management LLC | 4.478 | -35,73 | 226 | -39,52 | ||||
| 2026-02-04 | 13F | Plato Investment Management Ltd | 21.819 | 1.171 | ||||||
| 2026-02-11 | 13F | Los Angeles Capital Management Llc | 161 | 9 | ||||||
| 2026-02-13 | 13F | Toroso Investments, LLC | 29.029 | 33,42 | 1.551 | 21,47 | ||||
| 2026-01-28 | 13F | Evergreen Private Wealth LLC | 0 | -100,00 | 0 | |||||
| 2026-02-13 | 13F | MAI Capital Management | 11 | -83,58 | 1 | -100,00 | ||||
| 2026-02-24 | 13F | DGS Capital Management, LLC | 7.810 | 30,06 | 417 | 18,47 | ||||
| 2026-02-13 | 13F | Police & Firemen's Retirement System of New Jersey | 8.761 | 0,18 | 468 | -8,59 | ||||
| 2026-04-23 | 13F | North Star Investment Management Corp. | 22.000 | 0,00 | 1.108 | -5,79 | ||||
| 2026-01-27 | 13F | First Horizon Corp | 75 | 0,00 | 4 | 0,00 | ||||
| 2026-02-10 | 13F | Norges Bank | 32.500 | 1.736 | ||||||
| 2026-02-06 | 13F | Covestor Ltd | 3.352 | 44,73 | 0 | |||||
| 2026-02-13 | 13F | Rhumbline Advisers | 107.652 | -7,28 | 5.751 | -15,57 | ||||
| 2026-01-30 | 13F | New York State Teachers Retirement System | 52.020 | 4,33 | 3 | 0,00 | ||||
| 2025-11-12 | 13F | South Dakota Investment Council | 0 | -100,00 | 0 | |||||
| 2026-02-06 | 13F | EverSource Wealth Advisors, LLC | 795 | -22,97 | 42 | -30,00 | ||||
| 2026-04-20 | 13F | Louisiana State Employees Retirement System | 13.400 | -2,90 | 675 | -8,55 | ||||
| 2026-04-23 | 13F | SJS Investment Consulting Inc. | 50 | 900,00 | 3 | |||||
| 2026-02-17 | 13F | Bank Of America Corp /de/ | 207.257 | 8,94 | 11.072 | -0,80 | ||||
| 2026-02-17 | 13F | Man Group plc | 58.511 | 89,50 | 3.126 | 72,56 | ||||
| 2026-02-17 | 13F | Atom Investors LP | 7.974 | 426 | ||||||
| 2026-02-17 | 13F | Ameriprise Financial Inc | 65.696 | -4,33 | 3.509 | -12,86 | ||||
| 2026-04-08 | 13F | Wealth Enhancement Advisory Services, Llc | 7.109 | 24,17 | 356 | 11,95 | ||||
| 2026-02-17 | 13F | Amundi | 421.200 | 676,92 | 22.501 | 609,11 | ||||
| 2026-02-20 | 13F | Sunbelt Securities, Inc. | 35 | 0,00 | 2 | -50,00 | ||||
| 2026-02-05 | 13F | WealthPlan Investment Management, LLC | 13.451 | 0,01 | 719 | -8,88 | ||||
| 2026-01-28 | 13F | Teacher Retirement System Of Texas | 165.207 | 20,00 | 8.825 | 9,27 | ||||
| 2026-02-12 | 13F | Voya Investment Management Llc | 5.587 | -3,97 | 298 | -12,61 | ||||
| 2026-01-23 | 13F | Burney Co/ | 6.042 | 1,68 | 323 | -7,47 | ||||
| 2026-02-10 | 13F/A | Northwestern Mutual Wealth Management Co | 27 | 1 | ||||||
| 2026-01-21 | 13F | Signature Resources Capital Management, LLC | 5 | 0 | ||||||
| 2026-02-11 | 13F | Brandywine Global Investment Management, LLC | 200.382 | -3,38 | 10.704 | -12,01 | ||||
| 2025-11-12 | 13F | Picton Mahoney Asset Management | 0 | -100,00 | 0 | |||||
| 2026-02-13 | 13F | Wells Fargo & Company/mn | 54.545 | 26,64 | 2.914 | 15,32 | ||||
| 2026-02-09 | 13F | Atlantic Trust, LLC | 0 | -100,00 | 0 | |||||
| 2026-02-17 | 13F | Fmr Llc | 4.536 | 50,50 | 242 | 37,50 | ||||
| 2026-04-23 | 13F | Farmers & Merchants Investments Inc | 18 | 0,00 | 1 | |||||
| 2026-01-27 | 13F | Asset Management One Co., Ltd. | 25.282 | -44,27 | 1.362 | -48,85 | ||||
| 2026-03-03 | 13F/A | Caitong International Asset Management Co., Ltd | 1.648 | 88 | ||||||
| 2026-02-09 | 13F | Harbour Investments, Inc. | 472 | -14,34 | 25 | -21,87 | ||||
| 2025-11-14 | 13F | Texas Permanent School Fund | 0 | -100,00 | 0 | |||||
| 2026-02-18 | 13F | State of Tennessee, Treasury Department | 29.981 | 33,91 | 1.418 | 8,00 | ||||
| 2026-04-15 | 13F | Bayforest Capital Ltd | 874 | -73,75 | 44 | -75,14 | ||||
| 2026-02-17 | 13F | Canada Pension Plan Investment Board | 66.500 | 31,42 | 3.552 | 19,68 | ||||
| 2026-01-26 | 13F | KBC Group NV | 1.024 | 0,00 | 0 | |||||
| 2026-01-27 | 13F | Evergreen Capital Management Llc | 8.812 | 0,78 | 471 | -8,20 |