Grundlæggende statistik
| Institutionelle aktier (lange) | 51.274.908 - 33,25% (ex 13D/G) - change of -6,88MM shares -11,83% MRQ |
| Institutionel værdi (lang) | $ 69.098 USD ($1000) |
Institutionelt ejerskab og aktionærer
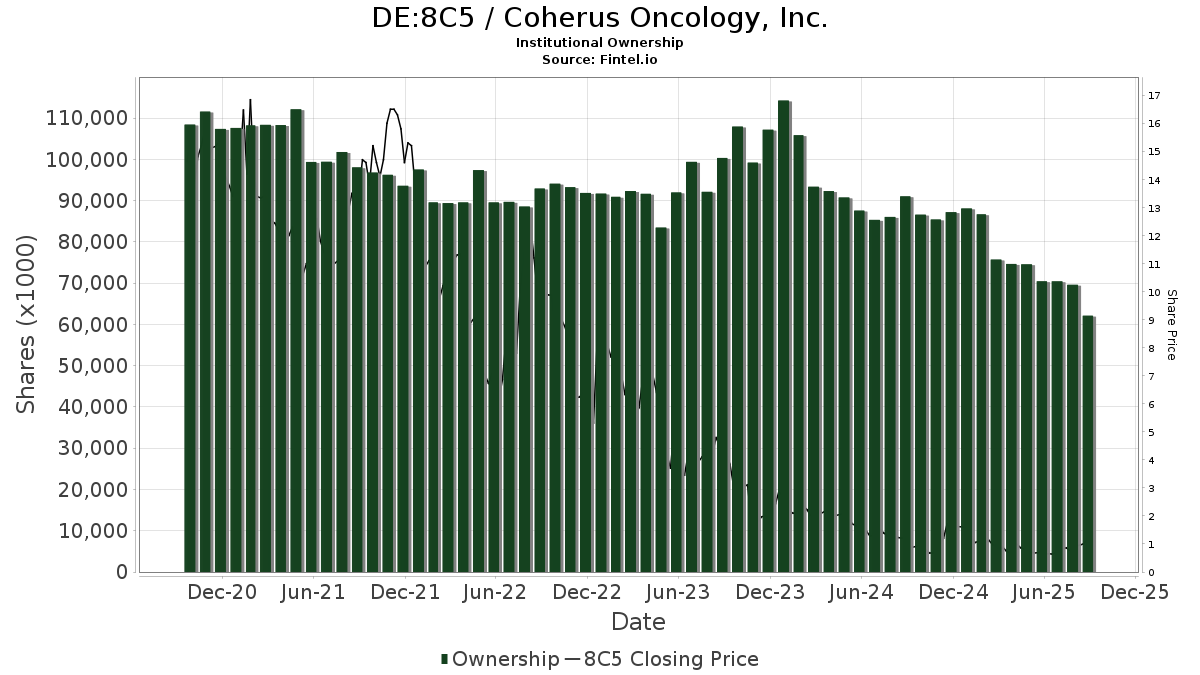
Coherus Oncology, Inc. (DE:8C5) har 133 institutionelle ejere og aktionærer, der har indsendt 13D/G- eller 13F-formularer til Securities Exchange Commission (SEC). Disse institutioner har i alt 51,274,908 aktier. Største aktionærer omfatter BlackRock, Inc., Vanguard Group Inc, Kohlberg Kravis Roberts & Co. L.P., Geode Capital Management, Llc, Tang Capital Management Llc, State Street Corp, CM Management, LLC, C WorldWide Group Holding A/S, Panagora Asset Management Inc, and Charles Schwab Investment Management Inc .
Coherus Oncology, Inc. (DB:8C5) institutionel ejerskabsstruktur viser aktuelle positioner i virksomheden efter institutioner og fonde, samt seneste ændringer i positionsstørrelse. Større aktionærer kan omfatte individuelle investorer, investeringsforeninger, hedgefonde eller institutioner. Skema 13D angiver, at investoren besidder (eller besidder) mere end 5 % af virksomheden og har til hensigt (eller har til hensigt at) aktivt at forfølge en ændring i forretningsstrategi. Skema 13G indikerer en passiv investering på over 5%.
The share price as of April 24, 2026 is 1,49 / share. Previously, on April 28, 2025, the share price was 0,88 / share. This represents an increase of 68,98% over that period.
Fondens stemningsscore
Fund Sentiment Score (fka Ownership Accumulation Score) finder de aktier, der bliver mest købt af fonde. Det er resultatet af en sofistikeret, multi-faktor kvantitativ model, der identificerer virksomheder med de højeste niveauer af institutionel akkumulering. Scoringsmodellen bruger en kombination af den samlede stigning i oplyste ejere, ændringerne i porteføljeallokeringer i disse ejere og andre målinger. Tallet går fra 0 til 100, hvor højere tal indikerer et højere niveau af akkumulering for sine jævnaldrende, og 50 er gennemsnittet.
Opdateringsfrekvens: Dagligt
Se Ownership Explorer, som giver en liste over højest rangerende virksomheder.
AI+ Ask Fintel’s AI assistant about Coherus Oncology, Inc..
Select a question to share a public post with an AI-crafted answer.
Thinking of good questions…
13F og NPORT arkivering
Detaljer om 13F-arkivering er gratis. Detaljer om NP-ansøgninger kræver et premium-medlemskab. Grønne rækker angiver nye positioner. Røde rækker angiver lukkede positioner. Klik på linket ikon for at se den fulde transaktionshistorik.
Opgrader
for at låse premium-data op og eksportere til Excel ![]() .
.
| Fil dato | Kilde | Investor | Type | Gennemsnitlig pris (Øst) |
Aktier | Δ Aktier (%) |
Rapporteret Værdi ($1000) |
Δ Værdi (%) |
Port Alloc (%) |
|
|---|---|---|---|---|---|---|---|---|---|---|
| 2026-02-14 | 13F | Rockefeller Capital Management L.P. | 324 | 0,00 | 0 | |||||
| 2026-02-17 | 13F | California State Teachers Retirement System | 6.529 | -18,19 | 9 | -30,77 | ||||
| 2025-11-14 | 13F | Rubric Capital Management LP | 0 | -100,00 | 0 | -100,00 | ||||
| 2026-02-17 | 13F | Aqr Capital Management Llc | 885.720 | -1,92 | 1.258 | -15,07 | ||||
| 2026-02-12 | 13F | Jane Street Group, Llc | Call | 25.900 | -5,47 | 37 | -18,18 | |||
| 2026-02-12 | 13F | Jane Street Group, Llc | 603.510 | 187,41 | 857 | 148,84 | ||||
| 2026-02-13 | 13F | Prudential Financial Inc | 0 | -100,00 | 0 | |||||
| 2026-02-05 | 13F | Allworth Financial LP | 62 | 520,00 | 0 | |||||
| 2026-02-13 | 13F | Squarepoint Ops LLC | 92.756 | 132 | ||||||
| 2026-04-08 | 13F | Wealth Enhancement Advisory Services, Llc | 53.571 | 58,93 | 93 | 104,44 | ||||
| 2026-02-04 | 13F | C WorldWide Group Holding A/S | 1.928.464 | 0,00 | 3 | -33,33 | ||||
| 2026-02-13 | 13F | Mariner, LLC | 10.890 | 15 | ||||||
| 2026-02-17 | 13F | ADAR1 Capital Management, LLC | 10.366 | 0,00 | 15 | -17,65 | ||||
| 2026-02-11 | 13F | Deutsche Bank Ag\ | 71.762 | -39,18 | 102 | -47,67 | ||||
| 2026-02-04 | 13F | Clark Wealth Partners | 0 | -100,00 | 0 | |||||
| 2025-11-14 | 13F | Larson Financial Group LLC | 0 | -100,00 | 0 | |||||
| 2026-01-29 | 13F | China Universal Asset Management Co., Ltd. | 19.696 | 28 | ||||||
| 2026-02-10 | 13F | Bnp Paribas Arbitrage, Sa | 25.196 | -5,35 | 36 | -18,60 | ||||
| 2026-01-09 | 13F | Carr Financial Group Corp | 35.195 | 0,00 | 50 | -14,04 | ||||
| 2026-02-13 | 13F | Victory Capital Management Inc | 11.835 | 17 | ||||||
| 2025-11-14 | 13F | Graham Capital Management, L.P. | 0 | -100,00 | 0 | |||||
| 2025-11-12 | 13F/A | Norges Bank | 0 | -100,00 | 0 | |||||
| 2026-02-17 | 13F | Royal Bank Of Canada | 5.075 | -98,49 | 7 | -98,73 | ||||
| 2026-02-13 | 13F | Quarry LP | 0 | -100,00 | 0 | -100,00 | ||||
| 2026-02-17 | 13F | Alliancebernstein L.p. | 213.590 | 0,00 | 303 | -13,43 | ||||
| 2026-02-17 | 13F | Tower Research Capital LLC (TRC) | 8.099 | 14,78 | 12 | 0,00 | ||||
| 2026-02-10 | 13F/A | Northwestern Mutual Wealth Management Co | 7.350 | 0,00 | 10 | -16,67 | ||||
| 2026-02-17 | 13F | Northern Trust Corp | 793.313 | -6,71 | 1.127 | -19,23 | ||||
| 2026-02-13 | 13F | SRS Capital Advisors, Inc. | 22 | -99,70 | 0 | -100,00 | ||||
| 2026-02-17 | 13F | Bank Of America Corp /de/ | 111.703 | 47,36 | 159 | 27,42 | ||||
| 2026-02-17 | 13F | Delaware Management Holdings, Inc. | 899.999 | 1.278 | ||||||
| 2026-04-23 | 13F | SJS Investment Consulting Inc. | 107 | 21,59 | 0 | |||||
| 2026-04-27 | 13F | Sound Income Strategies, LLC | 200 | 0,00 | 0 | |||||
| 2026-01-29 | 13F | Vanguard Group Inc | 10.028.893 | -2,83 | 14.241 | -15,86 | ||||
| 2026-02-17 | 13F | Bridgeway Capital Management Inc | 441.000 | 72,94 | 626 | 49,76 | ||||
| 2026-02-06 | 13F | Providence Wealth Advisors, LLC | 15.000 | 0,00 | 22 | -19,23 | ||||
| 2025-11-14 | 13F | State Board Of Administration Of Florida Retirement System | 0 | -100,00 | 0 | |||||
| 2026-02-13 | 13F | Macquarie Group Ltd | 0 | -100,00 | 0 | |||||
| 2026-02-11 | 13F | Ameritas Investment Partners, Inc. | 9.819 | 14 | ||||||
| 2026-02-17 | 13F | Riverview Capital Advisers, LLC | 0 | -100,00 | 0 | -100,00 | ||||
| 2026-04-07 | 13F | CoreCap Advisors, LLC | 2.472 | 4 | ||||||
| 2026-04-15 | 13F | Merit Financial Group, LLC | 10.608 | 18 | ||||||
| 2026-02-02 | 13F | CM Management, LLC | 2.100.000 | 0,00 | 2.982 | -13,41 | ||||
| 2026-02-12 | 13F | SWAN Capital LLC | 1.300 | 0,00 | 2 | -50,00 | ||||
| 2026-02-17 | 13F | Citadel Advisors Llc | Put | 21.000 | -82,46 | 30 | -85,20 | |||
| 2026-01-29 | 13F | UBS Group AG | 610.803 | -23,26 | 867 | -33,56 | ||||
| 2026-02-17 | 13F | Captrust Financial Advisors | 13.114 | 21,85 | 19 | 5,88 | ||||
| 2026-02-10 | 13F | Goldman Sachs Group Inc | 307.137 | -19,76 | 436 | -30,46 | ||||
| 2026-04-24 | 13F | Strs Ohio | 324.000 | 0,00 | 548 | 18,91 | ||||
| 2026-02-10 | 13F | Intech Investment Management Llc | 48.061 | 0,00 | 68 | -12,82 | ||||
| 2026-04-21 | 13F | Pallas Capital Advisors LLC | 11.545 | 20 | ||||||
| 2026-02-09 | 13F | Huntington National Bank | 1 | 0,00 | 0 | |||||
| 2026-02-17 | 13F | Susquehanna International Group, Llp | Call | 0 | -100,00 | 0 | ||||
| 2026-02-09 | 13F | Endowment Wealth Management, Inc. | 11.521 | 16 | ||||||
| 2025-11-14 | 13F | Cubist Systematic Strategies, LLC | 10.789 | 18 | ||||||
| 2026-04-16 | 13F | Diversified Trust Co | 38.471 | 36,62 | 65 | 66,67 | ||||
| 2026-04-13 | 13F | IFP Advisors, Inc | 610 | -10,03 | 1 | |||||
| 2026-02-10 | 13F | Rothschild Investment Llc | 59 | 0 | ||||||
| 2026-01-12 | 13F | AllSquare Wealth Management LLC | 16 | 0,00 | 0 | |||||
| 2026-03-23 | 13F/A | Barclays Plc | Call | 0 | -100,00 | 0 | -100,00 | |||
| 2026-02-17 | 13F | EFG International AG | 11.500 | 16 | ||||||
| 2026-02-17 | 13F | Susquehanna International Group, Llp | 382.241 | -5,37 | 543 | -18,13 | ||||
| 2025-11-14 | 13F | Virtu Financial LLC | 0 | -100,00 | 0 | |||||
| 2026-02-17 | 13F | Two Sigma Securities, Llc | 14.587 | -0,81 | 21 | -16,67 | ||||
| 2025-11-14 | 13F | Shay Capital LLC | 0 | -100,00 | 0 | |||||
| 2025-11-14 | 13F | Wolverine Trading, Llc | 30.360 | 71,50 | 52 | 292,31 | ||||
| 2026-04-24 | 13F | ProShare Advisors LLC | 21.700 | -12,21 | 37 | 2,86 | ||||
| 2025-11-14 | 13F | Wolverine Trading, Llc | Call | 39.300 | 16,96 | 67 | 175,00 | |||
| 2026-02-09 | 13F | Legal & General Group Plc | 9.272 | 0,00 | 13 | -13,33 | ||||
| 2026-02-17 | 13F | XTX Topco Ltd | 166.797 | 71,64 | 237 | 48,43 | ||||
| 2026-02-11 | 13F | LPL Financial LLC | 98.541 | -55,03 | 140 | -61,28 | ||||
| 2026-02-12 | 13F | Cibc World Markets Corp | 0 | -100,00 | 0 | |||||
| 2026-02-13 | 13F | Colony Group, LLC | 0 | -100,00 | 0 | -100,00 | ||||
| 2026-02-17 | 13F | Quadrature Capital Ltd | 0 | -100,00 | 0 | -100,00 | ||||
| 2026-01-26 | 13F | Mirae Asset Global Investments Co., Ltd. | 5.874 | 8 | ||||||
| 2026-02-17 | 13F | Citadel Advisors Llc | Call | 132.100 | 68,71 | 188 | 46,09 | |||
| 2026-04-24 | 13F | Root Financial Partners, LLC | 199 | 0 | ||||||
| 2025-11-06 | 13F | CBIZ Investment Advisory Services, LLC | 0 | -100,00 | 0 | |||||
| 2025-11-07 | 13F | Shell Asset Management Co | 0 | -100,00 | 0 | |||||
| 2025-11-21 | 13F/A | CIBC Bancorp USA Inc. | 11.306 | 19 | ||||||
| 2026-01-23 | 13F | Tyche Wealth Partners LLC | 220.868 | 12,76 | 314 | -2,49 | ||||
| 2026-02-17 | 13F | Citadel Advisors Llc | 0 | -100,00 | 0 | -100,00 | ||||
| 2026-02-17 | 13F | Millennium Management Llc | 660.451 | 938 | ||||||
| 2026-02-11 | 13F | LPL Financial LLC | Call | 0 | -100,00 | 0 | -100,00 | |||
| 2026-04-14 | 13F | Wealth Group, Ltd. | 14.195 | 0,00 | 0 | |||||
| 2026-02-10 | 13F | Savant Capital, LLC | 0 | -100,00 | 0 | |||||
| 2026-02-12 | 13F | Renaissance Technologies Llc | 137.900 | 472,20 | 196 | 400,00 | ||||
| 2026-02-05 | 13F | Cambridge Investment Research Advisors, Inc. | 43.679 | -12,68 | 0 | |||||
| 2026-02-17 | 13F | Russell Investments Group, Ltd. | 8.784 | 0,00 | 12 | -14,29 | ||||
| 2026-02-12 | 13F | MetLife Investment Management, LLC | 0 | -100,00 | 0 | |||||
| 2026-02-06 | 13F | EverSource Wealth Advisors, LLC | 2.479 | 28,11 | 4 | 0,00 | ||||
| 2026-02-13 | 13F | Rhumbline Advisers | 131.476 | -15,33 | 187 | -26,77 | ||||
| 2025-11-12 | 13F | Commerce Bank | 0 | -100,00 | 0 | |||||
| 2026-02-11 | 13F | Jpmorgan Chase & Co | 51.156 | -52,46 | 73 | -59,09 | ||||
| 2026-01-23 | 13F | Avion Wealth | 660 | 0,00 | 0 | |||||
| 2026-02-12 | 13F | StoneX Group Inc. | 11.002 | 16 | ||||||
| 2026-02-10 | 13F | Bank of New York Mellon Corp | 290.863 | -22,78 | 413 | -33,06 | ||||
| 2026-02-11 | 13F | Cerity Partners LLC | 16.593 | 20,71 | 24 | 4,55 | ||||
| 2026-02-03 | 13F | International Assets Investment Management, Llc | 44.808 | -1,98 | 64 | 85,29 | ||||
| 2026-02-11 | 13F | Simplex Trading, Llc | Call | 61.300 | -2,23 | 87 | ||||
| 2026-02-11 | 13F | Simplex Trading, Llc | Put | 6.900 | 0,00 | 10 | ||||
| 2026-01-15 | 13F | Nisa Investment Advisors, Llc | 574 | 0,00 | 1 | |||||
| 2026-02-11 | 13F | Simplex Trading, Llc | 48.044 | -18,32 | 68 | |||||
| 2026-03-23 | 13F/A | Barclays Plc | Put | 0 | -100,00 | 0 | -100,00 | |||
| 2026-02-13 | 13F | Panagora Asset Management Inc | 1.620.271 | 17,75 | 2.301 | 1,95 | ||||
| 2026-02-13 | 13F | Wells Fargo & Company/mn | 117.975 | 55,08 | 168 | 34,68 | ||||
| 2026-02-11 | 13F | Group One Trading, L.p. | Call | 173.900 | -15,79 | 247 | -27,22 | |||
| 2026-02-13 | 13F | Ieq Capital, Llc | 79.128 | 24,85 | 112 | 8,74 | ||||
| 2026-01-20 | 13F | Stratos Wealth Partners, LTD. | 16.131 | -0,11 | 23 | -15,38 | ||||
| 2026-02-11 | 13F | Group One Trading, L.p. | Put | 13.100 | 0,77 | 19 | -14,29 | |||
| 2026-02-11 | 13F | Group One Trading, L.p. | 41.225 | -25,33 | 59 | -35,56 | ||||
| 2026-02-12 | 13F | Voya Investment Management Llc | 16.971 | 0,00 | 24 | -11,11 | ||||
| 2026-02-19 | 13F | Invesco Ltd. | 380.033 | 45,61 | 540 | 25,93 | ||||
| 2026-04-06 | 13F | GAMMA Investing LLC | 1.210 | 197,30 | 2 | |||||
| 2026-02-11 | 13F | O'shaughnessy Asset Management, Llc | 37.207 | -41,09 | 53 | -49,51 | ||||
| 2026-02-13 | 13F | Morgan Stanley | 248.394 | 7,83 | 353 | -6,63 | ||||
| 2026-02-17 | 13F | Blair William & Co/il | 19.000 | 27 | ||||||
| 2026-03-06 | 13F | Hsbc Holdings Plc | 94.369 | 2,58 | 135 | -9,40 | ||||
| 2026-02-13 | 13F | Citigroup Inc | 192.856 | -20,99 | 274 | -31,75 | ||||
| 2026-04-16 | 13F | SG Americas Securities, LLC | 32.797 | -4,76 | 0 | |||||
| 2026-02-05 | 13F | Amalgamated Bank | 3.332 | -7,68 | 0 | |||||
| 2026-02-12 | 13F | BlackRock, Inc. | 10.562.709 | 0,98 | 14.999 | -12,56 | ||||
| 2026-02-17 | 13F | Two Sigma Investments, Lp | 503.875 | 1.310,94 | 716 | 1.132,76 | ||||
| 2026-02-13 | 13F | Hudson Bay Capital Management LP | 835.000 | 3,09 | 1.186 | -10,77 | ||||
| 2026-02-17 | 13F | Kohlberg Kravis Roberts & Co. L.P. | 3.036.076 | 0,00 | 4.247 | -13,89 | ||||
| 2026-04-24 | 13F | Medallion Wealth Advisors, LLC | 15.000 | 0,00 | 25 | 19,05 | ||||
| 2026-02-09 | 13F | Geode Capital Management, Llc | 2.745.246 | 0,15 | 3.899 | -13,30 | ||||
| 2026-02-09 | 13F | Hartland & Co., LLC | 269 | -76,71 | 0 | -100,00 | ||||
| 2026-03-09 | 13F/A | CI Private Wealth, LLC | 90.000 | 0,00 | 128 | -13,61 | ||||
| 2026-02-20 | 13F | Sunbelt Securities, Inc. | 16 | 0 | ||||||
| 2026-02-17 | 13F | Fmr Llc | 7.843 | -5,76 | 11 | -15,38 | ||||
| 2026-04-22 | 13F | Sterling Capital Management LLC | 2.595 | -40,39 | 4 | -33,33 | ||||
| 2026-01-26 | 13F | Cwm, Llc | 40.334 | 13,83 | 0 | |||||
| 2026-02-17 | 13F | Price T Rowe Associates Inc /md/ | 59.613 | 0,00 | 0 | |||||
| 2026-02-06 | 13F | Gsa Capital Partners Llp | 477.481 | 1 | ||||||
| 2026-01-23 | 13F | Steigerwald, Gordon & Koch Inc. | 1.000 | 0,00 | 1 | 0,00 | ||||
| 2026-02-09 | 13F | Jefferies Financial Group Inc. | 395.190 | 21,36 | 561 | 5,06 | ||||
| 2026-02-17 | 13F | Sagewood Asset Management LP | 14.732 | 21 | ||||||
| 2025-11-04 | 13F | Tejara Capital Ltd | 0 | -100,00 | 0 | -100,00 | ||||
| 2026-02-13 | 13F | Neuberger Berman Group LLC | 12.951 | -24,30 | 18 | -35,71 | ||||
| 2026-02-10 | 13F | Acadian Asset Management Llc | 51.640 | 0,00 | 0 | |||||
| 2026-02-13 | 13F | Barclays Plc | 345.573 | 17,87 | 491 | 2,08 | ||||
| 2026-02-17 | 13F | MIRAE ASSET GLOBAL ETFS HOLDINGS Ltd. | 49.275 | -0,01 | 70 | -13,75 | ||||
| 2026-02-13 | 13F | Manufacturers Life Insurance Company, The | 0 | -100,00 | 0 | |||||
| 2026-02-13 | 13F | Sei Investments Co | 76.629 | 109 | ||||||
| 2026-02-13 | 13F | Marshall Wace, Llp | 85.464 | 121 | ||||||
| 2026-02-12 | 13F | Federated Hermes, Inc. | 1.940 | 305,01 | 3 | |||||
| 2026-02-17 | 13F | Optiver Holding B.V. | 5.144 | 178,96 | 7 | 133,33 | ||||
| 2026-02-13 | 13F | JustInvest LLC | 34.838 | 1,08 | 49 | -12,50 | ||||
| 2026-02-17 | 13F | Two Sigma Advisers, Lp | 307.600 | 2.360,80 | 437 | 2.080,00 | ||||
| 2026-04-07 | 13F | Farther Finance Advisors, LLC | 2.135 | 6,11 | 4 | 50,00 | ||||
| 2026-04-20 | 13F | Kestra Private Wealth Services, Llc | 0 | -100,00 | 0 | |||||
| 2026-02-12 | 13F | Hrt Financial Lp | 10.527 | 0 | ||||||
| 2026-02-12 | 13F | New York State Common Retirement Fund | 20.593 | 0,00 | 29 | -12,12 | ||||
| 2026-02-12 | 13F | Nuveen, LLC | 210.379 | 57,29 | 299 | 36,07 | ||||
| 2026-02-17 | 13F | Boothbay Fund Management, Llc | 19.288 | 0,00 | 27 | -12,90 | ||||
| 2026-01-20 | 13F | Steel Peak Wealth Management LLC | 69.000 | 0,00 | 98 | -14,16 | ||||
| 2026-02-11 | 13F | Los Angeles Capital Management Llc | 131.360 | 49,37 | 223 | 54,86 | ||||
| 2026-04-15 | 13F | Gf Fund Management Co. Ltd. | 2.714 | 17,95 | 5 | 33,33 | ||||
| 2026-04-27 | 13F | Bronte Capital Management Pty Ltd. | 19.282 | 0,00 | 33 | 18,52 | ||||
| 2026-02-13 | 13F | Police & Firemen's Retirement System of New Jersey | 28.230 | 0,00 | 40 | -13,04 | ||||
| 2025-11-13 | 13F | Stonepine Capital Management, LLC | 0 | -100,00 | 0 | |||||
| 2026-02-17 | 13F | Advisor Group Holdings, Inc. | 1.675 | -9,16 | 2 | 0,00 | ||||
| 2025-11-14 | 13F | Raymond James Financial Inc | 0 | -100,00 | 0 | |||||
| 2026-04-13 | 13F | True Wealth Design, LLC | 340 | 14,86 | 1 | |||||
| 2026-02-12 | 13F | CIBC Private Wealth Group, LLC | 123 | 0,00 | 0 | |||||
| 2026-02-13 | 13F | Charles Schwab Investment Management Inc | 935.239 | -5,83 | 1.328 | -18,43 | ||||
| 2026-02-03 | 13F | SBI Securities Co., Ltd. | 724 | -0,14 | 1 | 0,00 | ||||
| 2026-02-13 | 13F | State Street Corp | 2.223.396 | 0,00 | 3.157 | -13,41 | ||||
| 2026-02-17 | 13F | Tang Capital Management Llc | 2.724.509 | -46,55 | 3.869 | -53,73 |
Other Listings
| US:CHRS | 1,75 $ |