Grundlæggende statistik
| Institutionelle aktier (lange) | 94.555.942 - 37,31% (ex 13D/G) - change of -28,28MM shares -23,02% MRQ |
| Institutionel værdi (lang) | $ 457.431 USD ($1000) |
Institutionelt ejerskab og aktionærer
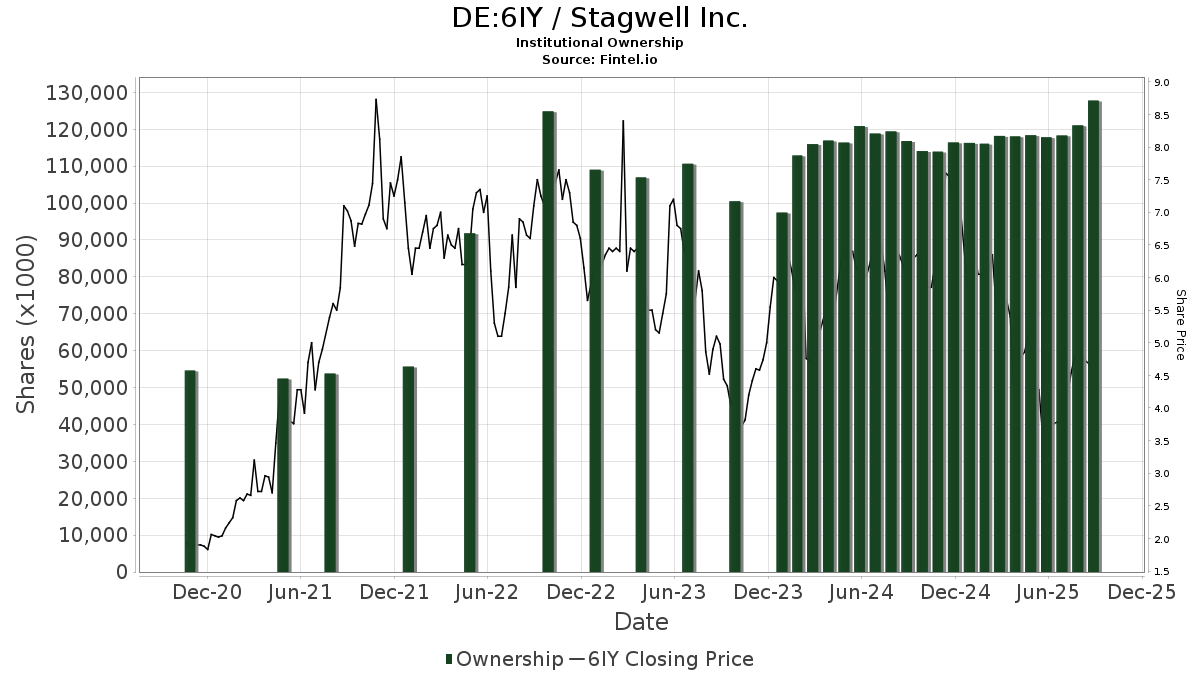
Stagwell Inc. (DE:6IY) har 173 institutionelle ejere og aktionærer, der har indsendt 13D/G- eller 13F-formularer til Securities Exchange Commission (SEC). Disse institutioner har i alt 94,555,942 aktier. Største aktionærer omfatter Hotchkis & Wiley Capital Management Llc, BlackRock, Inc., Madison Avenue Partners, LP, Vanguard Group Inc, Goldman Sachs Group Inc, Dimensional Fund Advisors Lp, Boston Partners, Geode Capital Management, Llc, Jpmorgan Chase & Co, and State Street Corp .
Stagwell Inc. (DB:6IY) institutionel ejerskabsstruktur viser aktuelle positioner i virksomheden efter institutioner og fonde, samt seneste ændringer i positionsstørrelse. Større aktionærer kan omfatte individuelle investorer, investeringsforeninger, hedgefonde eller institutioner. Skema 13D angiver, at investoren besidder (eller besidder) mere end 5 % af virksomheden og har til hensigt (eller har til hensigt at) aktivt at forfølge en ændring i forretningsstrategi. Skema 13G indikerer en passiv investering på over 5%.
The share price as of March 27, 2026 is 5,35 / share. Previously, on April 7, 2025, the share price was 4,58 / share. This represents an increase of 16,81% over that period.
Fondens stemningsscore
Fund Sentiment Score (fka Ownership Accumulation Score) finder de aktier, der bliver mest købt af fonde. Det er resultatet af en sofistikeret, multi-faktor kvantitativ model, der identificerer virksomheder med de højeste niveauer af institutionel akkumulering. Scoringsmodellen bruger en kombination af den samlede stigning i oplyste ejere, ændringerne i porteføljeallokeringer i disse ejere og andre målinger. Tallet går fra 0 til 100, hvor højere tal indikerer et højere niveau af akkumulering for sine jævnaldrende, og 50 er gennemsnittet.
Opdateringsfrekvens: Dagligt
Se Ownership Explorer, som giver en liste over højest rangerende virksomheder.
AI+ Ask Fintel’s AI assistant about Stagwell Inc..
Select a question to share a public post with an AI-crafted answer.
Thinking of good questions…
13F og NPORT arkivering
Detaljer om 13F-arkivering er gratis. Detaljer om NP-ansøgninger kræver et premium-medlemskab. Grønne rækker angiver nye positioner. Røde rækker angiver lukkede positioner. Klik på linket ikon for at se den fulde transaktionshistorik.
Opgrader
for at låse premium-data op og eksportere til Excel ![]() .
.
| Fil dato | Kilde | Investor | Type | Gennemsnitlig pris (Øst) |
Aktier | Δ Aktier (%) |
Rapporteret Værdi ($1000) |
Δ Værdi (%) |
Port Alloc (%) |
|
|---|---|---|---|---|---|---|---|---|---|---|
| 2026-02-13 | 13F | Squarepoint Ops LLC | 0 | -100,00 | 0 | |||||
| 2026-02-19 | 13F | Invesco Ltd. | 210.992 | 20,65 | 1.032 | 4,78 | ||||
| 2025-10-30 | 13F | Strs Ohio | 0 | -100,00 | 0 | |||||
| 2026-02-10 | 13F | Rothschild Investment Llc | 458 | 5.625,00 | 2 | |||||
| 2026-01-12 | 13F | Perennial Advisors, LLC | 28.000 | -6,67 | 137 | -19,05 | ||||
| 2026-02-12 | 13F | Jane Street Group, Llc | 286.095 | -15,47 | 1.399 | -26,56 | ||||
| 2026-02-12 | 13F | Campbell & CO Investment Adviser LLC | 60.836 | -11,60 | 297 | -23,26 | ||||
| 2026-01-27 | 13F | Zurcher Kantonalbank (Zurich Cantonalbank) | 16.214 | 0,00 | 79 | -13,19 | ||||
| 2026-02-13 | 13F | Rhumbline Advisers | 138.099 | -15,47 | 675 | -26,55 | ||||
| 2026-02-12 | 13F | Jane Street Group, Llc | Call | 19.800 | 97 | |||||
| 2026-02-10 | 13F | Bnp Paribas Arbitrage, Sa | 24.236 | 3,95 | 119 | -9,92 | ||||
| 2026-02-13 | 13F | Ubs Asset Management Americas Inc | 194.009 | 7,71 | 949 | -6,51 | ||||
| 2026-02-17 | 13F | Creative Planning | 34.118 | 92,75 | 167 | 67,68 | ||||
| 2025-10-20 | 13F | Ascent Group, LLC | 0 | -100,00 | 0 | |||||
| 2026-02-10 | 13F | CIBC Asset Management Inc | 10.816 | 53 | ||||||
| 2026-01-23 | 13F | State of Alaska, Department of Revenue | 33.060 | 294,46 | 0 | |||||
| 2026-02-09 | 13F | Coldstream Capital Management Inc | 20.928 | -73,20 | 102 | -76,77 | ||||
| 2026-02-13 | 13F | Sterling Capital Management LLC | 789 | 181,79 | 4 | 200,00 | ||||
| 2026-02-11 | 13F | Los Angeles Capital Management Llc | 683 | 3 | ||||||
| 2026-02-13 | 13F | TRUE Private Wealth Advisors | 47.594 | -21,98 | 233 | -32,36 | ||||
| 2026-02-17 | 13F | D. E. Shaw & Co., Inc. | 173.540 | 600,01 | 849 | 510,07 | ||||
| 2026-01-29 | 13F | UBS Group AG | 806.842 | -71,70 | 3.945 | -75,42 | ||||
| 2026-02-13 | 13F | Natixis | 35.800 | 0,00 | 175 | -12,94 | ||||
| 2026-02-11 | 13F | Jpmorgan Chase & Co | 2.676.532 | 54,12 | 13.088 | 33,87 | ||||
| 2026-02-17 | 13F | MIRAE ASSET GLOBAL ETFS HOLDINGS Ltd. | 51.948 | -3,17 | 254 | -15,89 | ||||
| 2026-01-22 | 13F | Glass Jacobson Investment Advisors llc | 1.000 | 42,86 | 5 | 33,33 | ||||
| 2026-02-03 | 13F | SBI Securities Co., Ltd. | 310 | 30.900,00 | 2 | |||||
| 2026-02-17 | 13F | Graham Capital Management, L.P. | 0 | -100,00 | 0 | |||||
| 2026-02-17 | 13F | Gotham Asset Management, LLC | 24.706 | 121 | ||||||
| 2026-01-30 | 13F | Caldwell Securities, Inc | 53.700 | 0,00 | 263 | -13,25 | ||||
| 2026-02-12 | 13F | New York State Common Retirement Fund | 1.319.974 | -7,36 | 6.455 | -19,54 | ||||
| 2026-01-29 | 13F | Concurrent Investment Advisors, LLC | 43.276 | 0,00 | 212 | -13,17 | ||||
| 2026-02-09 | 13F | Legal & General Group Plc | 97.030 | 1,72 | 474 | -11,73 | ||||
| 2026-02-17 | 13F | Susquehanna International Group, Llp | Call | 57.900 | 322,63 | 283 | 267,53 | |||
| 2026-02-17 | 13F | Susquehanna International Group, Llp | 26.721 | -55,36 | 131 | -61,42 | ||||
| 2026-02-06 | 13F | Larson Financial Group LLC | 56 | -57,25 | 0 | |||||
| 2026-02-11 | 13F | Picton Mahoney Asset Management | 144.246 | -14,16 | 705 | |||||
| 2026-02-09 | 13F | Jefferies Financial Group Inc. | 0 | -100,00 | 0 | |||||
| 2026-02-05 | 13F | HFM Investment Advisors, LLC | 2 | 0,00 | 0 | |||||
| 2026-02-13 | 13F | Prudential Financial Inc | 408.888 | 81,02 | 1.999 | 57,28 | ||||
| 2025-11-12 | 13F | Us Bancorp \de\ | 0 | -100,00 | 0 | |||||
| 2026-02-17 | 13F | First Pacific Advisors, LP | 1.191.918 | 0,00 | 5.828 | -13,14 | ||||
| 2026-01-26 | 13F | Cwm, Llc | 21.561 | 804,03 | 0 | |||||
| 2026-03-06 | 13F | Hsbc Holdings Plc | 0 | -100,00 | 0 | |||||
| 2026-02-05 | 13F | Amalgamated Bank | 3.513 | 15,83 | 0 | |||||
| 2025-11-12 | 13F | Portfolio Design Labs, LLC | 0 | -100,00 | 0 | |||||
| 2026-01-28 | 13F | Teacher Retirement System Of Texas | 0 | -100,00 | 0 | |||||
| 2026-02-12 | 13F | Swiss National Bank | 229.600 | 28,92 | 1.123 | 11,98 | ||||
| 2026-02-13 | 13F | First Trust Advisors Lp | 440.153 | 120,01 | 2.152 | 91,12 | ||||
| 2026-01-16 | 13F | Marquette Asset Management, LLC | 105 | 1 | ||||||
| 2025-11-21 | 13F/A | CIBC Bancorp USA Inc. | 12.309 | 69 | ||||||
| 2025-10-31 | 13F | Y-Intercept (Hong Kong) Ltd | 0 | -100,00 | 0 | |||||
| 2026-02-02 | 13F | GenTrust, LLC | 31.809 | 156 | ||||||
| 2026-02-05 | 13F | Allworth Financial LP | 30.428 | 1,10 | 149 | -12,43 | ||||
| 2026-02-17 | 13F | Two Sigma Investments, Lp | 217.608 | -49,61 | 1.064 | -56,23 | ||||
| 2026-02-13 | 13F | Wells Fargo & Company/mn | 179.307 | 45,44 | 877 | 26,22 | ||||
| 2026-02-13 | 13F | Charles Schwab Investment Management Inc | 907.536 | -2,96 | 4.438 | -15,73 | ||||
| 2025-11-14 | 13F | Schonfeld Strategic Advisors LLC | 0 | -100,00 | 0 | |||||
| 2026-02-06 | 13F | Pnc Financial Services Group, Inc. | 1.846 | 9 | ||||||
| 2025-10-24 | 13F | Hemington Wealth Management | 82 | -4,65 | 0 | |||||
| 2026-02-13 | 13F | Stanley Capital Management, LLC | 950.342 | 0,00 | 4.647 | -13,14 | ||||
| 2026-02-06 | 13F | ProShare Advisors LLC | 44.513 | -16,78 | 218 | -27,91 | ||||
| 2026-02-11 | 13F | Franklin Resources Inc | 43.005 | -9,66 | 210 | -21,35 | ||||
| 2026-02-17 | 13F | Balyasny Asset Management Llc | 85.955 | 27,62 | 420 | 10,82 | ||||
| 2025-11-13 | 13F | Mackenzie Financial Corp | 0 | -100,00 | 0 | |||||
| 2026-02-17 | 13F | XTX Topco Ltd | 276.843 | 154,92 | 1.354 | 121,44 | ||||
| 2026-02-10 | 13F | Root Financial Partners, LLC | 7 | 0,00 | 0 | |||||
| 2026-01-21 | 13F | Cidel Asset Management Inc | 2.039.680 | 0,00 | 9.974 | -13,14 | ||||
| 2026-02-13 | 13F | Dynamic Technology Lab Private Ltd | 71.650 | 41,27 | 350 | 22,38 | ||||
| 2026-01-15 | 13F | Nisa Investment Advisors, Llc | 2.573 | 191,39 | 13 | 200,00 | ||||
| 2026-01-30 | 13F | Sigma Planning Corp | 10.346 | -26,10 | 51 | -35,90 | ||||
| 2026-02-04 | 13F | Virginia Retirement Systems Et Al | 53.111 | -59,62 | 260 | -65,00 | ||||
| 2026-01-23 | 13F | DHJJ Financial Advisors, Ltd. | 85 | 0,00 | 0 | |||||
| 2026-02-11 | 13F | Vestcor Inc | 15.522 | 0,00 | 0 | |||||
| 2025-11-10 | 13F | Axq Capital, Lp | 0 | -100,00 | 0 | -100,00 | ||||
| 2026-02-13 | 13F | Mariner, LLC | 23.536 | 115 | ||||||
| 2026-02-17 | 13F | California State Teachers Retirement System | 107.757 | 27,93 | 527 | 10,97 | ||||
| 2026-02-10 | 13F | Intech Investment Management Llc | 51.879 | -19,93 | 254 | -30,49 | ||||
| 2026-02-17 | 13F | Mercer Global Advisors Inc /adv | 24.601 | 120 | ||||||
| 2026-02-09 | 13F | Geode Capital Management, Llc | 2.853.568 | -1,99 | 13.957 | -14,87 | ||||
| 2026-02-05 | 13F | Stoneridge Investment Partners Llc | 42.824 | 0 | ||||||
| 2025-11-05 | 13F | Optimize Financial Inc | 0 | -100,00 | 0 | -100,00 | ||||
| 2026-01-09 | 13F | SG Americas Securities, LLC | 65.151 | 108,55 | 0 | |||||
| 2026-02-10 | 13F | Corrado Advisors, Llc | 315.713 | 0,00 | 1.544 | -13,17 | ||||
| 2026-02-17 | 13F | Tower Research Capital LLC (TRC) | 21.141 | -16,25 | 103 | -27,46 | ||||
| 2025-10-17 | 13F | Fortitude Family Office, LLC | 0 | -100,00 | 0 | |||||
| 2026-02-13 | 13F | Boston Partners | 3.062.076 | -6,53 | 15.349 | -16,49 | ||||
| 2026-02-17 | 13F | Sherbrooke Park Advisers Llc | 12.588 | -40,83 | 62 | -48,74 | ||||
| 2026-02-17 | 13F | Hotchkis & Wiley Capital Management Llc | 22.075.107 | 4,95 | 107.947 | -8,85 | ||||
| 2026-02-13 | 13F | SRS Capital Advisors, Inc. | 335 | -7,71 | 2 | -50,00 | ||||
| 2026-02-12 | 13F | Wealthspire Advisors, LLC | 0 | -100,00 | 0 | |||||
| 2026-02-17 | 13F | Aqr Capital Management Llc | 946.033 | 255,44 | 4.626 | 208,81 | ||||
| 2026-02-23 | 13F | Virtu Financial LLC | 0 | -100,00 | 0 | |||||
| 2026-02-06 | 13F | EverSource Wealth Advisors, LLC | 1.113 | 450,99 | 5 | 400,00 | ||||
| 2026-02-17 | 13F | Optiver Holding B.V. | 1.054 | 28,54 | 5 | 25,00 | ||||
| 2026-02-13 | 13F | Ieq Capital, Llc | 17.660 | 86 | ||||||
| 2026-02-10 | 13F | Clear Harbor Asset Management, LLC | 0 | -100,00 | 0 | |||||
| 2026-02-17 | 13F | Russell Investments Group, Ltd. | 897.349 | 17,45 | 4.388 | 2,02 | ||||
| 2026-02-13 | 13F | Caitong International Asset Management Co., Ltd | 331 | 2 | ||||||
| 2026-02-02 | 13F | Oppenheimer Asset Management Inc. | 16.599 | -6,07 | 81 | -18,18 | ||||
| 2026-02-13 | 13F | Barclays Plc | 174.181 | 29,58 | 852 | -9,76 | ||||
| 2025-11-12 | 13F | Group One Trading, L.p. | 0 | -100,00 | 0 | |||||
| 2026-02-11 | 13F | Winton Capital Group Ltd | 72.568 | 320,12 | 355 | 264,95 | ||||
| 2026-02-17 | 13F | Aristeia Capital Llc | 0 | -100,00 | 0 | |||||
| 2026-02-12 | 13F | Counterpoint Mutual Funds LLC | 59.238 | 358 | ||||||
| 2026-01-21 | 13F | Ccg Wealth Management, Llc | 49.835 | 0,00 | 244 | -13,21 | ||||
| 2026-02-17 | 13F | Citadel Advisors Llc | Call | 0 | -100,00 | 0 | ||||
| 2026-02-10 | 13F | Bruce G. Allen Investments, LLC | 99 | -1,98 | 0 | |||||
| 2026-01-20 | 13F | Harbor Capital Advisors, Inc. | 664.479 | 5,99 | 3 | 0,00 | ||||
| 2026-02-17 | 13F | Citadel Advisors Llc | 0 | -100,00 | 0 | |||||
| 2026-02-17 | 13F | Aster Capital Management (DIFC) Ltd | 2.528 | 883,66 | 12 | 1.100,00 | ||||
| 2026-01-27 | 13F | Institute for Wealth Management, LLC. | 0 | -100,00 | 0 | |||||
| 2026-01-14 | 13F | Jfs Wealth Advisors, Llc | 26 | 0,00 | 0 | |||||
| 2026-02-11 | 13F | Deutsche Bank Ag\ | 98.542 | 24,87 | 482 | 8,33 | ||||
| 2026-02-17 | 13F | Fmr Llc | 7.500 | -67,12 | 37 | -71,87 | ||||
| 2026-02-10 | 13F | Envestnet Asset Management Inc | 14.326 | -12,48 | 70 | -23,91 | ||||
| 2026-02-17 | 13F | Bank Of America Corp /de/ | 367.411 | 0,45 | 1.797 | -12,77 | ||||
| 2026-02-17 | 13F | Price T Rowe Associates Inc /md/ | 109.835 | 6,84 | 1 | |||||
| 2026-02-17 | 13F | Evolve Private Wealth, Llc | 65.329 | 319 | ||||||
| 2026-01-16 | 13F | DiNuzzo Private Wealth, Inc. | 4 | 0,00 | 0 | |||||
| 2026-01-23 | 13F | Farther Finance Advisors, LLC | 452 | 2 | ||||||
| 2025-11-14 | 13F | Wolverine Trading, Llc | Call | 201.400 | 0,70 | 1.102 | 23,15 | |||
| 2026-02-06 | 13F | HighTower Advisors, LLC | 1.590.843 | -0,10 | 7.779 | -13,23 | ||||
| 2026-02-18 | 13F | State of Tennessee, Treasury Department | 29.809 | 179 | ||||||
| 2026-02-06 | 13F | IFP Advisors, Inc | 555 | 3.164,71 | 3 | 100,00 | ||||
| 2025-11-14 | 13F | Qube Research & Technologies Ltd | 0 | -100,00 | 0 | -100,00 | ||||
| 2026-02-17 | 13F | Millennium Management Llc | 24.846 | 121 | ||||||
| 2026-02-13 | 13F | Manufacturers Life Insurance Company, The | 0 | -100,00 | 0 | |||||
| 2026-02-13 | 13F | National Bank Of Canada /fi/ | 793.190 | 89,96 | 3.873 | 64,77 | ||||
| 2026-01-28 | 13F | Arizona State Retirement System | 32.401 | 16,98 | 158 | 1,94 | ||||
| 2026-02-11 | 13F | Ameritas Investment Partners, Inc. | 9.647 | 47 | ||||||
| 2025-11-14 | 13F | Corton Capital Inc. | 0 | -100,00 | 0 | |||||
| 2026-02-13 | 13F | Kestra Advisory Services, LLC | 5.350 | 26 | ||||||
| 2026-02-12 | 13F | Cibc World Markets Corp | 0 | -100,00 | 0 | |||||
| 2026-02-05 | 13F | ARS Investment Partners, LLC | 14.597 | 0,00 | 71 | -13,41 | ||||
| 2026-02-13 | 13F | Huber Capital Management LLC | 0 | -100,00 | 0 | |||||
| 2025-11-14 | 13F | ExodusPoint Capital Management, LP | 242.831 | 1.035,41 | 1.367 | |||||
| 2026-02-13 | 13F | Verition Fund Management LLC | 71.374 | 9,13 | 349 | -5,16 | ||||
| 2026-01-23 | 13F | ABLE Financial Group, LLC | 2.218.703 | -0,13 | 10.849 | -13,26 | ||||
| 2026-02-12 | 13F | State Board Of Administration Of Florida Retirement System | 30.890 | 0,00 | 151 | -12,72 | ||||
| 2025-11-17 | 13F | Jacobs Levy Equity Management, Inc | 0 | -100,00 | 0 | |||||
| 2026-02-12 | 13F | Bank Of Montreal /can/ | 88.256 | 0,00 | 432 | -13,10 | ||||
| 2026-01-16 | 13F | Ronald Blue Trust, Inc. | 68 | 0 | ||||||
| 2026-02-17 | 13F | 683 Capital Management, LLC | 830.000 | -6,74 | 4.059 | -19,00 | ||||
| 2026-02-10 | 13F | Bank of New York Mellon Corp | 515.660 | 28,07 | 2.522 | 11,25 | ||||
| 2026-01-30 | 13F | New York State Teachers Retirement System | 10.548 | 0 | ||||||
| 2026-02-13 | 13F | Morgan Stanley | 272.003 | -31,71 | 1.330 | -40,68 | ||||
| 2026-02-11 | 13F | Janney Montgomery Scott LLC | 77.077 | 0 | ||||||
| 2026-02-13 | 13F | Victory Capital Management Inc | 115.818 | -5,22 | 566 | -17,61 | ||||
| 2026-01-29 | 13F | Comerica Bank | 3.007 | -1,15 | 15 | -17,65 | ||||
| 2026-01-21 | 13F | SJS Investment Consulting Inc. | 45 | 1.025,00 | 0 | |||||
| 2025-10-30 | 13F | Twin Peaks Wealth Advisors, LLC | 0 | -100,00 | 0 | |||||
| 2026-02-17 | 13F | Janus Henderson Group Plc | 36.001 | 0,00 | 176 | -12,87 | ||||
| 2026-02-17 | 13F | Captrust Financial Advisors | 33.925 | 166 | ||||||
| 2026-02-10 | 13F | Goldman Sachs Group Inc | 4.378.664 | -42,08 | 21.412 | -49,70 | ||||
| 2026-02-11 | 13F | Cerity Partners LLC | 310.182 | 108,34 | 1.517 | 80,91 | ||||
| 2026-02-13 | 13F | BNP Paribas Asset Management Holding S.A. | 299.555 | 30.280,83 | 1 | |||||
| 2026-02-09 | 13F | Penn Capital Management Co Inc | 2.165.045 | -8,43 | 10.614 | -20,45 | ||||
| 2026-02-17 | 13F | Ameriprise Financial Inc | 204.374 | 7,85 | 999 | -6,29 | ||||
| 2026-02-17 | 13F | Two Sigma Securities, Llc | 21.822 | -63,07 | 107 | -68,07 | ||||
| 2026-02-17 | 13F | CastleKnight Management LP | 199.400 | -64,46 | 975 | -69,13 | ||||
| 2025-11-05 | 13F | Smartleaf Asset Management LLC | 0 | -100,00 | 0 | |||||
| 2026-01-08 | 13F | Versant Capital Management, Inc | 860 | 13,16 | 4 | 0,00 | ||||
| 2026-02-12 | 13F | Voya Investment Management Llc | 21.001 | -2,86 | 103 | -15,70 | ||||
| 2026-01-08 | 13F | Wealth Enhancement Advisory Services, Llc | 12.240 | 61 | ||||||
| 2026-02-11 | 13F | Simplex Trading, Llc | 100 | -66,67 | 0 | |||||
| 2026-02-17 | 13F | Madison Avenue Partners, LP | 8.014.322 | 0,00 | 39.190 | -13,14 | ||||
| 2026-02-13 | 13F | MAI Capital Management | 122 | 84,85 | 1 | |||||
| 2026-02-09 | 13F | Hartland & Co., LLC | 7.020 | 186,18 | 34 | 161,54 | ||||
| 2026-02-17 | 13F | Two Sigma Advisers, Lp | 0 | -100,00 | 0 | |||||
| 2026-02-18 | 13F | GWM Advisors LLC | 100 | 0 | ||||||
| 2026-02-12 | 13F | Renaissance Technologies Llc | 0 | -100,00 | 0 | |||||
| 2026-02-12 | 13F | MetLife Investment Management, LLC | 55.544 | -17,32 | 272 | -28,31 | ||||
| 2026-02-13 | 13F | State Street Corp | 2.299.100 | 3,32 | 11.243 | -10,27 | ||||
| 2026-02-03 | 13F | Diversify Wealth Management, Llc | 1.750.000 | 0,00 | 9.555 | 14,95 | ||||
| 2026-02-13 | 13F | OMERS ADMINISTRATION Corp | 0 | -100,00 | 0 | |||||
| 2026-02-13 | 13F | Parkside Financial Bank & Trust | 9.606 | -0,36 | 47 | -14,81 | ||||
| 2026-04-06 | 13F | GAMMA Investing LLC | 102 | -61,80 | 1 | -100,00 | ||||
| 2026-02-17 | 13F | State Of Wisconsin Investment Board | 29.926 | -36,38 | 146 | -44,70 | ||||
| 2026-02-17 | 13F | Bayesian Capital Management, LP | 0 | -100,00 | 0 | |||||
| 2026-02-13 | 13F | Sei Investments Co | 182.037 | 169,67 | 890 | 134,21 | ||||
| 2026-01-29 | 13F | Vanguard Group Inc | 5.668.485 | -12,80 | 27.719 | -24,26 | ||||
| 2026-02-17 | 13F | Quantinno Capital Management LP | 100.105 | 348,94 | 490 | 291,20 | ||||
| 2026-02-10 | 13F | AdvisorShares Investments LLC | 97.700 | 478 | ||||||
| 2026-01-29 | 13F | Pictet Asset Management Holding SA | 14.859 | 0,00 | 73 | -13,25 | ||||
| 2026-01-15 | 13F | My Personal CFO, LLC | 590.882 | 2.889 | ||||||
| 2026-02-17 | 13F | Advisory Services Network, LLC | 0 | -100,00 | 0 | |||||
| 2026-02-06 | 13F | Covestor Ltd | 149 | -28,02 | 0 | |||||
| 2026-01-12 | 13F | Rialto Wealth Management, LLC | 1.000 | 5 | ||||||
| 2026-02-13 | 13F | American Century Companies Inc | 243.775 | 2,07 | 1.192 | -11,31 | ||||
| 2026-02-12 | 13F | Dimensional Fund Advisors Lp | 4.111.549 | 26,82 | 20.107 | 10,19 | ||||
| 2026-02-12 | 13F | Hohimer Wealth Management, Llc | 0 | -100,00 | 0 | |||||
| 2026-02-13 | 13F | Citigroup Inc | 12.621 | 17,06 | 62 | 1,67 | ||||
| 2026-02-17 | 13F | Jones Financial Companies Lllp | 51 | 0,00 | 0 | |||||
| 2026-02-13 | 13F | Police & Firemen's Retirement System of New Jersey | 26.872 | -21,41 | 131 | -31,77 | ||||
| 2026-02-17 | 13F | Royal Bank Of Canada | 156.317 | -42,83 | 764 | -50,39 | ||||
| 2026-02-13 | 13F | Marshall Wace, Llp | 253.313 | 1.239 | ||||||
| 2025-11-10 | 13F | Tableaux Llc | 0 | -100,00 | 0 | -100,00 | ||||
| 2026-02-11 | 13F | Inceptionr Llc | 10.224 | 50 | ||||||
| 2026-02-04 | 13F | Pacific Ridge Capital Partners, LLC | 262.584 | 4,66 | 1.284 | -9,07 | ||||
| 2026-02-11 | 13F | Fox Run Management, L.l.c. | 11.279 | -39,68 | 55 | -47,62 | ||||
| 2026-02-17 | 13F | Northern Trust Corp | 1.140.270 | -2,42 | 5.576 | -15,25 | ||||
| 2026-02-10 | 13F | MGO Private Wealth, LLC | 31.698 | 0,00 | 155 | -12,92 | ||||
| 2026-01-28 | 13F | Klp Kapitalforvaltning As | 25.400 | -23,72 | 124 | -33,69 | ||||
| 2026-02-17 | 13F | Clear Street Markets Llc | 1.972 | 10 | ||||||
| 2026-02-17 | 13F | Advisor Group Holdings, Inc. | 195.288 | 2,62 | 955 | -11,09 | ||||
| 2026-02-12 | 13F | BlackRock, Inc. | 8.019.806 | 1,92 | 39.217 | -11,47 | ||||
| 2026-02-17 | 13F | Man Group plc | 56.407 | 93,42 | 276 | 67,68 | ||||
| 2026-02-17 | 13F | VARCOV Co. | 95.619 | 468 | ||||||
| 2026-02-14 | 13F | Rockefeller Capital Management L.P. | 1.030 | 5 | ||||||
| 2026-02-17 | 13F | Alliancebernstein L.p. | 123.780 | 0,00 | 605 | -13,07 | ||||
| 2026-01-14 | 13F | Net Worth Advisory Group | 49.950 | -2,81 | 244 | -15,57 | ||||
| 2026-02-12 | 13F | Nuveen, LLC | 188.718 | -5,80 | 923 | -18,19 |
Other Listings
| US:STGW | 6,28 $ |