Grundlæggende statistik
| Institutionelle aktier (lange) | 22.488.959 - 80,81% (ex 13D/G) - change of 20,34MM shares 945,93% MRQ |
| Institutionel værdi (lang) | $ 3.357.041 USD ($1000) |
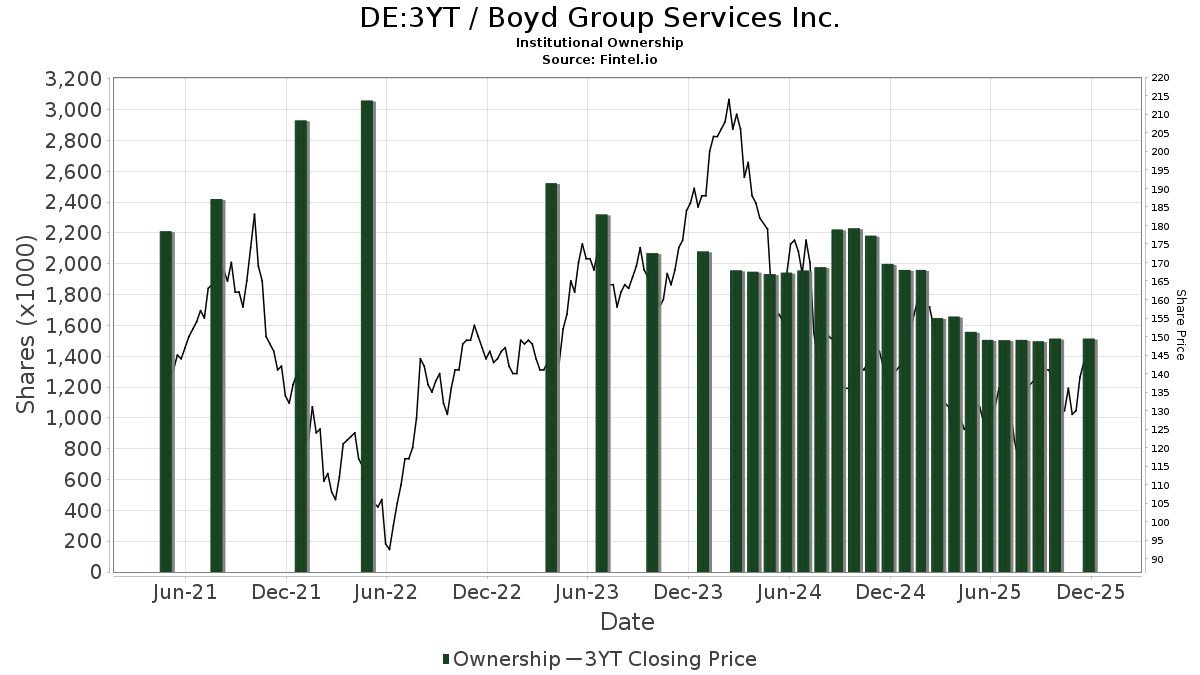
Institutionelt ejerskab og aktionærer
Boyd Group Services Inc. (DE:3YT) har 103 institutionelle ejere og aktionærer, der har indsendt 13D/G- eller 13F-formularer til Securities Exchange Commission (SEC). Disse institutioner har i alt 22,488,959 aktier. Største aktionærer omfatter FIL Ltd, 1832 Asset Management L.P., Mackenzie Financial Corp, Beutel, Goodman & Co Ltd., Bank Of Montreal /can/, Royal Bank Of Canada, Vanguard Group Inc, CIBC Asset Management Inc, Dixon Mitchell Investment Counsel Inc., and Fmr Llc .
Boyd Group Services Inc. (DB:3YT) institutionel ejerskabsstruktur viser aktuelle positioner i virksomheden efter institutioner og fonde, samt seneste ændringer i positionsstørrelse. Større aktionærer kan omfatte individuelle investorer, investeringsforeninger, hedgefonde eller institutioner. Skema 13D angiver, at investoren besidder (eller besidder) mere end 5 % af virksomheden og har til hensigt (eller har til hensigt at) aktivt at forfølge en ændring i forretningsstrategi. Skema 13G indikerer en passiv investering på over 5%.
The share price as of April 24, 2026 is 99,00 / share. Previously, on April 28, 2025, the share price was 126,00 / share. This represents a decline of 21,43% over that period.
Fondens stemningsscore
Fund Sentiment Score (fka Ownership Accumulation Score) finder de aktier, der bliver mest købt af fonde. Det er resultatet af en sofistikeret, multi-faktor kvantitativ model, der identificerer virksomheder med de højeste niveauer af institutionel akkumulering. Scoringsmodellen bruger en kombination af den samlede stigning i oplyste ejere, ændringerne i porteføljeallokeringer i disse ejere og andre målinger. Tallet går fra 0 til 100, hvor højere tal indikerer et højere niveau af akkumulering for sine jævnaldrende, og 50 er gennemsnittet.
Opdateringsfrekvens: Dagligt
Se Ownership Explorer, som giver en liste over højest rangerende virksomheder.
AI+ Ask Fintel’s AI assistant about Boyd Group Services Inc..
Select a question to share a public post with an AI-crafted answer.
Thinking of good questions…
13F og NPORT arkivering
Detaljer om 13F-arkivering er gratis. Detaljer om NP-ansøgninger kræver et premium-medlemskab. Grønne rækker angiver nye positioner. Røde rækker angiver lukkede positioner. Klik på linket ikon for at se den fulde transaktionshistorik.
Opgrader
for at låse premium-data op og eksportere til Excel ![]() .
.
| Fil dato | Kilde | Investor | Type | Gennemsnitlig pris (Øst) |
Aktier | Δ Aktier (%) |
Rapporteret Værdi ($1000) |
Δ Værdi (%) |
Port Alloc (%) |
|
|---|---|---|---|---|---|---|---|---|---|---|
| 2026-02-17 | 13F | Advisor Group Holdings, Inc. | 150 | 24 | ||||||
| 2026-02-10 | 13F | Goldman Sachs Group Inc | 21.600 | 3.441 | ||||||
| 2026-02-13 | 13F | Alberta Investment Management Corp | 35.646 | 5.678 | ||||||
| 2026-01-27 | 13F | TD Waterhouse Canada Inc. | 17.946 | 2.845 | ||||||
| 2026-02-13 | 13F | Manufacturers Life Insurance Company, The | 272.967 | 43.571 | ||||||
| 2026-02-10 | 13F | Hillsdale Investment Management Inc. | 20 | 3 | ||||||
| 2026-01-22 | 13F | Massachusetts Financial Services Co /ma/ | 183.400 | 29.216 | ||||||
| 2026-02-13 | 13F | 1832 Asset Management L.P. | 2.369.395 | 377.445 | ||||||
| 2026-02-09 | 13F | Geode Capital Management, Llc | 18.488 | 3.010 | ||||||
| 2026-02-17 | 13F | BCV Asset Management Inc. | 276.946 | 68.084 | ||||||
| 2026-01-27 | 13F | Zurcher Kantonalbank (Zurich Cantonalbank) | 7.951 | 1.268 | ||||||
| 2026-02-13 | 13F | Barclays Plc | 16 | 3 | ||||||
| 2026-02-17 | 13F | Millennium Management Llc | 105.740 | 16.844 | ||||||
| 2026-02-17 | 13F | Fmr Llc | 617.770 | 98.403 | ||||||
| 2026-02-11 | 13F | Capital World Investors | 441.480 | 70.325 | ||||||
| 2026-02-13 | 13F | Morgan Stanley | 38.612 | 6.151 | ||||||
| 2026-02-12 | 13F | Pembroke Management, LTD | 119.498 | 26.126 | ||||||
| 2026-02-17 | 13F | Alliancebernstein L.p. | 3.760 | 599 | ||||||
| 2026-04-17 | 13F | Cidel Asset Management Inc | 152.909 | 169,60 | 19.458 | 115,10 | ||||
| 2026-02-13 | 13F | Aviso Financial Inc. | 49.488 | 7.883 | ||||||
| 2026-01-21 | 13F | Newbridge Financial Services Group, Inc. | 44 | 7 | ||||||
| 2026-02-17 | 13F | Lansing Management LP | 80.760 | 12.869 | ||||||
| 2026-01-30 | 13F | Lincluden Management Ltd | 31.892 | 7 | ||||||
| 2026-02-13 | 13F | Great West Life Assurance Co /can/ | 5.425 | 1 | ||||||
| 2026-02-02 | 13F | Intact Investment Management Inc. | 161.780 | 25.769 | ||||||
| 2026-02-10 | 13F | Seven Grand Managers, Llc | 20.000 | 3.186 | ||||||
| 2026-01-23 | 13F | Assetmark, Inc | 370 | 59 | ||||||
| 2026-02-11 | 13F | Jpmorgan Chase & Co | 27.778 | 4.395 | ||||||
| 2026-02-17 | 13F | D. E. Shaw & Co., Inc. | 4.400 | 701 | ||||||
| 2026-02-09 | 13F | William Blair Investment Management, Llc | 141.948 | 22.611 | ||||||
| 2026-02-18 | 13F | Pillsbury Lake Capital LLC | 79.949 | 12.736 | ||||||
| 2026-02-13 | 13F | Quarry LP | 31 | 5 | ||||||
| 2026-02-17 | 13F | FIL Ltd | 2.581.931 | 411.269 | ||||||
| 2026-02-11 | 13F | Deutsche Bank Ag\ | 2.340 | 373 | ||||||
| 2026-02-17 | 13F/A | Northwest & Ethical Investments L.P. | 29.766 | 4.751 | ||||||
| 2026-01-29 | 13F | Vanguard Group Inc | 1.175.631 | 187.263 | ||||||
| 2026-02-11 | 13F | Clearbridge Investments, LLC | 314.739 | 68.811 | ||||||
| 2026-02-12 | 13F | Loomis Sayles & Co L P | 116.399 | 18.542 | ||||||
| 2026-02-09 | 13F | Legal & General Group Plc | 24.023 | 3.832 | ||||||
| 2026-02-12 | 13F | Bank Of Nova Scotia Trust Co | 12.389 | 1.974 | ||||||
| 2026-02-12 | 13F | Scotia Capital Inc. | 3.478 | 551 | ||||||
| 2026-02-03 | 13F | K.J. Harrison & Partners Inc | 11.800 | 1.882 | ||||||
| 2026-02-13 | 13F | NewGen Asset Management Ltd | 27.300 | 4.350 | ||||||
| 2026-02-11 | 13F | Franklin Resources Inc | 9.484 | 1.511 | ||||||
| 2026-02-13 | 13F | National Bank Of Canada /fi/ | 82.121 | 13.007 | ||||||
| 2026-02-17 | 13F | Boothbay Fund Management, Llc | 10.159 | 1.618 | ||||||
| 2026-02-10 | 13F | Td Asset Management Inc | 159.767 | 25.482 | ||||||
| 2026-02-17 | 13F | Prelude Capital Management, Llc | 22.570 | 3.595 | ||||||
| 2026-02-19 | 13F | Invesco Ltd. | 1.997 | 318 | ||||||
| 2026-02-06 | 13F | Advisory Alpha, LLC | 17.262 | 2.750 | ||||||
| 2026-02-10 | 13F | Norges Bank | 354.710 | 56.502 | ||||||
| 2026-02-13 | 13F | Beutel, Goodman & Co Ltd. | 1.571.469 | 251 | ||||||
| 2026-02-13 | 13F | American Century Companies Inc | 178.938 | 28.503 | ||||||
| 2026-04-22 | 13F | Canoe Financial LP | 250.130 | -7,74 | 31.921 | -26,08 | ||||
| 2026-02-13 | 13F | Charles Schwab Investment Management Inc | 73.353 | 11.700 | ||||||
| 2026-02-12 | 13F | Federation des caisses Desjardins du Quebec | 82.196 | 13.043 | ||||||
| 2026-02-17 | 13F | Raymond James Financial Inc | 2.296 | 366 | ||||||
| 2026-02-09 | 13F | Waratah Capital Advisors Ltd. | 291.886 | 46.497 | ||||||
| 2026-04-15 | 13F | Addenda Capital Inc. | 66.417 | -2,42 | 11.805 | -20,73 | ||||
| 2026-02-17 | 13F | Polar Asset Management Partners Inc. | 29.000 | 4.621 | ||||||
| 2026-02-10 | 13F | Connor, Clark & Lunn Investment Management Ltd. | 8.785 | 1.399 | ||||||
| 2026-02-17 | 13F | Citadel Advisors Llc | 104.360 | 16.625 | ||||||
| 2026-02-17 | 13F | AYAL Capital Advisors Ltd | 58.098 | 9.255 | ||||||
| 2026-02-17 | 13F | Russell Investments Group, Ltd. | 17.167 | 2.738 | ||||||
| 2026-02-17 | 13F | Caisse De Depot Et Placement Du Quebec | 412.943 | 65.863 | ||||||
| 2026-02-17 | 13F | Ophir Asset Management Pty Ltd | 158.549 | 25.257 | ||||||
| 2026-02-13 | 13F | BRITISH COLUMBIA INVESTMENT MANAGEMENT Corp | 312.450 | 49.770 | ||||||
| 2026-02-02 | 13F | Van Berkom & Associates Inc. | 31.411 | 5 | ||||||
| 2026-02-12 | 13F | Bank Of Montreal /can/ | 1.315.435 | 209.537 | ||||||
| 2026-02-12 | 13F | Swiss National Bank | 53.500 | 8.539 | ||||||
| 2026-02-13 | 13F | Dixon Mitchell Investment Counsel Inc. | 620.108 | 98.976 | ||||||
| 2026-02-06 | 13F | Cumberland Partners Ltd | 13.100 | 2.089 | ||||||
| 2026-02-13 | 13F | Public Sector Pension Investment Board | 1.644 | 262 | ||||||
| 2026-02-18 | 13F | Guardian Capital Lp | 448.067 | 71.405 | ||||||
| 2026-04-20 | 13F | Cardinal Point Capital Management, ULC | 20.095 | 8,04 | 2.560 | -13,69 | ||||
| 2026-02-13 | 13F | Healthcare Of Ontario Pension Plan Trust Fund | 200.000 | 31.860 | ||||||
| 2026-02-17 | 13F | PenderFund Capital Management Ltd. | 12.500 | 1.991 | ||||||
| 2026-02-17 | 13F | Toronto Dominion Bank | 29.067 | 4.631 | ||||||
| 2026-02-17 | 13F | Susquehanna Portfolio Strategies, LLC | 1.800 | 287 | ||||||
| 2026-02-11 | 13F | CLARET ASSET MANAGEMENT Corp | 17.936 | 3 | ||||||
| 2026-02-17 | 13F | Royal Bank Of Canada | 1.282.335 | 204.276 | ||||||
| 2026-02-11 | 13F | Picton Mahoney Asset Management | 509.542 | 81.278 | ||||||
| 2026-02-11 | 13F | Global Alpha Capital Management Ltd. | 319.783 | 50.938 | ||||||
| 2026-02-18 | 13F | Mackenzie Financial Corp | 2.050.220 | 327.955 | ||||||
| 2026-02-10 | 13F | CIBC Asset Management Inc | 793.752 | 126.509 | ||||||
| 2026-02-12 | 13F | Skandinaviska Enskilda Banken AB (publ) | 16.846 | 3.683 | ||||||
| 2026-02-02 | 13F | Principal Financial Group Inc | 390.570 | 62.264 | ||||||
| 2026-02-11 | 13F | CenterBook Partners LP | 21.150 | 3.369 | ||||||
| 2026-02-17 | 13F | Two Sigma Investments, Lp | 23.296 | 3.711 | ||||||
| 2026-02-10 | 13F | CIBC World Markets Inc. | 40.595 | 6.467 | ||||||
| 2026-02-10 | 13F | PCJ Investment Counsel Ltd. | 115.230 | 18.355 | ||||||
| 2026-02-17 | 13F | Public Employees Retirement System Of Ohio | 7.508 | 1.197 | ||||||
| 2026-02-13 | 13F | Langdon Equity Partners | 12.000 | 2.091 | ||||||
| 2026-04-21 | 13F | Value Partners Investments Inc. | 9.905 | 7,44 | 1.262 | -14,22 | ||||
| 2026-02-17 | 13F | Janus Henderson Group Plc | 112.968 | 18.014 | ||||||
| 2026-02-12 | 13F | Nuveen, LLC | 19.539 | 3.116 | ||||||
| 2026-02-18 | 13F | State of Tennessee, Treasury Department | 28.439 | 4.687 | ||||||
| 2026-02-13 | 13F | Timelo Investment Management Inc. | 1.800 | 287 | ||||||
| 2026-01-29 | 13F | UBS Group AG | 13.002 | 2.071 | ||||||
| 2026-04-22 | 13F | Pictet Asset Management Holding SA | 5.425 | 11,76 | 690 | -10,85 | ||||
| 2026-04-17 | 13F | Bell Investment Advisors, Inc | 7 | 1 | ||||||
| 2026-02-17 | 13F | Bank Of America Corp /de/ | 35.088 | 5.590 | ||||||
| 2026-04-22 | 13F | Louisbourg Investments Inc. | 51.234 | 10,29 | 6.417 | -11,76 |