Grundlæggende statistik
| Institutionelle ejere | 106 total, 101 long only, 0 short only, 5 long/short - change of -28,86% MRQ |
| Del pris | 3,66 |
| Gennemsnitlig porteføljeallokering | 0.0967 % - change of -47,18% MRQ |
| Institutionelle aktier (lange) | 18.970.006 (ex 13D/G) - change of -15,58MM shares -45,10% MRQ |
| Institutionel værdi (lang) | $ 102.467 USD ($1000) |
Institutionelt ejerskab og aktionærer
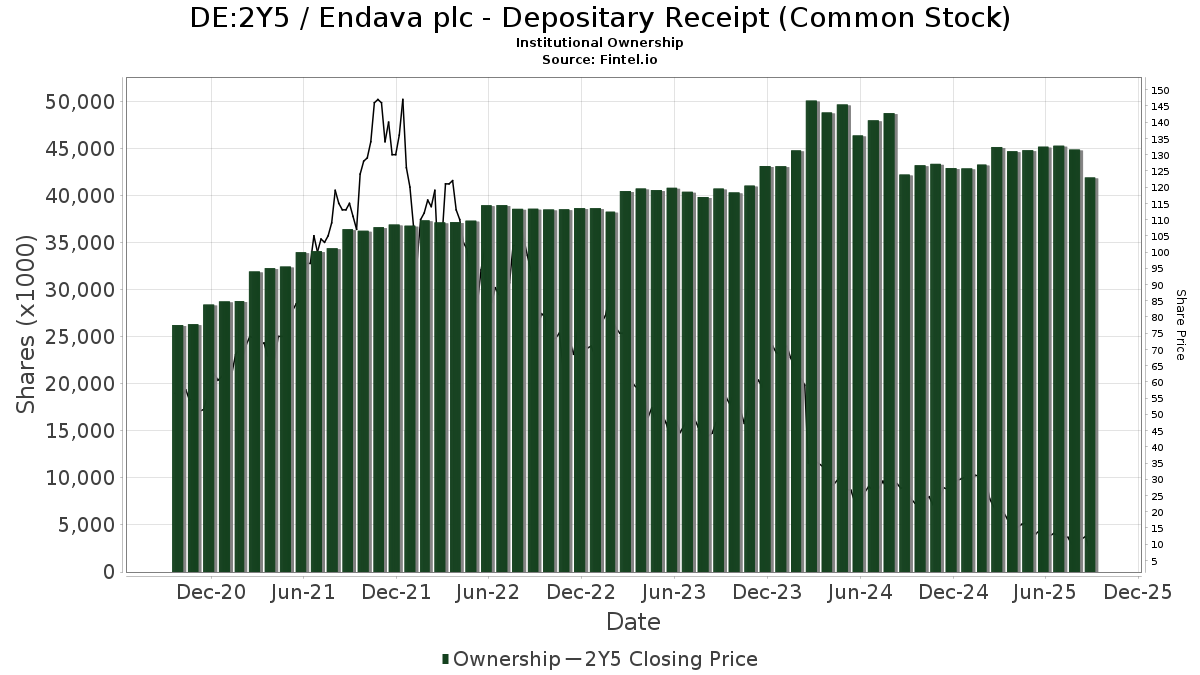
Endava plc - Depositary Receipt (Common Stock) (DE:2Y5) har 106 institutionelle ejere og aktionærer, der har indsendt 13D/G- eller 13F-formularer til Securities Exchange Commission (SEC). Disse institutioner har i alt 18,970,006 aktier. Største aktionærer omfatter Paradice Investment Management LLC, CDAM (UK) Ltd, Acadian Asset Management Llc, Prescott Group Capital Management, L.l.c., T. Rowe Price Investment Management, Inc., Alberta Investment Management Corp, Invenomic Capital Management LP, UBS Group AG, Kerrisdale Advisers, LLC, and Barclays Plc .
Endava plc - Depositary Receipt (Common Stock) (DB:2Y5) institutionel ejerskabsstruktur viser aktuelle positioner i virksomheden efter institutioner og fonde, samt seneste ændringer i positionsstørrelse. Større aktionærer kan omfatte individuelle investorer, investeringsforeninger, hedgefonde eller institutioner. Skema 13D angiver, at investoren besidder (eller besidder) mere end 5 % af virksomheden og har til hensigt (eller har til hensigt at) aktivt at forfølge en ændring i forretningsstrategi. Skema 13G indikerer en passiv investering på over 5%.
The share price as of April 27, 2026 is 3,66 / share. Previously, on April 30, 2025, the share price was 16,10 / share. This represents a decline of 77,27% over that period.
Fondens stemningsscore
Fund Sentiment Score (fka Ownership Accumulation Score) finder de aktier, der bliver mest købt af fonde. Det er resultatet af en sofistikeret, multi-faktor kvantitativ model, der identificerer virksomheder med de højeste niveauer af institutionel akkumulering. Scoringsmodellen bruger en kombination af den samlede stigning i oplyste ejere, ændringerne i porteføljeallokeringer i disse ejere og andre målinger. Tallet går fra 0 til 100, hvor højere tal indikerer et højere niveau af akkumulering for sine jævnaldrende, og 50 er gennemsnittet.
Opdateringsfrekvens: Dagligt
Se Ownership Explorer, som giver en liste over højest rangerende virksomheder.
AI+ Ask Fintel’s AI assistant about Endava plc - Depositary Receipt (Common Stock).
Select a question to share a public post with an AI-crafted answer.
Thinking of good questions…
13F og NPORT arkivering
Detaljer om 13F-arkivering er gratis. Detaljer om NP-ansøgninger kræver et premium-medlemskab. Grønne rækker angiver nye positioner. Røde rækker angiver lukkede positioner. Klik på linket ikon for at se den fulde transaktionshistorik.
Opgrader
for at låse premium-data op og eksportere til Excel ![]() .
.
| Fil dato | Kilde | Investor | Type | Gennemsnitlig pris (Øst) |
Aktier | Δ Aktier (%) |
Rapporteret Værdi ($1000) |
Δ Værdi (%) |
Port Alloc (%) |
|
|---|---|---|---|---|---|---|---|---|---|---|
| 2026-02-09 | 13F | Malaga Cove Capital, LLC | 0 | -100,00 | 0 | |||||
| 2026-02-09 | 13F | Geode Capital Management, Llc | 30.936 | 38,07 | 196 | -3,94 | ||||
| 2026-02-12 | 13F | Jane Street Group, Llc | Put | 0 | -100,00 | 0 | -100,00 | |||
| 2026-02-09 | 13F | Legal & General Group Plc | 253.852 | 105,12 | 1.603 | 42,49 | ||||
| 2026-02-13 | 13F | Barclays Plc | 517.985 | 100,05 | 3.274 | 38,92 | ||||
| 2025-11-14 | 13F | Wasatch Advisors Inc | 0 | -100,00 | 0 | |||||
| 2026-02-11 | 13F | Parallel Advisors, LLC | 175 | -48,83 | 1 | -66,67 | ||||
| 2025-11-14 | 13F | Grandeur Peak Global Advisors, LLC | 0 | -100,00 | 0 | |||||
| 2026-02-13 | 13F | Walleye Capital LLC | 31.645 | -66,17 | 200 | -76,62 | ||||
| 2026-02-13 | 13F | Neuberger Berman Group LLC | 0 | -100,00 | 0 | |||||
| 2026-02-17 | 13F | Trexquant Investment LP | 39.612 | 250 | ||||||
| 2026-02-13 | 13F | Quarry LP | 1.356 | 9 | ||||||
| 2026-02-12 | 13F | Principal Securities, Inc. | 0 | -100,00 | 0 | |||||
| 2026-01-28 | 13F | Ruffer LLP | 32.000 | -50,00 | 203 | -65,29 | ||||
| 2026-02-11 | 13F | Jpmorgan Chase & Co | 500 | 0,00 | 3 | -25,00 | ||||
| 2026-02-23 | 13F | Virtu Financial LLC | 0 | -100,00 | 0 | |||||
| 2026-02-12 | 13F | Davy Global Fund Management Ltd | 0 | -100,00 | 0 | |||||
| 2026-02-13 | 13F | Walleye Capital LLC | Call | 60.200 | 11,90 | 380 | -22,29 | |||
| 2026-01-28 | 13F | Paradice Investment Management LLC | 3.029.847 | 61,86 | 19.149 | 12,41 | ||||
| 2026-02-13 | 13F | Walleye Capital LLC | Put | 74.500 | 24,17 | 471 | -13,92 | |||
| 2026-02-13 | 13F | Missouri Trust & Investment Co | 0 | -100,00 | 0 | |||||
| 2026-02-17 | 13F | T. Rowe Price Investment Management, Inc. | 1.516.767 | 10 | ||||||
| 2026-04-21 | 13F | SmartHarvest Portfolios, LLC | 19.059 | 84 | ||||||
| 2026-04-21 | 13F | Hennessy Advisors Inc | 20.800 | 35,65 | 92 | -5,21 | ||||
| 2026-02-11 | 13F | Group One Trading, L.p. | 0 | -100,00 | 0 | |||||
| 2026-02-17 | 13F | Woodline Partners LP | 24.522 | -18,88 | 155 | -44,00 | ||||
| 2026-02-17 | 13F | Jones Financial Companies Lllp | 400 | -56,19 | 3 | -75,00 | ||||
| 2026-02-17 | 13F | Two Sigma Investments, Lp | 107.204 | 678 | ||||||
| 2026-01-23 | 13F | Farther Finance Advisors, LLC | 0 | -100,00 | 0 | |||||
| 2026-02-10 | 13F | Savant Capital, LLC | 12.001 | 76 | ||||||
| 2026-04-21 | 13F | PharVision Advisers, LLC | 0 | -100,00 | 0 | |||||
| 2026-02-06 | 13F | Pnc Financial Services Group, Inc. | 0 | -100,00 | 0 | |||||
| 2026-01-28 | 13F | M&t Bank Corp | 0 | -100,00 | 0 | |||||
| 2026-02-12 | 13F | Federation des caisses Desjardins du Quebec | 22.379 | 0,00 | 141 | -30,54 | ||||
| 2025-11-12 | 13F | Royce & Associates Lp | 0 | -100,00 | 0 | |||||
| 2025-10-31 | 13F | Whittier Trust Co Of Nevada Inc | 0 | -100,00 | 0 | -100,00 | ||||
| 2026-01-30 | 13F | Mitsubishi UFJ Trust & Banking Corp | 0 | -100,00 | 0 | |||||
| 2026-02-11 | 13F | SOUTH STATE Corp | 99 | -24,43 | 1 | -100,00 | ||||
| 2026-02-17 | 13F | Invenomic Capital Management LP | 742.260 | 4.691 | ||||||
| 2026-02-13 | 13F | Rhumbline Advisers | 1.155 | 116,29 | 7 | 75,00 | ||||
| 2026-04-06 | 13F | GAMMA Investing LLC | 4.017 | 1.175,24 | 18 | 1.600,00 | ||||
| 2026-02-17 | 13F | Engineers Gate Manager LP | 69.335 | 582,16 | 438 | 376,09 | ||||
| 2025-11-12 | 13F | Headlands Technologies LLC | 0 | -100,00 | 0 | |||||
| 2026-02-09 | 13F | Huntington National Bank | 1 | 0,00 | 0 | |||||
| 2025-11-14 | 13F | National Bank Of Canada /fi/ | 0 | -100,00 | 0 | |||||
| 2026-02-02 | 13F | Oppenheimer & Co Inc | 0 | -100,00 | 0 | -100,00 | ||||
| 2026-01-14 | 13F | Wolff Wiese Magana Llc | 0 | -100,00 | 0 | |||||
| 2025-11-14 | 13F | Price T Rowe Associates Inc /md/ | 0 | -100,00 | 0 | -100,00 | ||||
| 2026-02-17 | 13F | EFG International AG | 100 | 1 | ||||||
| 2026-02-17 | 13F | Susquehanna International Group, Llp | Call | 321.400 | 389,94 | 2.031 | 240,77 | |||
| 2026-01-27 | 13F | WealthCollab, LLC | 1.005 | 6 | ||||||
| 2026-02-17 | 13F | Susquehanna International Group, Llp | Put | 39.500 | -52,35 | 250 | -66,98 | |||
| 2026-02-17 | 13F | Mak Capital One Llc | 283.076 | 1.789 | ||||||
| 2026-01-27 | 13F | Zurcher Kantonalbank (Zurich Cantonalbank) | 13.411 | 22,83 | 85 | -15,15 | ||||
| 2026-02-17 | 13F | SageView Advisory Group, LLC | 400 | 3 | ||||||
| 2025-11-14 | 13F | Raymond James Financial Inc | 0 | -100,00 | 0 | -100,00 | ||||
| 2026-01-30 | 13F | State of New Jersey Common Pension Fund D | 82.819 | 29,85 | 523 | -9,83 | ||||
| 2026-02-13 | 13F | Wells Fargo & Company/mn | 183.770 | -67,34 | 1.161 | -77,32 | ||||
| 2026-02-13 | 13F | Walleye Trading LLC | 45.826 | 103,15 | 290 | 40,98 | ||||
| 2026-02-17 | 13F | Aquatic Capital Management LLC | 83.645 | 529 | ||||||
| 2026-01-23 | 13F | Robeco Institutional Asset Management B.V. | 0 | -100,00 | 0 | |||||
| 2026-02-17 | 13F | Graham Capital Management, L.P. | 0 | -100,00 | 0 | |||||
| 2026-02-10 | 13F | Quantbot Technologies LP | 900 | 6 | ||||||
| 2026-02-17 | 13F | Citadel Advisors Llc | Put | 100.100 | -49,70 | 633 | -65,08 | |||
| 2026-02-12 | 13F | Mark Sheptoff Financial Planning, Llc | 200 | 0,00 | 1 | 0,00 | ||||
| 2026-02-17 | 13F | Citadel Advisors Llc | Call | 144.100 | 266,67 | 911 | 154,90 | |||
| 2025-11-12 | 13F | Commonwealth Of Pennsylvania Public School Empls Retrmt Sys | 0 | -100,00 | 0 | |||||
| 2026-02-13 | 13F | Walleye Trading LLC | Put | 76.300 | 127,08 | 482 | 58,03 | |||
| 2026-02-13 | 13F | Walleye Trading LLC | Call | 55.200 | 36,63 | 349 | -5,18 | |||
| 2026-04-23 | 13F | SJS Investment Consulting Inc. | 158 | 393,75 | 1 | |||||
| 2026-04-28 | 13F | Alberta Investment Management Corp | 950.000 | 0,00 | 4.199 | -30,06 | ||||
| 2026-02-12 | 13F | Campbell & CO Investment Adviser LLC | 80.224 | 507 | ||||||
| 2026-02-03 | 13F | Strengthening Families & Communities, LLC | 352 | -81,04 | 2 | -95,12 | ||||
| 2025-11-13 | 13F | Fmr Llc | 0 | -100,00 | 0 | |||||
| 2025-11-14 | 13F | Df Dent & Co Inc | 0 | -100,00 | 0 | |||||
| 2026-01-26 | 13F | Cwm, Llc | 532 | 660,00 | 0 | |||||
| 2026-02-13 | 13F | MAI Capital Management | 187 | 0,00 | 1 | 0,00 | ||||
| 2025-11-05 | 13F | Azzad Asset Management Inc /adv | 0 | -100,00 | 0 | |||||
| 2026-02-13 | 13F | State Street Corp | 98.936 | 3,36 | 625 | -28,24 | ||||
| 2026-02-26 | 13F/A | Alpine Global Management, LLC | 13.803 | 87 | ||||||
| 2026-04-27 | 13F | BIP Wealth, LLC | 98.975 | -6,43 | 437 | -34,58 | ||||
| 2026-04-28 | 13F | Flagship Harbor Advisors, Llc | 0 | -100,00 | 0 | |||||
| 2026-02-17 | 13F | Jain Global LLC | 0 | -100,00 | 0 | |||||
| 2026-02-10 | 13F | Goldman Sachs Group Inc | 85.568 | -39,17 | 541 | -57,81 | ||||
| 2026-02-17 | 13F | Kerrisdale Advisers, LLC | 567.416 | -1,63 | 3.586 | -31,68 | ||||
| 2026-02-17 | 13F | Wiley Bros.-aintree Capital, Llc | 0 | -100,00 | 0 | |||||
| 2026-02-13 | 13F | Kayne Anderson Rudnick Investment Management Llc | 99.381 | -98,43 | 628 | -98,91 | ||||
| 2026-02-17 | 13F | Millennium Management Llc | 95.634 | 4,76 | 604 | -27,23 | ||||
| 2025-11-13 | 13F | Deutsche Bank Ag\ | 0 | -100,00 | 0 | |||||
| 2026-02-12 | 13F | Barometer Capital Management Inc. | 0 | -100,00 | 0 | |||||
| 2026-04-07 | 13F | U.S. Capital Wealth Advisors, LLC | 18.000 | 80 | ||||||
| 2026-04-07 | 13F | Signaturefd, Llc | 0 | -100,00 | 0 | |||||
| 2025-11-14 | 13F | Sompo Japan Nipponkoa Asset Management Co.,ltd. | 0 | -100,00 | 0 | |||||
| 2026-02-10 | 13F | Acadian Asset Management Llc | 1.610.431 | 41,10 | 10 | 0,00 | ||||
| 2026-02-13 | 13F | Squarepoint Ops LLC | 13.443 | 85 | ||||||
| 2025-11-04 | 13F | Callan Family Office, LLC | 0 | -100,00 | 0 | -100,00 | ||||
| 2026-02-13 | 13F | SRS Capital Advisors, Inc. | 49 | 0 | ||||||
| 2026-02-10 | 13F | State of Wyoming | 866 | -66,05 | 5 | -78,26 | ||||
| 2026-02-19 | 13F | Invesco Ltd. | 204.209 | -85,02 | 1.291 | -89,60 | ||||
| 2026-04-07 | 13F | CoreCap Advisors, LLC | 7 | 0,00 | 0 | |||||
| 2026-02-13 | 13F | Sei Investments Co | 53.659 | -82,85 | 339 | -88,09 | ||||
| 2026-02-17 | 13F | Sovereign's Capital Management, LLC | 18.219 | -10,48 | 115 | -37,84 | ||||
| 2026-02-06 | 13F | Prescott Group Capital Management, L.l.c. | 1.606.324 | 32,06 | 10.152 | -8,29 | ||||
| 2026-02-12 | 13F | Jane Street Group, Llc | 214.709 | 44,07 | 1.357 | 0,00 | ||||
| 2026-04-21 | 13F | Pflug Koory, LLC | 2 | 0,00 | 0 | |||||
| 2026-02-12 | 13F | Jane Street Group, Llc | Call | 45.200 | 286 | |||||
| 2026-02-06 | 13F | Gsa Capital Partners Llp | 0 | -100,00 | 0 | |||||
| 2026-02-11 | 13F | LPL Financial LLC | 0 | -100,00 | 0 | |||||
| 2026-02-11 | 13F | CenterBook Partners LP | 27.734 | 175 | ||||||
| 2026-02-13 | 13F | Stifel Financial Corp | 0 | -100,00 | 0 | |||||
| 2026-02-05 | 13F | Allworth Financial LP | 43 | -84,13 | 0 | -100,00 | ||||
| 2026-02-12 | 13F | Quadrant Capital Group Llc | 6.101 | 901,81 | 39 | 660,00 | ||||
| 2025-11-14 | 13F | Mariner, LLC | 0 | -100,00 | 0 | |||||
| 2026-02-11 | 13F | RAM Investment Partners, LLC | 26.601 | -9,44 | 168 | -37,08 | ||||
| 2026-02-02 | 13F | Alliance Wealth Advisors, LLC /UT | 0 | -100,00 | 0 | |||||
| 2026-02-18 | 13F | GWM Advisors LLC | 0 | -100,00 | 0 | |||||
| 2026-02-12 | 13F | New York State Common Retirement Fund | 36.749 | 0,00 | 232 | -30,54 | ||||
| 2025-11-05 | 13F | Smartleaf Asset Management LLC | 0 | -100,00 | 0 | |||||
| 2026-02-13 | 13F | Parkside Financial Bank & Trust | 125 | 0,00 | 1 | -100,00 | ||||
| 2026-04-16 | 13F | SG Americas Securities, LLC | 22.893 | -20,38 | 0 | |||||
| 2026-02-13 | 13F | Verition Fund Management LLC | 0 | -100,00 | 0 | |||||
| 2026-02-13 | 13F | Charles Schwab Investment Management Inc | 103.140 | 73,34 | 652 | 20,33 | ||||
| 2026-04-22 | 13F | Janney Montgomery Scott LLC | 0 | -100,00 | 0 | |||||
| 2025-11-14 | 13F | Cubist Systematic Strategies, LLC | 152.084 | 1.384 | ||||||
| 2026-01-30 | 13F | Us Bancorp \de\ | 5.747 | -72,92 | 36 | -81,35 | ||||
| 2026-02-13 | 13F | Morgan Stanley | 86.563 | 4,84 | 547 | -27,16 | ||||
| 2025-11-13 | 13F | Bnp Paribas Arbitrage, Sa | 0 | -100,00 | 0 | -100,00 | ||||
| 2025-11-14 | 13F | Susquehanna International Group, Llp | 0 | -100,00 | 0 | -100,00 | ||||
| 2026-02-17 | 13F | SIH Partners, LLLP | 13.505 | 0,00 | 85 | -30,33 | ||||
| 2026-02-17 | 13F | Tower Research Capital LLC (TRC) | 500 | 220,51 | 3 | 200,00 | ||||
| 2025-11-14 | 13F | XTX Topco Ltd | 0 | -100,00 | 0 | -100,00 | ||||
| 2026-02-18 | 13F | Vident Advisory, LLC | 10.750 | 68 | ||||||
| 2026-02-02 | 13F | Kornitzer Capital Management Inc /ks | 0 | -100,00 | 0 | |||||
| 2026-02-17 | 13F | Citadel Advisors Llc | 0 | -100,00 | 0 | |||||
| 2026-02-06 | 13F/A | Rathbone Brothers plc | 360.823 | 0,00 | 2.280 | -30,55 | ||||
| 2026-02-17 | 13F | Balyasny Asset Management Llc | 42.403 | 268 | ||||||
| 2026-02-17 | 13F | Advisory Services Network, LLC | 36.704 | 1.101,83 | 232 | 755,56 | ||||
| 2026-02-11 | 13F | Fox Run Management, L.l.c. | 11.475 | 73 | ||||||
| 2025-11-14 | 13F | Fourth Sail Capital LP | 0 | -100,00 | 0 | |||||
| 2026-02-11 | 13F | Simplex Trading, Llc | 0 | -100,00 | 0 | |||||
| 2026-02-17 | 13F | Voloridge Investment Management, Llc | 0 | -100,00 | 0 | |||||
| 2026-02-12 | 13F | Skandinaviska Enskilda Banken AB (publ) | 0 | -100,00 | 0 | |||||
| 2026-04-03 | 13F | Investors Research Corp | 11.750 | 0,00 | 52 | -31,08 | ||||
| 2026-04-17 | 13F | Bell Investment Advisors, Inc | 516 | 2 | ||||||
| 2026-02-17 | 13F | Bamco Inc /ny/ | 0 | -100,00 | 0 | |||||
| 2026-01-29 | 13F | UBS Group AG | 628.463 | -16,88 | 3.972 | -42,28 | ||||
| 2026-02-12 | 13F | Ensign Peak Advisors, Inc | 0 | -100,00 | 0 | |||||
| 2026-02-13 | 13F | CDAM (UK) Ltd | 2.979.658 | 28,18 | 18.831 | -10,98 | ||||
| 2026-02-17 | 13F | Public Employees Retirement System Of Ohio | 118.197 | 0,00 | 747 | -30,51 | ||||
| 2026-02-06 | 13F | EverSource Wealth Advisors, LLC | 507 | 24,57 | 3 | 0,00 | ||||
| 2026-04-28 | 13F | Quent Capital, LLC | 3.000 | 0,00 | 13 | -27,78 | ||||
| 2026-02-17 | 13F | Advisor Group Holdings, Inc. | 174 | -50,29 | 1 | -80,00 | ||||
| 2026-02-17 | 13F | Quadrature Capital Ltd | 87.177 | 56,55 | 551 | 8,70 | ||||
| 2025-11-12 | 13F | GW&K Investment Management, LLC | 0 | -100,00 | 0 | |||||
| 2026-02-14 | 13F | Rockefeller Capital Management L.P. | 0 | -100,00 | 0 | |||||
| 2026-02-17 | 13F | Royal Bank Of Canada | 4.754 | -22,80 | 30 | -46,43 | ||||
| 2026-02-13 | 13F | Marshall Wace, Llp | 205.895 | 1.301 | ||||||
| 2026-03-12 | 13F | Nalls Sherbakoff Group, Llc | 0 | -100,00 | 0 | |||||
| 2026-02-12 | 13F | BlackRock, Inc. | 14.102 | -93,65 | 89 | -95,59 | ||||
| 2026-02-18 | 13F | State of Tennessee, Treasury Department | 73.091 | 102,47 | 462 | 40,55 | ||||
| 2026-02-05 | 13F | Cambridge Investment Research Advisors, Inc. | 0 | -100,00 | 0 | |||||
| 2025-11-19 | 13F | Caitong International Asset Management Co., Ltd | 0 | -100,00 | 0 | |||||
| 2026-02-10 | 13F | Envestnet Asset Management Inc | 0 | -100,00 | 0 | |||||
| 2026-02-10 | 13F | CIBC World Markets Inc. | 10.374 | -1,22 | 66 | -31,58 | ||||
| 2026-02-10 | 13F | Daiwa Securities Group Inc. | 0 | -100,00 | 0 | |||||
| 2026-02-17 | 13F | Point72 Asset Management, L.P. | 364.360 | -40,53 | 2.303 | -58,71 | ||||
| 2026-04-10 | 13F/A | Aegon Asset Management Uk Plc | 323.370 | -2,79 | 6.296 | 62.860,00 | ||||
| 2026-02-06 | 13F | Handelsbanken Fonder AB | 0 | -100,00 | 0 | |||||
| 2026-01-21 | 13F | Portside Wealth Group, LLC | 0 | -100,00 | 0 | |||||
| 2026-02-06 | 13F | Global Retirement Partners, LLC | 42 | 0,00 | 0 | |||||
| 2026-02-17 | 13F | Circumference Group LLC | 0 | -100,00 | 0 | |||||
| 2026-04-13 | 13F | Perennial Advisors, LLC | 10.000 | 0,00 | 44 | -30,16 | ||||
| 2026-02-13 | 13F | Citigroup Inc | 17.879 | 871,68 | 113 | 600,00 | ||||
| 2026-02-17 | 13F | Brevan Howard Capital Management LP | 0 | -100,00 | 0 | |||||
| 2025-11-14 | 13F | Wolverine Trading, Llc | Put | 25.300 | 228 | |||||
| 2025-11-06 | 13F | Atria Investments Llc | 0 | -100,00 | 0 | |||||
| 2026-04-28 | 13F | Bogart Wealth, LLC | 3 | 0 | ||||||
| 2026-02-02 | 13F | Fifth Third Bancorp | 0 | -100,00 | 0 | |||||
| 2026-02-10 | 13F/A | Northwestern Mutual Wealth Management Co | 1.259 | 0,80 | 8 | -36,36 | ||||
| 2025-11-14 | 13F | Findell Capital Management Llc | 0 | -100,00 | 0 | |||||
| 2026-03-11 | 13F | Leonteq Securities AG | 0 | -100,00 | 0 | |||||
| 2026-02-04 | 13F | Atlantic Union Bankshares Corp | 33 | -74,81 | 0 | -100,00 | ||||
| 2026-02-13 | 13F | Centiva Capital, LP | 19.743 | -34,34 | 125 | -54,58 | ||||
| 2025-11-14 | 13F | Wolverine Trading, Llc | Call | 30.000 | 123,88 | 270 | 34,33 | |||
| 2026-04-28 | 13F | SBI Securities Co., Ltd. | 557 | -33,53 | 2 | -60,00 | ||||
| 2026-02-17 | 13F | Bank Of America Corp /de/ | 147.019 | 68,62 | 929 | 17,15 |
Other Listings
| US:DAVA | 4,25 $ |