Grundlæggende statistik
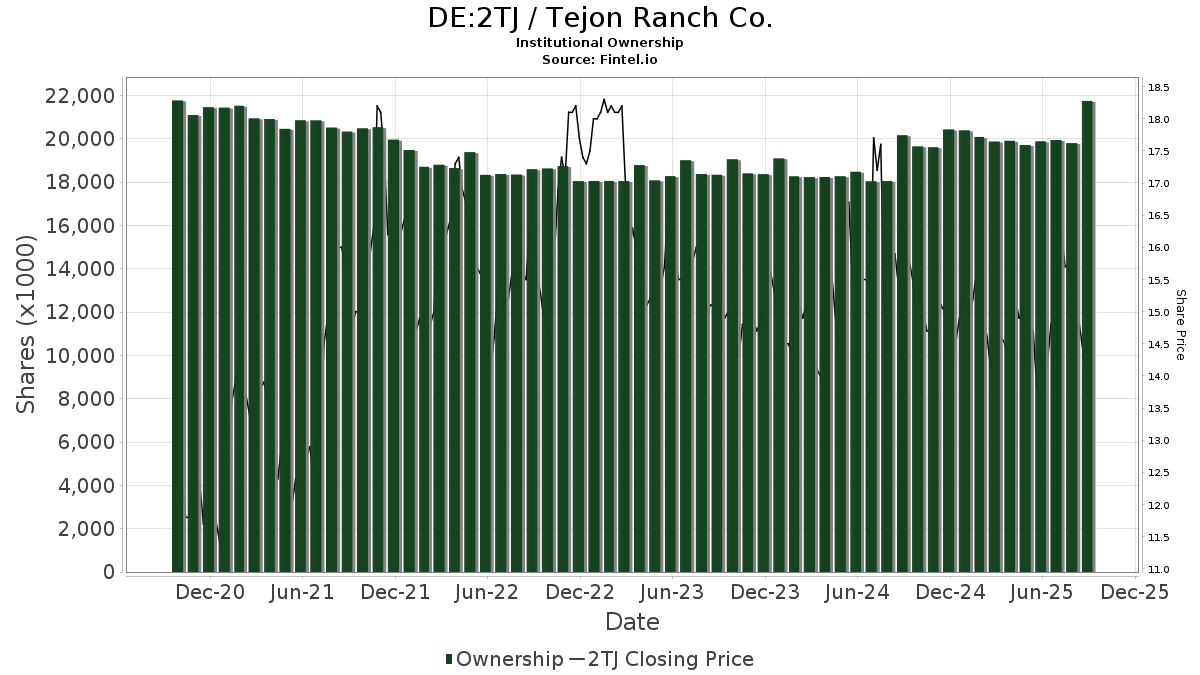
| Institutionelle aktier (lange) | 20.104.387 - 74,45% (ex 13D/G) - change of -2,41MM shares -10,71% MRQ |
| Institutionel værdi (lang) | $ 319.974 USD ($1000) |
Institutionelt ejerskab og aktionærer
Tejon Ranch Co. (DE:2TJ) har 128 institutionelle ejere og aktionærer, der har indsendt 13D/G- eller 13F-formularer til Securities Exchange Commission (SEC). Disse institutioner har i alt 20,104,387 aktier. Største aktionærer omfatter Towerview Llc, Vanguard Group Inc, Horizon Kinetics Asset Management Llc, BlackRock, Inc., Dimensional Fund Advisors Lp, Nitor Capital Management LLC, Bulldog Investors, LLP, Gamco Investors, Inc. Et Al, Lee Danner & Bass Inc, and Geode Capital Management, Llc .
Tejon Ranch Co. (DB:2TJ) institutionel ejerskabsstruktur viser aktuelle positioner i virksomheden efter institutioner og fonde, samt seneste ændringer i positionsstørrelse. Større aktionærer kan omfatte individuelle investorer, investeringsforeninger, hedgefonde eller institutioner. Skema 13D angiver, at investoren besidder (eller besidder) mere end 5 % af virksomheden og har til hensigt (eller har til hensigt at) aktivt at forfølge en ændring i forretningsstrategi. Skema 13G indikerer en passiv investering på over 5%.
The share price as of April 30, 2026 is 16,50 / share. Previously, on May 2, 2025, the share price was 15,10 / share. This represents an increase of 9,27% over that period.
Fondens stemningsscore
Fund Sentiment Score (fka Ownership Accumulation Score) finder de aktier, der bliver mest købt af fonde. Det er resultatet af en sofistikeret, multi-faktor kvantitativ model, der identificerer virksomheder med de højeste niveauer af institutionel akkumulering. Scoringsmodellen bruger en kombination af den samlede stigning i oplyste ejere, ændringerne i porteføljeallokeringer i disse ejere og andre målinger. Tallet går fra 0 til 100, hvor højere tal indikerer et højere niveau af akkumulering for sine jævnaldrende, og 50 er gennemsnittet.
Opdateringsfrekvens: Dagligt
Se Ownership Explorer, som giver en liste over højest rangerende virksomheder.
AI+ Ask Fintel’s AI assistant about Tejon Ranch Co..
Select a question to share a public post with an AI-crafted answer.
Thinking of good questions…
13F og NPORT arkivering
Detaljer om 13F-arkivering er gratis. Detaljer om NP-ansøgninger kræver et premium-medlemskab. Grønne rækker angiver nye positioner. Røde rækker angiver lukkede positioner. Klik på linket ikon for at se den fulde transaktionshistorik.
Opgrader
for at låse premium-data op og eksportere til Excel ![]() .
.
| Fil dato | Kilde | Investor | Type | Gennemsnitlig pris (Øst) |
Aktier | Δ Aktier (%) |
Rapporteret Værdi ($1000) |
Δ Værdi (%) |
Port Alloc (%) |
|
|---|---|---|---|---|---|---|---|---|---|---|
| 2026-02-06 | 13F | EverSource Wealth Advisors, LLC | 73 | -88,54 | 1 | -90,00 | ||||
| 2025-11-14 | 13F | Citadel Advisors Llc | Call | 0 | -100,00 | 0 | ||||
| 2026-02-10 | 13F | Bnp Paribas Arbitrage, Sa | 6.605 | -51,18 | 104 | -51,85 | ||||
| 2025-11-04 | 13F | Winnow Wealth Llc | 0 | -100,00 | 0 | |||||
| 2026-02-13 | 13F | MAI Capital Management | 14 | 0 | ||||||
| 2025-11-05 | 13F | Bessemer Group Inc | 0 | -100,00 | 0 | |||||
| 2026-02-17 | 13F | Topline Capital Management, LLC | 80.273 | 1.266 | ||||||
| 2026-04-13 | 13F | True Wealth Design, LLC | 57 | -9,52 | 1 | |||||
| 2026-02-11 | 13F | Simplex Trading, Llc | 29 | -52,46 | 0 | |||||
| 2026-02-12 | 13F | BlackRock, Inc. | 1.590.167 | 2,24 | 25.077 | 0,89 | ||||
| 2026-04-21 | 13F | Foundation Resource Management Inc | 512.314 | 3,54 | 9.652 | 23,68 | ||||
| 2026-04-24 | 13F | Key FInancial Inc | 283 | 0,00 | 5 | 25,00 | ||||
| 2026-02-11 | 13F | Franklin Resources Inc | 0 | -100,00 | 0 | -100,00 | ||||
| 2026-02-11 | 13F | CenterBook Partners LP | 0 | -100,00 | 0 | -100,00 | ||||
| 2026-02-13 | 13F | Bulldog Investors, LLP | 791.492 | 0,13 | 12.482 | -1,19 | ||||
| 2026-02-11 | 13F | Jpmorgan Chase & Co | 8.636 | -55,88 | 136 | -56,41 | ||||
| 2026-02-13 | 13F | Sei Investments Co | 84.933 | 1.339 | ||||||
| 2026-01-29 | 13F | UBS Group AG | 69.790 | -77,33 | 1.101 | -77,64 | ||||
| 2026-02-12 | 13F | Quadrant Capital Group Llc | 42 | 1 | ||||||
| 2026-02-13 | 13F | Quattro Advisors LLC | 202 | 3 | ||||||
| 2026-02-12 | 13F | Renaissance Technologies Llc | 332.826 | -17,13 | 5.249 | -18,23 | ||||
| 2026-02-12 | 13F | Campbell & CO Investment Adviser LLC | 10.973 | 173 | ||||||
| 2026-04-14 | 13F | Thurston, Springer, Miller, Herd & Titak, Inc. | 43 | 1 | ||||||
| 2026-01-30 | 13F | Levin Capital Strategies, L.p. | 101.772 | -0,28 | 1.605 | -1,60 | ||||
| 2026-02-12 | 13F | MetLife Investment Management, LLC | 11.947 | 0,00 | 188 | -1,05 | ||||
| 2026-02-17 | 13F | XTX Topco Ltd | 12.422 | -32,96 | 196 | -34,12 | ||||
| 2025-11-13 | 13F | Marshall Wace, Llp | 0 | -100,00 | 0 | |||||
| 2026-02-17 | 13F | Royal Bank Of Canada | 1.011 | -98,86 | 16 | -98,88 | ||||
| 2026-02-13 | 13F | SRS Capital Advisors, Inc. | 251 | -80,39 | 4 | -85,00 | ||||
| 2026-02-13 | 13F | Citigroup Inc | 14.407 | -32,74 | 227 | -33,63 | ||||
| 2025-11-03 | 13F | Acuitas Investments, LLC | 0 | -100,00 | 0 | |||||
| 2026-02-13 | 13F | Transamerica Financial Advisors, Inc. | 16 | 0 | ||||||
| 2026-04-06 | 13F | Msrh, Llc | 81 | 1 | ||||||
| 2026-02-10 | 13F | Eurizon Capital SGR S.p.A. | 5.505 | 87 | ||||||
| 2026-02-11 | 13F | Parallel Advisors, LLC | 67 | 0,00 | 1 | 0,00 | ||||
| 2026-02-18 | 13F | GWM Advisors LLC | 700 | 0,00 | 11 | 0,00 | ||||
| 2026-02-09 | 13F | Geode Capital Management, Llc | 584.442 | -0,02 | 9.219 | -1,34 | ||||
| 2026-02-17 | 13F | Nitor Capital Management LLC | 1.346.056 | 21.227 | ||||||
| 2026-01-26 | 13F | Cwm, Llc | 731 | 10,76 | 0 | |||||
| 2026-04-30 | 13F | Nuveen, LLC | 47.230 | -12,31 | 890 | 4,71 | ||||
| 2026-02-17 | 13F | Advisory Services Network, LLC | 0 | -100,00 | 0 | |||||
| 2026-02-13 | 13F | Barclays Plc | 32.787 | 10,69 | 517 | 9,30 | ||||
| 2026-02-13 | 13F | Smartleaf Asset Management LLC | 23 | 0,00 | 0 | |||||
| 2026-02-17 | 13F | First Manhattan Co | 15.600 | 0,00 | 246 | -1,20 | ||||
| 2026-04-06 | 13F | GAMMA Investing LLC | 907 | 40,62 | 17 | 70,00 | ||||
| 2026-04-14 | 13F | Nbc Securities, Inc. | 1.628 | 0,00 | 31 | 20,00 | ||||
| 2026-02-17 | 13F | Jones Financial Companies Lllp | 74 | 1 | ||||||
| 2026-02-05 | 13F | Reik & Co., Llc | 46.879 | 0,00 | 739 | -1,34 | ||||
| 2026-02-09 | 13F | Royce & Associates Lp | 313.818 | 0,00 | 4.949 | -1,32 | ||||
| 2026-02-06 | 13F | Alan B. Lancz & Associates, Inc. | 0 | -100,00 | 0 | |||||
| 2026-02-13 | 13F | American Century Companies Inc | 57.648 | -0,12 | 909 | -1,41 | ||||
| 2026-02-13 | 13F | Rhumbline Advisers | 28.791 | -10,01 | 454 | -11,15 | ||||
| 2026-02-11 | 13F | Brandywine Global Investment Management, LLC | 108.992 | -3,54 | 1.719 | -4,82 | ||||
| 2026-02-10 | 13F | Oppenheimer & Close, LLC | 141.681 | 7,59 | 2.234 | 6,18 | ||||
| 2026-02-11 | 13F | Los Angeles Capital Management Llc | 50 | 1 | ||||||
| 2025-11-12 | 13F | CIBC Bancorp USA Inc. | 17.216 | 275 | ||||||
| 2026-02-06 | 13F | Pnc Financial Services Group, Inc. | 928 | -10,42 | 15 | -12,50 | ||||
| 2026-02-17 | 13F | Northern Trust Corp | 186.321 | -6,38 | 2.938 | -7,61 | ||||
| 2026-02-17 | 13F | Quantinno Capital Management LP | 69.459 | 12,36 | 1.095 | 10,94 | ||||
| 2026-02-17 | 13F | Two Sigma Investments, Lp | 18.720 | -77,23 | 295 | -77,53 | ||||
| 2026-02-12 | 13F | Dimensional Fund Advisors Lp | 1.553.216 | -4,54 | 24.494 | -5,80 | ||||
| 2026-04-16 | 13F | SG Americas Securities, LLC | 0 | -100,00 | 0 | |||||
| 2026-02-09 | 13F | Huntington National Bank | 156 | 0,00 | 2 | 0,00 | ||||
| 2026-04-29 | 13F | Police & Firemen's Retirement System of New Jersey | 5.387 | 0,00 | 101 | 20,24 | ||||
| 2026-02-17 | 13F | Aqr Capital Management Llc | 11.970 | 11,82 | 189 | 9,94 | ||||
| 2026-02-17 | 13F | Millennium Management Llc | 24.645 | 389 | ||||||
| 2026-02-17 | 13F | Tower Research Capital LLC (TRC) | 715 | -61,83 | 11 | -62,07 | ||||
| 2025-11-14 | 13F | Susquehanna International Group, Llp | 0 | -100,00 | 0 | -100,00 | ||||
| 2025-11-14 | 13F | Manchester Capital Management LLC | 1.537 | 12,85 | 25 | 4,35 | ||||
| 2026-02-17 | 13F | Almitas Capital LLC | 93.137 | 1.469 | ||||||
| 2026-02-17 | 13F | Alliancebernstein L.p. | 21.022 | 0,00 | 332 | -1,19 | ||||
| 2026-04-28 | 13F | Lee Danner & Bass Inc | 695.425 | 1.109,43 | 13.102 | 1.346,03 | ||||
| 2026-02-13 | 13F | Dynamic Technology Lab Private Ltd | 12.106 | 191 | ||||||
| 2026-02-17 | 13F | Fmr Llc | 640 | 15,52 | 10 | 25,00 | ||||
| 2026-04-28 | 13F | Quent Capital, LLC | 3.851 | 0,00 | 74 | 21,67 | ||||
| 2026-02-06 | 13F | HighTower Advisors, LLC | 10.021 | 0,01 | 158 | -1,25 | ||||
| 2026-02-06 | 13F | Tortoise Investment Management, LLC | 0 | -100,00 | 0 | -100,00 | ||||
| 2026-02-10 | 13F | Goldman Sachs Group Inc | 68.472 | -5,56 | 1.080 | -6,82 | ||||
| 2026-02-13 | 13F | Public Employees Retirement Association Of Colorado | 5.756 | 0,00 | 0 | |||||
| 2026-04-07 | 13F | Farther Finance Advisors, LLC | 1 | 0,00 | 0 | |||||
| 2026-04-21 | 13F | GHP Investment Advisors, Inc. | 1 | 0,00 | 0 | |||||
| 2026-02-17 | 13F | Russell Investments Group, Ltd. | 2.450 | 22,75 | 39 | 22,58 | ||||
| 2026-02-09 | 13F | Quest Partners LLC | 981 | -26,46 | 15 | -28,57 | ||||
| 2026-02-09 | 13F | Legal & General Group Plc | 1.796 | -7,85 | 28 | -9,68 | ||||
| 2026-02-12 | 13F | New York State Common Retirement Fund | 6.277 | -20,31 | 99 | -21,60 | ||||
| 2026-02-03 | 13F | Legacy Wealth Managment, LLC/ID | 448 | 7 | ||||||
| 2026-02-05 | 13F | Teton Advisors, LLC | 82.000 | -1,20 | 1.293 | -2,49 | ||||
| 2026-02-10 | 13F | CIBC World Markets Inc. | 102.150 | 0,99 | 1.611 | -0,37 | ||||
| 2026-02-17 | 13F | Bank Of America Corp /de/ | 34.120 | 35,24 | 538 | 33,50 | ||||
| 2026-04-24 | 13F | Medallion Wealth Advisors, LLC | 94 | 0,00 | 2 | 0,00 | ||||
| 2026-02-13 | 13F | Quarry LP | 0 | -100,00 | 0 | |||||
| 2026-04-22 | 13F | Sterling Capital Management LLC | 697 | -96,92 | 13 | -96,36 | ||||
| 2026-02-12 | 13F | Jane Street Group, Llc | 0 | -100,00 | 0 | -100,00 | ||||
| 2026-01-29 | 13F | Dunhill Financial, LLC | 1 | 0 | ||||||
| 2026-02-05 | 13F | Gamco Investors, Inc. Et Al | 732.826 | 8,40 | 11.557 | 6,98 | ||||
| 2026-02-11 | 13F | Deutsche Bank Ag\ | 14.110 | 36,67 | 223 | 35,37 | ||||
| 2026-01-30 | 13F | Us Bancorp \de\ | 2.029 | -8,97 | 32 | -11,43 | ||||
| 2026-02-13 | 13F | Wells Fargo & Company/mn | 24.537 | 13,72 | 387 | 12,21 | ||||
| 2025-11-14 | 13F | Raymond James Financial Inc | 0 | -100,00 | 0 | |||||
| 2026-02-06 | 13F | Larson Financial Group LLC | 143 | 0,00 | 2 | 0,00 | ||||
| 2026-02-17 | 13F | Optiver Holding B.V. | 172 | -50,29 | 3 | -60,00 | ||||
| 2026-02-05 | 13F | Gabelli Funds Llc | 263.000 | 11,91 | 4.148 | 10,44 | ||||
| 2026-02-19 | 13F | Invesco Ltd. | 26.830 | -8,23 | 423 | -9,42 | ||||
| 2026-04-06 | 13F | Versant Capital Management, Inc | 3.435 | 129,00 | 65 | 178,26 | ||||
| 2026-04-15 | 13F | Trust Co Of Toledo Na /oh/ | 400 | 0,00 | 8 | 16,67 | ||||
| 2026-02-13 | 13F | Neuberger Berman Group LLC | 110.956 | 19,65 | 1.750 | 18,10 | ||||
| 2026-02-10 | 13F | Rothschild Investment Llc | 0 | -100,00 | 0 | |||||
| 2026-02-12 | 13F | Steward Partners Investment Advisory, Llc | 133 | -80,61 | 2 | -80,00 | ||||
| 2026-02-04 | 13F | Towerview Llc | 3.845.500 | 0,00 | 60.644 | -1,31 | ||||
| 2026-02-13 | 13F | Ubs Asset Management Americas Inc | 641 | 10 | ||||||
| 2026-02-17 | 13F | D. E. Shaw & Co., Inc. | 45.448 | -25,56 | 717 | -26,56 | ||||
| 2026-02-17 | 13F | Two Sigma Advisers, Lp | 0 | -100,00 | 0 | |||||
| 2025-11-12 | 13F | Kennondale Capital Management LLC | 0 | -100,00 | 0 | |||||
| 2026-02-17 | 13F | ExodusPoint Capital Management, LP | 0 | -100,00 | 0 | -100,00 | ||||
| 2026-05-01 | 13F | Fifth Third Bancorp | 903 | 17 | ||||||
| 2026-02-11 | 13F | Ameritas Investment Partners, Inc. | 2.066 | 33 | ||||||
| 2026-02-06 | 13F | Covestor Ltd | 21.399 | -0,26 | 0 | |||||
| 2026-02-03 | 13F | Cheviot Value Management, LLC | 120 | 0,00 | 2 | 0,00 | ||||
| 2026-04-24 | 13F | Strs Ohio | 4.100 | 0,00 | 77 | 20,31 | ||||
| 2026-04-02 | 13F | Marex Group plc | 0 | -100,00 | 0 | |||||
| 2026-04-30 | 13F | Nisa Investment Advisors, Llc | 86 | -89,76 | 2 | -92,31 | ||||
| 2026-02-17 | 13F | Creative Planning | 57.669 | 75,85 | 909 | 73,47 | ||||
| 2025-11-13 | 13F | Arrowstreet Capital, Limited Partnership | 0 | -100,00 | 0 | |||||
| 2026-02-17 | 13F | Citadel Advisors Llc | 16.233 | 256 | ||||||
| 2026-02-17 | 13F | MIRAE ASSET GLOBAL ETFS HOLDINGS Ltd. | 9.771 | -1,15 | 154 | -1,91 | ||||
| 2026-02-13 | 13F | Morgan Stanley | 129.550 | -4,53 | 2.043 | -5,77 | ||||
| 2026-01-29 | 13F | Comerica Bank | 1.226 | 0,00 | 19 | 0,00 | ||||
| 2026-01-29 | 13F | Concurrent Investment Advisors, LLC | 446.595 | 0,26 | 7.043 | -1,07 | ||||
| 2026-02-05 | 13F | Amalgamated Bank | 661 | -8,83 | 0 | |||||
| 2026-02-17 | 13F | California State Teachers Retirement System | 1.294 | -1,22 | 20 | 0,00 | ||||
| 2026-04-13 | 13F | IFP Advisors, Inc | 0 | -100,00 | 0 | |||||
| 2026-04-22 | 13F | Princeton Global Asset Management LLC | 1.000 | 0,00 | 19 | 20,00 | ||||
| 2026-02-12 | 13F | Jane Street Group, Llc | Call | 11.600 | -12,12 | 183 | -13,33 | |||
| 2026-04-28 | 13F | Whittier Trust Co | 11 | 0,00 | 0 | |||||
| 2026-02-11 | 13F | Horizon Kinetics Asset Management Llc | 1.912.573 | -0,07 | 30.161 | -1,39 | ||||
| 2026-02-17 | 13F | Price T Rowe Associates Inc /md/ | 31.667 | 22,13 | 0 | |||||
| 2026-02-13 | 13F | State Street Corp | 498.734 | -0,61 | 7.865 | -1,91 | ||||
| 2026-02-17 | 13F | Clayton Partners LLC | 17.709 | 279 | ||||||
| 2026-02-05 | 13F | Allworth Financial LP | 543 | 299,26 | 9 | 300,00 | ||||
| 2026-02-12 | 13F | Arbiter Partners Capital Management LLC | 13.742 | 0,00 | 217 | -1,37 | ||||
| 2026-02-10 | 13F | Private Wealth Asset Management, LLC | 13 | 0,00 | 0 | |||||
| 2026-02-17 | 13F | Susquehanna International Group, Llp | Call | 35.500 | 560 | |||||
| 2026-01-22 | 13F | Accordant Advisory Group Inc | 49.528 | 46,99 | 781 | 45,17 | ||||
| 2026-02-10 | 13F | Bank of New York Mellon Corp | 73.284 | 6,21 | 1.156 | 4,81 | ||||
| 2026-04-07 | 13F | Signaturefd, Llc | 355 | 7,25 | 7 | 20,00 | ||||
| 2026-04-24 | 13F | UMA Financial Services, Inc. | 0 | -100,00 | 0 | |||||
| 2026-02-12 | 13F | CIBC Private Wealth Group, LLC | 13.804 | -0,86 | 218 | -2,25 | ||||
| 2026-04-24 | 13F | Root Financial Partners, LLC | 22 | 0 | ||||||
| 2026-02-13 | 13F | Charles Schwab Investment Management Inc | 194.377 | -3,14 | 3.065 | -4,40 | ||||
| 2026-02-17 | 13F | Advisor Group Holdings, Inc. | 872 | 0,00 | 14 | -13,33 | ||||
| 2026-01-29 | 13F | Vanguard Group Inc | 2.138.336 | 0,00 | 33.722 | -1,31 | ||||
| 2026-03-26 | 13F | Leonteq Securities AG | 0 | -100,00 | 0 |
Other Listings
| US:TRC | 19,57 $ |