Grundlæggende statistik
| Institutionelle aktier (lange) | 13.996.521 - 32,15% (ex 13D/G) - change of 0,32MM shares 2,36% MRQ |
| Institutionel værdi (lang) | $ 51.894 USD ($1000) |
Institutionelt ejerskab og aktionærer
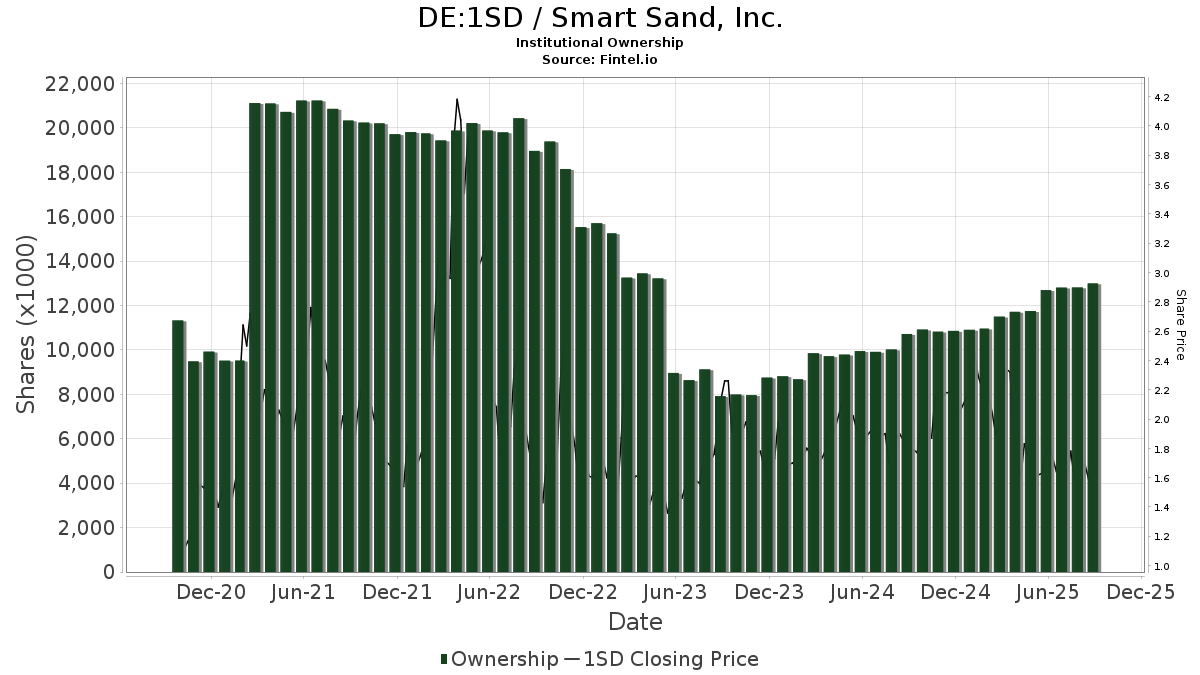
Smart Sand, Inc. (DE:1SD) har 65 institutionelle ejere og aktionærer, der har indsendt 13D/G- eller 13F-formularer til Securities Exchange Commission (SEC). Disse institutioner har i alt 13,996,521 aktier. Største aktionærer omfatter Gendell Jeffrey L, Vanguard Group Inc, Acadian Asset Management Llc, Sprott Inc., Dimensional Fund Advisors Lp, Bridgeway Capital Management Inc, Arrowstreet Capital, Limited Partnership, Jb Capital Partners Lp, CastleKnight Management LP, and Geode Capital Management, Llc .
Smart Sand, Inc. (DB:1SD) institutionel ejerskabsstruktur viser aktuelle positioner i virksomheden efter institutioner og fonde, samt seneste ændringer i positionsstørrelse. Større aktionærer kan omfatte individuelle investorer, investeringsforeninger, hedgefonde eller institutioner. Skema 13D angiver, at investoren besidder (eller besidder) mere end 5 % af virksomheden og har til hensigt (eller har til hensigt at) aktivt at forfølge en ændring i forretningsstrategi. Skema 13G indikerer en passiv investering på over 5%.
The share price as of April 13, 2026 is 4,28 / share. Previously, on April 15, 2025, the share price was 1,79 / share. This represents an increase of 139,11% over that period.
Fondens stemningsscore
Fund Sentiment Score (fka Ownership Accumulation Score) finder de aktier, der bliver mest købt af fonde. Det er resultatet af en sofistikeret, multi-faktor kvantitativ model, der identificerer virksomheder med de højeste niveauer af institutionel akkumulering. Scoringsmodellen bruger en kombination af den samlede stigning i oplyste ejere, ændringerne i porteføljeallokeringer i disse ejere og andre målinger. Tallet går fra 0 til 100, hvor højere tal indikerer et højere niveau af akkumulering for sine jævnaldrende, og 50 er gennemsnittet.
Opdateringsfrekvens: Dagligt
Se Ownership Explorer, som giver en liste over højest rangerende virksomheder.
AI+ Ask Fintel’s AI assistant about Smart Sand, Inc..
Select a question to share a public post with an AI-crafted answer.
Thinking of good questions…
13F og NPORT arkivering
Detaljer om 13F-arkivering er gratis. Detaljer om NP-ansøgninger kræver et premium-medlemskab. Grønne rækker angiver nye positioner. Røde rækker angiver lukkede positioner. Klik på linket ikon for at se den fulde transaktionshistorik.
Opgrader
for at låse premium-data op og eksportere til Excel ![]() .
.
| Fil dato | Kilde | Investor | Type | Gennemsnitlig pris (Øst) |
Aktier | Δ Aktier (%) |
Rapporteret Værdi ($1000) |
Δ Værdi (%) |
Port Alloc (%) |
|
|---|---|---|---|---|---|---|---|---|---|---|
| 2026-02-13 | 13F | Barclays Plc | 0 | -100,00 | 0 | |||||
| 2026-02-13 | 13F | Citigroup Inc | 8.347 | 33 | ||||||
| 2026-02-13 | 13F | Jb Capital Partners Lp | 460.000 | 0,00 | 1.840 | 86,99 | ||||
| 2026-02-17 | 13F | Man Group plc | 0 | -100,00 | 0 | |||||
| 2026-02-13 | 13F | Marshall Wace, Llp | 384.872 | 1.539 | ||||||
| 2026-01-15 | 13F | Highline Wealth Partners Llc | 0 | -100,00 | 0 | |||||
| 2025-11-14 | 13F | Cubist Systematic Strategies, LLC | 0 | -100,00 | 0 | -100,00 | ||||
| 2025-10-23 | 13F | Kingswood Wealth Advisors, Llc | 0 | -100,00 | 0 | |||||
| 2026-02-10 | 13F | Goldman Sachs Group Inc | 175.053 | 555,46 | 700 | 1.128,07 | ||||
| 2026-02-17 | 13F | CastleKnight Management LP | 448.673 | -51,45 | 1.795 | -9,26 | ||||
| 2026-02-13 | 13F | American Century Companies Inc | 28.150 | 113 | ||||||
| 2026-01-13 | 13F | Kathmere Capital Management, LLC | 19.321 | 77 | ||||||
| 2026-02-10 | 13F | Connor, Clark & Lunn Investment Management Ltd. | 46.849 | 187 | ||||||
| 2026-02-12 | 13F | Dimensional Fund Advisors Lp | 635.986 | 2,79 | 2.544 | 92,07 | ||||
| 2026-02-12 | 13F | Sprott Inc. | 750.000 | 0,00 | 3.000 | 86,92 | ||||
| 2026-02-13 | 13F | Stifel Financial Corp | 85.949 | -58,74 | 344 | -22,92 | ||||
| 2026-02-13 | 13F | State Street Corp | 161.597 | 6,74 | 646 | 100,00 | ||||
| 2026-02-13 | 13F | Squarepoint Ops LLC | 14.282 | 57 | ||||||
| 2026-02-12 | 13F | Jane Street Group, Llc | 408.762 | 1.635 | ||||||
| 2026-02-17 | 13F | Northern Trust Corp | 74.028 | 1,68 | 296 | 90,97 | ||||
| 2026-02-04 | 13F | First Eagle Investment Management, LLC | 225.476 | -21,30 | 902 | 46,98 | ||||
| 2026-02-12 | 13F | Jane Street Group, Llc | Call | 23.800 | 95 | |||||
| 2026-02-17 | 13F | Bank Of America Corp /de/ | 133.203 | 56.582,13 | 533 | |||||
| 2026-02-18 | 13F | GWM Advisors LLC | 2.639 | 5,60 | 11 | 100,00 | ||||
| 2026-02-10 | 13F | State of Wyoming | 5.957 | 24 | ||||||
| 2025-11-14 | 13F | Hrt Financial Lp | 0 | -100,00 | 0 | |||||
| 2026-02-13 | 13F | Centiva Capital, LP | 24.389 | 98 | ||||||
| 2026-02-13 | 13F | Sei Investments Co | 186.334 | 355,64 | 745 | 756,32 | ||||
| 2026-02-17 | 13F | XTX Topco Ltd | 23.409 | 94 | ||||||
| 2025-11-13 | 13F | Bnp Paribas Arbitrage, Sa | 0 | -100,00 | 0 | |||||
| 2026-02-11 | 13F | Empowered Funds, LLC | 216.416 | 10,30 | 866 | 106,44 | ||||
| 2026-01-07 | 13F | CWA Asset Management Group, LLC | 77.238 | 309 | ||||||
| 2026-01-29 | 13F | Vanguard Group Inc | 1.355.094 | -2,56 | 5.420 | 82,12 | ||||
| 2025-11-14 | 13F | Raymond James Financial Inc | 0 | -100,00 | 0 | |||||
| 2025-10-20 | 13F | HighMark Wealth Management LLC | 0 | -100,00 | 0 | |||||
| 2026-02-13 | 13F | OMERS ADMINISTRATION Corp | 36.500 | 146 | ||||||
| 2026-02-13 | 13F | Gendell Jeffrey L | 3.126.915 | 15,97 | 12.508 | 116,76 | ||||
| 2026-02-17 | 13F | Balyasny Asset Management Llc | 14.678 | 59 | ||||||
| 2026-02-17 | 13F | Prelude Capital Management, Llc | 39.307 | 224,66 | 157 | 528,00 | ||||
| 2026-02-06 | 13F | Gsa Capital Partners Llp | 100.451 | -13,13 | 0 | |||||
| 2026-02-17 | 13F | Royal Bank Of Canada | 0 | -100,00 | 0 | |||||
| 2026-02-17 | 13F | Algert Global Llc | 45.535 | 0 | ||||||
| 2026-02-11 | 13F | O'shaughnessy Asset Management, Llc | 309.952 | 97,78 | 1.240 | 269,85 | ||||
| 2026-02-17 | 13F | Fmr Llc | 1.448 | -9,27 | 6 | 66,67 | ||||
| 2025-11-14 | 13F | Two Sigma Investments, Lp | 0 | -100,00 | 0 | |||||
| 2026-02-11 | 13F | LPL Financial LLC | 14.900 | 36,70 | 60 | 156,52 | ||||
| 2026-02-13 | 13F | Quartz Partners, LLC | 28.769 | -1,83 | 115 | 85,48 | ||||
| 2026-02-13 | 13F | Truffle Hound Capital, LLC | 220.000 | 880 | ||||||
| 2026-02-03 | 13F | SBI Securities Co., Ltd. | 6 | 0,00 | 0 | |||||
| 2026-02-13 | 13F | Hudson Bay Capital Management LP | 43.304 | 173 | ||||||
| 2026-02-12 | 13F | Renaissance Technologies Llc | 80.800 | -64,95 | 323 | -34,48 | ||||
| 2026-02-11 | 13F | Group One Trading, L.p. | Put | 400 | 2 | |||||
| 2026-02-11 | 13F | Jpmorgan Chase & Co | 2.074 | 8.196,00 | 8 | |||||
| 2026-02-11 | 13F | Group One Trading, L.p. | 6.319 | 25 | ||||||
| 2026-02-13 | 13F | Charles Schwab Investment Management Inc | 17.439 | 0,00 | 70 | 86,49 | ||||
| 2026-02-11 | 13F | Group One Trading, L.p. | Call | 12.500 | 1.288,89 | 50 | 4.900,00 | |||
| 2026-02-17 | 13F | Millennium Management Llc | 33.702 | 135 | ||||||
| 2026-01-23 | 13F | Ritholtz Wealth Management | 207.723 | 156,84 | 831 | 379,77 | ||||
| 2026-02-17 | 13F | Bridgeway Capital Management Inc | 610.034 | 3,43 | 2.440 | 93,34 | ||||
| 2026-02-12 | 13F | BlackRock, Inc. | 431.459 | -9,27 | 1.726 | 69,62 | ||||
| 2026-02-10 | 13F | Acadian Asset Management Llc | 870.866 | -1,00 | 3 | 200,00 | ||||
| 2026-02-12 | 13F | EAM Investors, LLC | 240.141 | 961 | ||||||
| 2026-02-13 | 13F | Walleye Capital LLC | 81.193 | 325 | ||||||
| 2026-02-17 | 13F | Citadel Advisors Llc | 132.540 | 60,44 | 530 | 201,14 | ||||
| 2026-02-17 | 13F | Occudo Quantitative Strategies Lp | 17.755 | 71 | ||||||
| 2026-02-17 | 13F | Citadel Advisors Llc | Call | 64.300 | 16,06 | 257 | 117,80 | |||
| 2026-02-17 | 13F | Verdad Advisers, LP | 100.989 | -59,60 | 404 | -18,09 | ||||
| 2026-02-17 | 13F | Advisor Group Holdings, Inc. | 19.294 | 6.267,66 | 77 | |||||
| 2026-02-17 | 13F | Tower Research Capital LLC (TRC) | 0 | -100,00 | 0 | |||||
| 2026-02-13 | 13F | Arrowstreet Capital, Limited Partnership | 500.806 | 30,28 | 2.003 | 143,67 | ||||
| 2026-02-17 | 13F | Qube Research & Technologies Ltd | 36.719 | 147 | ||||||
| 2026-02-17 | 13F | Two Sigma Securities, Llc | 10.675 | -8,54 | 43 | 75,00 | ||||
| 2026-02-13 | 13F | Prudential Financial Inc | 14.900 | 7,19 | 60 | 103,45 | ||||
| 2026-02-17 | 13F | Jones Financial Companies Lllp | 800 | 0,00 | 3 | 200,00 | ||||
| 2026-02-17 | 13F | Main Street Financial Solutions, LLC | 28.120 | -82,70 | 112 | -67,72 | ||||
| 2026-02-17 | 13F | Point72 Asset Management, L.P. | 47.501 | 190 | ||||||
| 2026-02-09 | 13F | Geode Capital Management, Llc | 434.634 | -2,16 | 1.739 | 83,05 | ||||
| 2026-01-29 | 13F | UBS Group AG | 33.790 | 742,22 | 135 | 1.587,50 | ||||
| 2026-02-13 | 13F | Morgan Stanley | 27.980 | 28,81 | 112 | 141,30 | ||||
| 2026-02-17 | 13F | Susquehanna International Group, Llp | 74.479 | 447,72 | 298 | 924,14 | ||||
| 2026-02-11 | 13F | Simplex Trading, Llc | Call | 20.500 | 118,09 | 82 | ||||
| 2025-11-12 | 13F | Cambridge Investment Research Advisors, Inc. | 0 | -100,00 | 0 | |||||
| 2026-02-17 | 13F | Susquehanna International Group, Llp | Call | 11.400 | -57,93 | 46 | -21,05 | |||
| 2025-10-30 | 13F | Bailard, Inc. | 0 | -100,00 | 0 | |||||
| 2026-02-11 | 13F | Simplex Trading, Llc | Put | 400 | 2 |
Other Listings
| US:SND | 4,76 $ |