Grundlæggende statistik
| Institutionelle aktier (lange) | 25.902.658 - 56,16% (ex 13D/G) - change of -9,87MM shares -27,59% MRQ |
| Institutionel værdi (lang) | $ 326.502 USD ($1000) |
Institutionelt ejerskab og aktionærer
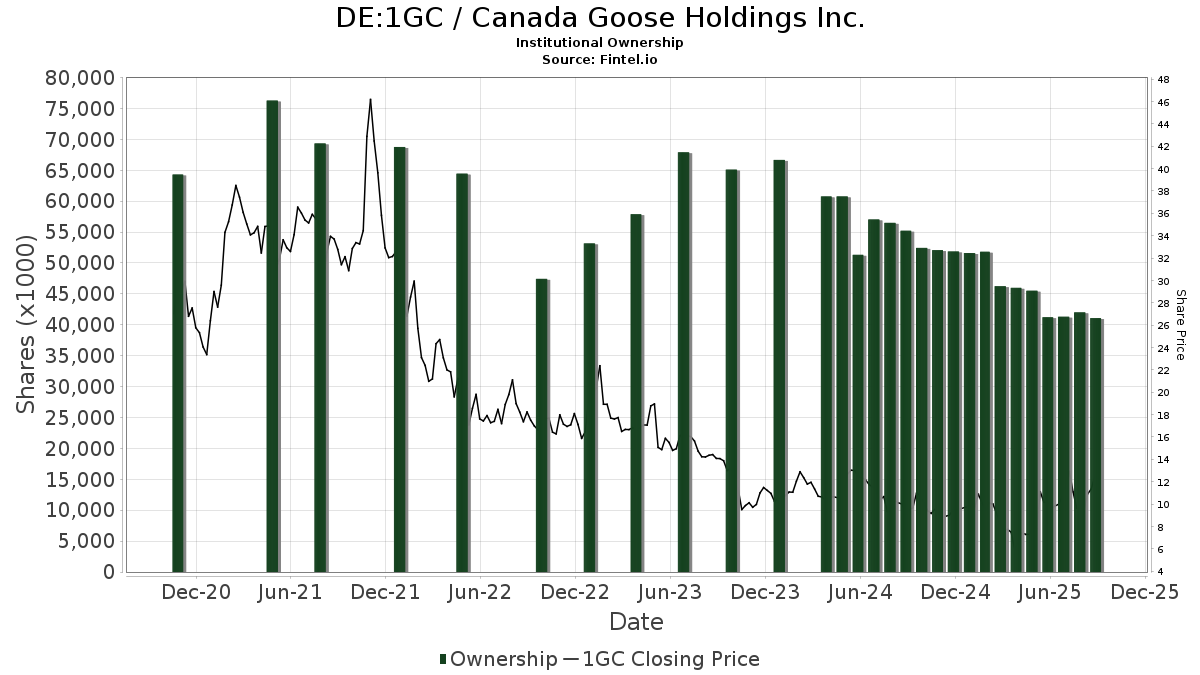
Canada Goose Holdings Inc. (DE:1GC) har 139 institutionelle ejere og aktionærer, der har indsendt 13D/G- eller 13F-formularer til Securities Exchange Commission (SEC). Disse institutioner har i alt 25,902,658 aktier. Største aktionærer omfatter Fmr Llc, Ilex Capital Partners (UK) LLP, Portolan Capital Management, LLC, Timucuan Asset Management Inc/fl, Marshall Wace, Llp, Citadel Advisors Llc, D. E. Shaw & Co., Inc., Kessler Investment Group, LLC, Scopia Capital Management Lp, and Pinnacle Associates Ltd .
Canada Goose Holdings Inc. (DB:1GC) institutionel ejerskabsstruktur viser aktuelle positioner i virksomheden efter institutioner og fonde, samt seneste ændringer i positionsstørrelse. Større aktionærer kan omfatte individuelle investorer, investeringsforeninger, hedgefonde eller institutioner. Skema 13D angiver, at investoren besidder (eller besidder) mere end 5 % af virksomheden og har til hensigt (eller har til hensigt at) aktivt at forfølge en ændring i forretningsstrategi. Skema 13G indikerer en passiv investering på over 5%.
The share price as of March 30, 2026 is 8,97 / share. Previously, on April 1, 2025, the share price was 7,39 / share. This represents an increase of 21,40% over that period.
Fondens stemningsscore
Fund Sentiment Score (fka Ownership Accumulation Score) finder de aktier, der bliver mest købt af fonde. Det er resultatet af en sofistikeret, multi-faktor kvantitativ model, der identificerer virksomheder med de højeste niveauer af institutionel akkumulering. Scoringsmodellen bruger en kombination af den samlede stigning i oplyste ejere, ændringerne i porteføljeallokeringer i disse ejere og andre målinger. Tallet går fra 0 til 100, hvor højere tal indikerer et højere niveau af akkumulering for sine jævnaldrende, og 50 er gennemsnittet.
Opdateringsfrekvens: Dagligt
Se Ownership Explorer, som giver en liste over højest rangerende virksomheder.
AI+ Ask Fintel’s AI assistant about Canada Goose Holdings Inc..
Select a question to share a public post with an AI-crafted answer.
Thinking of good questions…
13F og NPORT arkivering
Detaljer om 13F-arkivering er gratis. Detaljer om NP-ansøgninger kræver et premium-medlemskab. Grønne rækker angiver nye positioner. Røde rækker angiver lukkede positioner. Klik på linket ikon for at se den fulde transaktionshistorik.
Opgrader
for at låse premium-data op og eksportere til Excel ![]() .
.
| Fil dato | Kilde | Investor | Type | Gennemsnitlig pris (Øst) |
Aktier | Δ Aktier (%) |
Rapporteret Værdi ($1000) |
Δ Værdi (%) |
Port Alloc (%) |
|
|---|---|---|---|---|---|---|---|---|---|---|
| 2026-01-12 | 13F | Silverleafe Capital Partners, LLC | 30.000 | 0,00 | 388 | -6,05 | ||||
| 2026-02-06 | 13F | EverSource Wealth Advisors, LLC | 19 | -72,46 | 0 | |||||
| 2026-02-13 | 13F | Mariner, LLC | 12.332 | 160 | ||||||
| 2026-02-17 | 13F | Fund 1 Investments, LLC | 136.416 | -2,56 | 1.767 | -8,50 | ||||
| 2026-02-12 | 13F | Dimensional Fund Advisors Lp | 385.461 | 104,30 | 4.992 | 91,89 | ||||
| 2026-02-12 | 13F | Steward Partners Investment Advisory, Llc | 1.435 | -36,81 | 19 | -41,94 | ||||
| 2026-03-06 | 13F | Hsbc Holdings Plc | 12.527 | -32,29 | 163 | -35,97 | ||||
| 2026-02-11 | 13F | LPL Financial LLC | 105.083 | -9,34 | 1.361 | -14,89 | ||||
| 2026-02-11 | 13F | Spark Investment Management LLC | 16.000 | 207 | ||||||
| 2025-11-14 | 13F | Mount Yale Investment Advisors, LLC | 0 | -100,00 | 0 | -100,00 | ||||
| 2026-01-29 | 13F | UBS Group AG | 138.395 | 108,00 | 1.792 | 95,42 | ||||
| 2026-02-10 | 13F | Quantbot Technologies LP | 87.292 | 18,94 | 1.130 | 11,66 | ||||
| 2026-02-11 | 13F | Fox Run Management, L.l.c. | 42.245 | 547 | ||||||
| 2026-02-13 | 13F | Quarry LP | 0 | -100,00 | 0 | |||||
| 2025-11-13 | 13F | Russell Investments Group, Ltd. | 0 | -100,00 | 0 | -100,00 | ||||
| 2026-02-13 | 13F | Y-Intercept (Hong Kong) Ltd | 57.476 | 744 | ||||||
| 2026-02-10 | 13F | Bnp Paribas Arbitrage, Sa | 169.342 | 7.517,72 | 2.193 | 7.206,67 | ||||
| 2026-02-13 | 13F | Great West Life Assurance Co /can/ | 8.035 | 30,82 | 0 | |||||
| 2026-01-29 | 13F | UBS Group AG | Put | 177.400 | 2.297 | |||||
| 2026-02-05 | 13F | Pinnacle Associates Ltd | 581.879 | 21,17 | 7.535 | 13,79 | ||||
| 2026-01-29 | 13F | UBS Group AG | Call | 1.500 | -53,12 | 19 | -56,82 | |||
| 2026-02-17 | 13F | Tudor Investment Corp Et Al | Call | 0 | -100,00 | 0 | -100,00 | |||
| 2026-02-12 | 13F | Gardner Lewis Asset Management L P | 0 | -100,00 | 0 | |||||
| 2026-02-10 | 13F | Acadian Asset Management Llc | 515.677 | 20,98 | 7 | 20,00 | ||||
| 2026-02-05 | 13F | Bessemer Group Inc | 43.700 | 0,00 | 1 | |||||
| 2026-02-11 | 13F | Group One Trading, L.p. | Put | 6.100 | -8,96 | 79 | -15,22 | |||
| 2026-02-11 | 13F | Group One Trading, L.p. | 12.743 | 165 | ||||||
| 2026-02-11 | 13F | Group One Trading, L.p. | Call | 143.000 | -46,98 | 1.852 | -50,23 | |||
| 2026-02-04 | 13F | Plato Investment Management Ltd | 6.455 | 0,00 | 84 | -4,55 | ||||
| 2026-02-12 | 13F | Nuveen, LLC | 33.662 | 0,00 | 437 | -5,83 | ||||
| 2026-02-17 | 13F | Engineers Gate Manager LP | 29.392 | 189,66 | 381 | 173,38 | ||||
| 2025-11-13 | 13F | Invesco Ltd. | 0 | -100,00 | 0 | -100,00 | ||||
| 2026-02-17 | 13F/A | RBF Capital, LLC | 105.000 | 0,00 | 1.360 | -6,08 | ||||
| 2025-11-14 | 13F | Ameriprise Financial Inc | 0 | -100,00 | 0 | |||||
| 2026-01-30 | 13F | State of New Jersey Common Pension Fund D | 77.202 | 27,45 | 1.000 | 19,64 | ||||
| 2026-02-04 | 13F | Simcoe Capital LLC | 204.544 | 2.649 | ||||||
| 2026-02-03 | 13F | Pier Capital, LLC | 298.459 | -57,09 | 3.865 | -59,70 | ||||
| 2026-02-12 | 13F | Swiss National Bank | 91.300 | 2,24 | 1.186 | -3,58 | ||||
| 2026-02-13 | 13F | SRS Capital Advisors, Inc. | 103 | 1 | ||||||
| 2026-02-12 | 13F | Federation des caisses Desjardins du Quebec | 2.214 | 0,91 | 29 | -3,45 | ||||
| 2026-02-13 | 13F | Smartleaf Asset Management LLC | 110 | 1 | ||||||
| 2026-02-17 | 13F | Balyasny Asset Management Llc | 340.669 | 4.412 | ||||||
| 2026-02-03 | 13F | SBI Securities Co., Ltd. | 738 | 61,14 | 10 | 50,00 | ||||
| 2025-11-13 | 13F | Jump Financial, LLC | 0 | -100,00 | 0 | |||||
| 2026-01-23 | 13F | Ritholtz Wealth Management | 13.139 | 170 | ||||||
| 2026-02-17 | 13F | Susquehanna International Group, Llp | 128.068 | -16,49 | 1.658 | -21,57 | ||||
| 2026-02-17 | 13F | Susquehanna International Group, Llp | Put | 85.500 | -48,52 | 1.107 | -51,66 | |||
| 2026-01-30 | 13F | Us Bancorp \de\ | 6.004 | 0,00 | 78 | -6,10 | ||||
| 2026-02-13 | 13F | JustInvest LLC | 15.459 | 0,32 | 200 | -5,66 | ||||
| 2026-02-17 | 13F | Susquehanna International Group, Llp | Call | 60.800 | -72,86 | 787 | -74,51 | |||
| 2026-02-17 | 13F | Boothbay Fund Management, Llc | 53.956 | 699 | ||||||
| 2026-01-09 | 13F | Pacifica Partners Inc. | 830 | 11 | ||||||
| 2026-02-17 | 13F | Tudor Investment Corp Et Al | 497.679 | 17,95 | 6.445 | 10,76 | ||||
| 2026-02-17 | 13F | Citadel Advisors Llc | 876.427 | 282,86 | 11.350 | 259,60 | ||||
| 2026-02-12 | 13F | Marex Group plc | 0 | -100,00 | 0 | |||||
| 2026-02-17 | 13F | Citadel Advisors Llc | Put | 63.700 | 2,08 | 825 | -4,19 | |||
| 2026-02-12 | 13F | Commonwealth Equity Services, Llc | 27.792 | -6,66 | 360 | |||||
| 2026-02-17 | 13F | Citadel Advisors Llc | Call | 146.600 | -28,31 | 1.898 | -32,70 | |||
| 2026-02-17 | 13F | Royal Bank Of Canada | 259.728 | -30,02 | 3.363 | -34,29 | ||||
| 2025-10-21 | 13F | Golden State Equity Partners | 0 | -100,00 | 0 | |||||
| 2026-03-03 | 13F/A | Caitong International Asset Management Co., Ltd | 106 | 1 | ||||||
| 2026-02-11 | 13F | Manchester Capital Management LLC | 0 | -100,00 | 0 | -100,00 | ||||
| 2026-02-17 | 13F | XTX Topco Ltd | 0 | -100,00 | 0 | |||||
| 2026-02-17 | 13F | Tudor Investment Corp Et Al | Put | 10.900 | -52,81 | 141 | -55,66 | |||
| 2026-02-13 | 13F | Verition Fund Management LLC | 117.460 | -19,24 | 1.521 | -24,14 | ||||
| 2026-02-10 | 13F | Td Asset Management Inc | 63.802 | 6,97 | 828 | 0,85 | ||||
| 2026-02-17 | 13F | SIG North Trading, ULC | Put | 44.600 | 291,23 | 578 | 267,52 | |||
| 2026-02-17 | 13F | SIG North Trading, ULC | Call | 103.900 | -10,12 | 1.346 | -15,62 | |||
| 2026-02-17 | 13F | Millennium Management Llc | 548.919 | 279,76 | 7.109 | 257,24 | ||||
| 2026-02-13 | 13F | Barclays Plc | 9.193 | -72,60 | 119 | -71,67 | ||||
| 2026-02-18 | 13F | Mackenzie Financial Corp | 45.528 | 64,45 | 595 | 55,91 | ||||
| 2026-02-04 | 13F | Versor Investments LP | 0 | -100,00 | 0 | |||||
| 2026-02-09 | 13F | Geode Capital Management, Llc | 30.314 | 2,92 | 392 | -2,97 | ||||
| 2026-01-29 | 13F | IMC-Chicago, LLC | 48.320 | -14,66 | 626 | -19,87 | ||||
| 2026-01-29 | 13F | IMC-Chicago, LLC | Put | 55.400 | -22,95 | 717 | -27,65 | |||
| 2025-11-14 | 13F | Cubist Systematic Strategies, LLC | Call | 15.400 | 212 | |||||
| 2026-02-13 | 13F | Centiva Capital, LP | 22.533 | 0,95 | 292 | -5,21 | ||||
| 2026-02-13 | 13F | Walleye Trading LLC | 6.043 | 78 | ||||||
| 2026-02-12 | 13F | BlackRock, Inc. | 31.105 | -29,08 | 403 | -33,44 | ||||
| 2026-02-10 | 13F | Goldman Sachs Group Inc | 259.123 | -17,69 | 3.356 | -22,71 | ||||
| 2026-02-13 | 13F | Citigroup Inc | 365 | -83,61 | 5 | -86,67 | ||||
| 2026-02-13 | 13F | Walleye Trading LLC | Put | 25.100 | 7,26 | 325 | 0,93 | |||
| 2026-02-13 | 13F | Walleye Trading LLC | Call | 67.900 | 112,19 | 879 | 99,32 | |||
| 2026-02-12 | 13F | Jane Street Group, Llc | 357.386 | 59,09 | 4.628 | 49,43 | ||||
| 2026-02-12 | 13F | Jane Street Group, Llc | Call | 90.700 | -63,55 | 1.175 | -65,77 | |||
| 2026-02-11 | 13F | CLARET ASSET MANAGEMENT Corp | 86.704 | 0,10 | 1 | 0,00 | ||||
| 2025-11-13 | 13F | Quinn Opportunity Partners LLC | 0 | -100,00 | 0 | -100,00 | ||||
| 2025-11-14 | 13F | Qube Research & Technologies Ltd | 0 | -100,00 | 0 | |||||
| 2026-02-11 | 13F | CenterBook Partners LP | 414.129 | 5.363 | ||||||
| 2026-02-11 | 13F | Deutsche Bank Ag\ | 10.656 | -20,23 | 138 | -25,54 | ||||
| 2026-02-06 | 13F | Larson Financial Group LLC | 259 | 1.263,16 | 3 | |||||
| 2025-11-14 | 13F | Lazard Asset Management Llc | 0 | -100,00 | 0 | |||||
| 2026-03-11 | 13F | Leonteq Securities AG | 0 | -100,00 | 0 | |||||
| 2026-02-09 | 13F | Legal & General Group Plc | 37.354 | 17,20 | 485 | 10,50 | ||||
| 2026-02-13 | 13F | Barclays Plc | Put | 250.000 | 0,00 | 3.238 | -6,09 | |||
| 2026-02-13 | 13F | Barclays Plc | Call | 0 | -100,00 | 0 | -100,00 | |||
| 2026-02-17 | 13F | Public Employees Retirement System Of Ohio | 49.618 | -1,51 | 643 | -7,49 | ||||
| 2026-02-11 | 13F | Parallel Advisors, LLC | 100 | 1 | ||||||
| 2026-02-12 | 13F | Renaissance Technologies Llc | 0 | -100,00 | 0 | |||||
| 2026-02-17 | 13F | Trexquant Investment LP | 90.498 | -58,55 | 1.172 | -61,11 | ||||
| 2026-02-10 | 13F | Hazlett, Burt & Watson, Inc. | 300 | 0,00 | 0 | |||||
| 2026-02-14 | 13F | Rockefeller Capital Management L.P. | 30 | 0,00 | 0 | |||||
| 2025-11-14 | 13F | Strategic Wealth Partners, Ltd. | 595 | 0,00 | 8 | 33,33 | ||||
| 2025-11-14 | 13F | Wolverine Trading, Llc | Call | 217.500 | 10,18 | 2.991 | 33,01 | |||
| 2025-11-14 | 13F | Wolverine Trading, Llc | Put | 63.400 | 3,09 | 872 | 24,43 | |||
| 2026-02-13 | 13F | Landscape Capital Management, L.l.c. | 0 | -100,00 | 0 | |||||
| 2026-02-06 | 13F | Legato Capital Management LLC | 0 | -100,00 | 0 | |||||
| 2025-11-12 | 13F | Headwater Capital Co Ltd | 0 | -100,00 | 0 | |||||
| 2026-01-27 | 13F | Zurcher Kantonalbank (Zurich Cantonalbank) | 19.744 | 0,00 | 256 | -5,54 | ||||
| 2026-02-12 | 13F | Perseverance Asset Management International | 0 | -100,00 | 0 | |||||
| 2026-02-13 | 13F | Squarepoint Ops LLC | 12.433 | 161 | ||||||
| 2026-02-13 | 13F | National Bank Of Canada /fi/ | 20.024 | -8,25 | 259 | -11,00 | ||||
| 2025-11-14 | 13F | Wolverine Trading, Llc | 30.481 | -60,13 | 419 | -51,84 | ||||
| 2025-11-12 | 13F | Aviso Financial Inc. | 0 | -100,00 | 0 | -100,00 | ||||
| 2026-02-17 | 13F | Two Sigma Securities, Llc | 12.115 | 157 | ||||||
| 2026-01-06 | 13F | Investors Research Corp | 251 | 0,00 | 3 | 0,00 | ||||
| 2026-02-17 | 13F | Advisory Services Network, LLC | 0 | -100,00 | 0 | |||||
| 2026-02-06 | 13F | Global Retirement Partners, LLC | 458 | -9,84 | 6 | -28,57 | ||||
| 2026-02-24 | 13F | DGS Capital Management, LLC | 24.933 | 38,66 | 323 | 30,36 | ||||
| 2026-02-09 | 13F | Huntington National Bank | 1 | 0,00 | 0 | |||||
| 2026-02-12 | 13F | Bank Of Montreal /can/ | 21.685 | 2,13 | 281 | -3,77 | ||||
| 2026-01-29 | 13F | IMC-Chicago, LLC | Call | 0 | -100,00 | 0 | -100,00 | |||
| 2025-11-14 | 13F | Interval Partners, LP | 0 | -100,00 | 0 | |||||
| 2026-01-30 | 13F | Ares Financial Consulting, LLC | 13 | 0 | ||||||
| 2026-01-27 | 13F | TD Waterhouse Canada Inc. | 29.284 | -3,96 | 379 | -11,48 | ||||
| 2026-02-17 | 13F | Wellington Management Group Llp | 455.065 | -1,05 | 5.906 | -6,74 | ||||
| 2026-02-17 | 13F | Nomura Holdings Inc | 14.389 | 7,07 | 186 | 0,54 | ||||
| 2026-02-17 | 13F | Nomura Holdings Inc | Put | 160.000 | 0,00 | 2.072 | -6,07 | |||
| 2026-02-17 | 13F | Advisor Group Holdings, Inc. | 6.048 | -7,31 | 78 | -11,36 | ||||
| 2025-11-07 | 13F | Fifth Third Bancorp | 0 | -100,00 | 0 | |||||
| 2026-01-09 | 13F | SG Americas Securities, LLC | 18.045 | 0 | ||||||
| 2026-02-17 | 13F | Optiver Holding B.V. | 6 | 0 | ||||||
| 2026-02-13 | 13F | Arrowstreet Capital, Limited Partnership | 0 | -100,00 | 0 | |||||
| 2026-02-17 | 13F | Raymond James Financial Inc | 282.822 | -22,42 | 3.663 | -27,15 | ||||
| 2026-02-11 | 13F | Winton Capital Group Ltd | 0 | -100,00 | 0 | -100,00 | ||||
| 2026-02-17 | 13F | Point72 Asset Management, L.P. | Call | 15.400 | 199 | |||||
| 2026-02-17 | 13F | Point72 Asset Management, L.P. | 338.184 | 4.379 | ||||||
| 2026-01-26 | 13F | Great Hill Capital LLC | Call | 1.000 | 0,00 | 10 | -23,08 | |||
| 2026-01-26 | 13F | Great Hill Capital LLC | 80.536 | -2,55 | 1.043 | -8,52 | ||||
| 2026-02-13 | 13F | Marshall Wace, Llp | 1.540.714 | 19.952 | ||||||
| 2026-02-23 | 13F | Virtu Financial LLC | 19.172 | 0 | ||||||
| 2026-02-13 | 13F | American Century Companies Inc | 56.876 | 73,22 | 737 | 63,05 | ||||
| 2026-02-17 | 13F | Bank Of America Corp /de/ | 556.561 | -26,26 | 7.207 | -30,75 | ||||
| 2026-02-13 | 13F | Morgan Stanley | 134.334 | -96,72 | 1.740 | -96,92 | ||||
| 2026-02-10 | 13F | Envestnet Asset Management Inc | 24.476 | 1,17 | 317 | -5,11 | ||||
| 2026-02-13 | 13F | Timucuan Asset Management Inc/fl | 1.937.925 | 0,00 | 25.096 | -6,09 | ||||
| 2026-02-12 | 13F | Jane Street Group, Llc | Put | 0 | -100,00 | 0 | -100,00 | |||
| 2026-02-13 | 13F | Manufacturers Life Insurance Company, The | 0 | -100,00 | 0 | |||||
| 2026-02-17 | 13F | Royal Bank Of Canada | Put | 0 | -100,00 | 0 | ||||
| 2025-11-14 | 13F | ExodusPoint Capital Management, LP | 139.108 | 1.918 | ||||||
| 2026-02-17 | 13F | D. E. Shaw & Co., Inc. | 851.468 | 104,05 | 11.031 | 91,89 | ||||
| 2026-02-17 | 13F | D. E. Shaw & Co., Inc. | Put | 202.700 | -49,66 | 2.628 | -52,64 | |||
| 2026-02-17 | 13F | Two Sigma Advisers, Lp | 59.200 | -30,02 | 767 | -34,31 | ||||
| 2026-02-17 | 13F | D. E. Shaw & Co., Inc. | Call | 233.400 | 0,00 | 3.023 | -6,09 | |||
| 2026-02-13 | 13F | Police & Firemen's Retirement System of New Jersey | 16.221 | 0,00 | 211 | -5,83 | ||||
| 2026-02-17 | 13F | Two Sigma Investments, Lp | 315.605 | 0,94 | 4.087 | -5,20 | ||||
| 2026-02-09 | 13F | Lisanti Capital Growth, LLC | 0 | -100,00 | 0 | |||||
| 2026-02-10 | 13F | SCP Investment, LP | 350.000 | 0,00 | 4.532 | -6,09 | ||||
| 2026-02-17 | 13F | Scopia Capital Management Lp | 666.595 | 8.632 | ||||||
| 2026-02-17 | 13F | Portolan Capital Management, LLC | 2.138.904 | -1,61 | 27.699 | -7,61 | ||||
| 2026-02-12 | 13F | Hrt Financial Lp | 11.337 | 0 | ||||||
| 2026-01-14 | 13F | True Vision MN LLC | 51.678 | 146,20 | 669 | 131,49 | ||||
| 2025-11-13 | 13F | Scheer, Rowlett & Associates Investment Management Ltd. | 0 | -100,00 | 0 | -100,00 | ||||
| 2026-02-03 | 13F | Kessler Investment Group, LLC | 678.892 | 126,77 | 8.792 | 112,96 | ||||
| 2026-02-10 | 13F | CIBC World Markets Inc. | 75.783 | 323,39 | 982 | 299,19 | ||||
| 2026-02-13 | 13F | Walleye Capital LLC | 9.256 | -61,55 | 120 | -64,05 | ||||
| 2026-01-27 | 13F | Evergreen Capital Management Llc | 11.320 | 147 | ||||||
| 2026-02-10 | 13F | State of Wyoming | 37.288 | -32,95 | 483 | -36,95 | ||||
| 2026-01-23 | 13F | Farther Finance Advisors, LLC | 350 | 0,00 | 5 | 0,00 | ||||
| 2025-11-14 | 13F | Gotham Asset Management, LLC | 0 | -100,00 | 0 | -100,00 | ||||
| 2026-02-17 | 13F | Crawford Fund Management, LLC | Call | 30.000 | -47,83 | 388 | -51,01 | |||
| 2026-02-13 | 13F | Pathstone Holdings, LLC | 60.533 | 403,02 | 784 | 374,55 | ||||
| 2025-11-07 | 13F | Shell Asset Management Co | 801 | -70,95 | 0 | |||||
| 2026-02-13 | 13F | Walleye Capital LLC | Call | 68.100 | 251,03 | 882 | 229,96 | |||
| 2026-02-13 | 13F | Walleye Capital LLC | Put | 14.800 | -66,67 | 192 | -68,79 | |||
| 2026-02-13 | 13F | Rhumbline Advisers | 50 | 0,00 | 1 | |||||
| 2026-02-17 | 13F | Schonfeld Strategic Advisors LLC | 46.621 | 604 | ||||||
| 2025-11-14 | 13F | Graham Capital Management, L.P. | 0 | -100,00 | 0 | -100,00 | ||||
| 2026-02-13 | 13F | Alerus Financial Na | 320 | 0,00 | 4 | 0,00 | ||||
| 2026-01-29 | 13F | Vanguard Group Inc | 34.172 | 0,00 | 443 | -5,96 | ||||
| 2026-02-17 | 13F | Fmr Llc | 4.063.999 | -0,52 | 52.675 | -6,34 | ||||
| 2026-02-17 | 13F | Fairscale Capital, LLC | 0 | -100,00 | 0 | |||||
| 2026-02-13 | 13F | Wells Fargo & Company/mn | 288.270 | -15,20 | 3.733 | -20,35 | ||||
| 2026-02-17 | 13F | Caption Management, LLC | Call | 0 | -100,00 | 0 | ||||
| 2026-02-17 | 13F | New Vernon Capital Holdings II LLC | 4.367 | 0,00 | 78 | 28,33 | ||||
| 2026-02-17 | 13F | GAM Holding AG | 0 | -100,00 | 0 | |||||
| 2026-02-13 | 13F | Stifel Financial Corp | 10.671 | 138 | ||||||
| 2026-02-09 | 13F | Harbour Investments, Inc. | 86 | 1 | ||||||
| 2026-01-26 | 13F | Cwm, Llc | 133 | 40,00 | 0 | |||||
| 2026-02-17 | 13F | Ilex Capital Partners (UK) LLP | 2.501.177 | 218,72 | 32.390 | 199,33 | ||||
| 2026-02-11 | 13F | Jpmorgan Chase & Co | 148 | 2 | ||||||
| 2025-10-30 | 13F | Patient Capital Management, LLC | 0 | -100,00 | 0 | -100,00 | ||||
| 2026-02-17 | 13F | Lighthouse Investment Partners, LLC | 35.255 | 457 | ||||||
| 2026-01-27 | 13F | WealthCollab, LLC | 411 | 0,00 | 5 | 0,00 | ||||
| 2026-02-11 | 13F | O'shaughnessy Asset Management, Llc | 20.766 | 269 | ||||||
| 2026-02-06 | 13F | IFP Advisors, Inc | 166 | 2 | ||||||
| 2026-02-04 | 13F | Clark Wealth Partners | 0 | -100,00 | 0 | |||||
| 2025-11-14 | 13F | Ubs Asset Management Americas Inc | 0 | -100,00 | 0 | -100,00 | ||||
| 2026-02-13 | 13F | Charles Schwab Investment Management Inc | 74.436 | 26,59 | 966 | 19,41 | ||||
| 2026-02-11 | 13F | Simplex Trading, Llc | Call | 26.500 | -57,87 | 343 | ||||
| 2026-02-11 | 13F | Simplex Trading, Llc | Put | 15.000 | -25,00 | 194 | ||||
| 2026-02-11 | 13F | Simplex Trading, Llc | 26.864 | -34,43 | 348 | |||||
| 2026-02-18 | 13F | State of Tennessee, Treasury Department | 15.972 | 194 | ||||||
| 2026-02-17 | 13F | PenderFund Capital Management Ltd. | 3.300 | 0,00 | 43 | -6,67 | ||||
| 2026-02-10 | 13F/A | Northwestern Mutual Wealth Management Co | 166 | -28,45 | 2 | -33,33 | ||||
| 2026-02-17 | 13F | Tower Research Capital LLC (TRC) | 5.417 | 146,23 | 70 | 133,33 | ||||
| 2026-02-06 | 13F | Pnc Financial Services Group, Inc. | 147 | -60,48 | 2 | -80,00 | ||||
| 2025-11-21 | 13F/A | Royal Bank Of Canada | Call | 0 | -100,00 | 0 | -100,00 | |||
| 2026-03-12 | 13F/A | Peak6 Llc | Put | 472.800 | -12,15 | 6.123 | -17,50 | |||
| 2026-03-12 | 13F/A | Peak6 Llc | Call | 43.200 | -62,34 | 559 | -64,64 | |||
| 2025-11-14 | 13F | Bayesian Capital Management, LP | 0 | -100,00 | 0 | -100,00 | ||||
| 2026-03-12 | 13F/A | Peak6 Llc | 3.403 | -92,92 | 44 | -93,35 |