Grundlæggende statistik
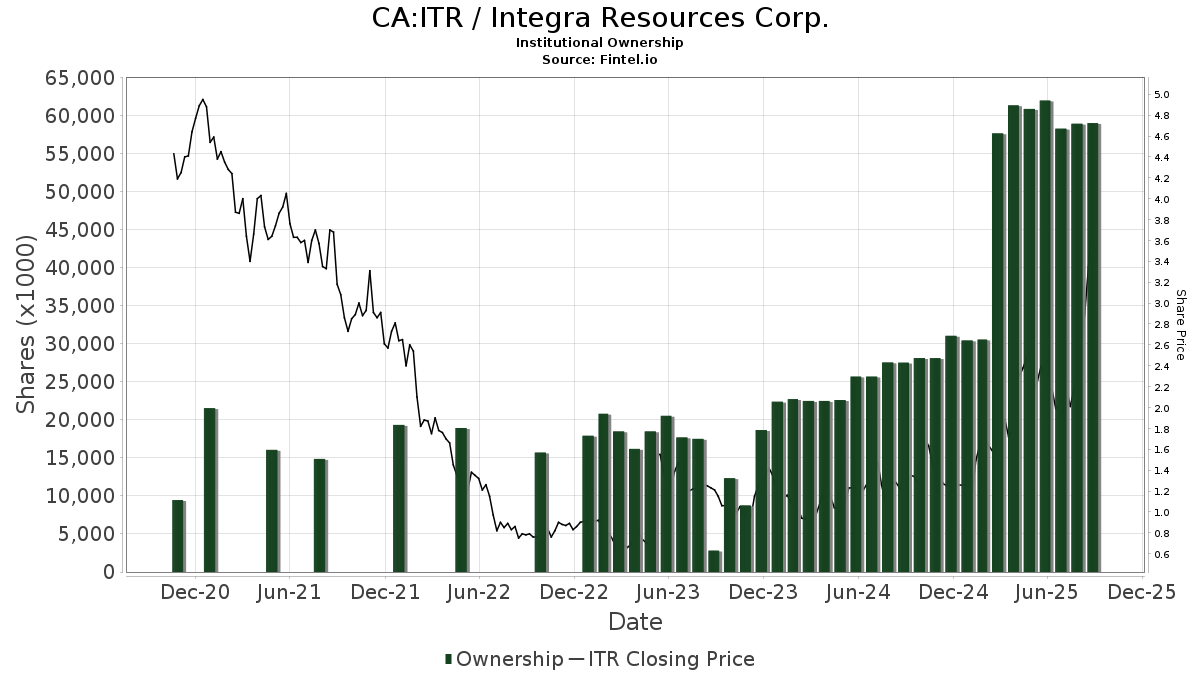
| Institutionelle aktier (lange) | 60.745.154 - 30,15% (ex 13D/G) - change of 1,95MM shares 3,32% MRQ |
| Institutionel værdi (lang) | $ 218.073 USD ($1000) |
Institutionelt ejerskab og aktionærer
Integra Resources Corp. (CA:ITR) har 87 institutionelle ejere og aktionærer, der har indsendt 13D/G- eller 13F-formularer til Securities Exchange Commission (SEC). Disse institutioner har i alt 60,745,154 aktier. Største aktionærer omfatter Franklin Resources Inc, MIRAE ASSET GLOBAL ETFS HOLDINGS Ltd., Mason Hill Advisors Llc, SIL - Global X Silver Miners ETF, ASA Gold & Precious Metals Ltd, Ruffer LLP, Merk Investments LLC, Morgan Stanley, Millennium Management Llc, and Walleye Capital LLC .
Integra Resources Corp. (TSXV:ITR) institutionel ejerskabsstruktur viser aktuelle positioner i virksomheden efter institutioner og fonde, samt seneste ændringer i positionsstørrelse. Større aktionærer kan omfatte individuelle investorer, investeringsforeninger, hedgefonde eller institutioner. Skema 13D angiver, at investoren besidder (eller besidder) mere end 5 % af virksomheden og har til hensigt (eller har til hensigt at) aktivt at forfølge en ændring i forretningsstrategi. Skema 13G indikerer en passiv investering på over 5%.
The share price as of March 12, 2026 is 4,70 / share. Previously, on March 13, 2025, the share price was 1,80 / share. This represents an increase of 161,11% over that period.
Fondens stemningsscore
Fund Sentiment Score (fka Ownership Accumulation Score) finder de aktier, der bliver mest købt af fonde. Det er resultatet af en sofistikeret, multi-faktor kvantitativ model, der identificerer virksomheder med de højeste niveauer af institutionel akkumulering. Scoringsmodellen bruger en kombination af den samlede stigning i oplyste ejere, ændringerne i porteføljeallokeringer i disse ejere og andre målinger. Tallet går fra 0 til 100, hvor højere tal indikerer et højere niveau af akkumulering for sine jævnaldrende, og 50 er gennemsnittet.
Opdateringsfrekvens: Dagligt
Se Ownership Explorer, som giver en liste over højest rangerende virksomheder.
AI+ Ask Fintel’s AI assistant about Integra Resources Corp..
Select a question to share a public post with an AI-crafted answer.
Thinking of good questions…
13F og NPORT arkivering
Detaljer om 13F-arkivering er gratis. Detaljer om NP-ansøgninger kræver et premium-medlemskab. Grønne rækker angiver nye positioner. Røde rækker angiver lukkede positioner. Klik på linket ikon for at se den fulde transaktionshistorik.
Opgrader
for at låse premium-data op og eksportere til Excel ![]() .
.
| Fil dato | Kilde | Investor | Type | Gennemsnitlig pris (Øst) |
Aktier | Δ Aktier (%) |
Rapporteret Værdi ($1000) |
Δ Værdi (%) |
Port Alloc (%) |
|
|---|---|---|---|---|---|---|---|---|---|---|
| 2026-02-13 | 13F | National Bank Of Canada /fi/ | 305.220 | 1.208 | ||||||
| 2026-02-03 | 13F | Credit Industriel Et Commercial | 159.842 | 0,00 | 644 | 38,20 | ||||
| 2026-02-17 | 13F | Advisory Services Network, LLC | 0 | -100,00 | 0 | |||||
| 2026-01-26 | 13F | PFG Investments, LLC | 12.087 | 3,25 | 48 | 41,18 | ||||
| 2026-02-17 | 13F | Boothbay Fund Management, Llc | 11.976 | -53,35 | 48 | -36,00 | ||||
| 2025-11-19 | 13F/A | Danske Bank A/s | 0 | 0 | ||||||
| 2026-02-17 | 13F | Toronto Dominion Bank | 11.983 | -34,23 | 48 | -9,43 | ||||
| 2026-02-12 | 13F | Federation des caisses Desjardins du Quebec | 4.415 | 209,82 | 18 | 325,00 | ||||
| 2026-02-11 | 13F | LPL Financial LLC | 23.700 | 75,61 | 95 | 143,59 | ||||
| 2026-01-07 | 13F | Aventura Private Wealth, LLC | 347 | 1 | ||||||
| 2026-02-17 | 13F | Citadel Advisors Llc | 416.352 | -45,29 | 1.670 | -25,62 | ||||
| 2026-02-17 | 13F | Raymond James Financial Inc | 28.668 | -33,09 | 115 | -9,52 | ||||
| 2026-02-10 | 13F | CIBC World Markets Inc. | 104.535 | 42,45 | 420 | 96,26 | ||||
| 2026-02-18 | 13F | GWM Advisors LLC | 5.245 | -87,44 | 21 | -82,93 | ||||
| 2025-09-23 | NP | FKRCX - Franklin Gold & Precious Metals Fund Class A | 740.000 | 0,00 | 1.066 | -14,80 | ||||
| 2026-02-17 | 13F | Two Sigma Securities, Llc | 24.615 | 99 | ||||||
| 2026-02-13 | 13F | Merk Investments LLC | 2.562.526 | -35,94 | 10.276 | -12,89 | ||||
| 2026-02-12 | 13F | Renaissance Technologies Llc | 540.700 | -46,31 | 2.168 | -27,00 | ||||
| 2026-02-17 | 13F | DZ BANK AG Deutsche Zentral Genossenschafts Bank, Frankfurt am Main | 0 | -100,00 | 0 | |||||
| 2026-02-17 | 13F | Quadrature Capital Ltd | 13.040 | -75,03 | 52 | -66,23 | ||||
| 2026-02-12 | 13F | StoneX Group Inc. | 15.965 | 39,43 | 64 | 93,94 | ||||
| 2026-02-17 | 13F | Aquatic Capital Management LLC | 27.999 | 112 | ||||||
| 2025-11-12 | 13F | Harbour Investments, Inc. | 0 | -100,00 | 0 | |||||
| 2025-11-06 | 13F | Baader Bank INC | 0 | -100,00 | 0 | -100,00 | ||||
| 2026-02-03 | 13F | Navellier & Associates Inc | 203.738 | 817 | ||||||
| 2025-11-05 | 13F | SOUTH STATE Corp | 0 | -100,00 | 0 | |||||
| 2026-01-29 | 13F | Huntleigh Advisors, Inc. | 16.000 | -61,90 | 64 | -47,97 | ||||
| 2026-01-28 | 13F | Ruffer LLP | 3.006.453 | -4,75 | 12.126 | 31,66 | ||||
| 2026-02-17 | 13F | Qube Research & Technologies Ltd | 29.748 | -32,37 | 119 | -7,75 | ||||
| 2026-02-17 | 13F | Man Group plc | 168.786 | -12,16 | 677 | 19,43 | ||||
| 2026-02-10 | 13F | Acadian Asset Management Llc | 1.166.980 | 48,25 | 5 | 100,00 | ||||
| 2026-01-09 | 13F | SG Americas Securities, LLC | 0 | -100,00 | 0 | |||||
| 2026-02-12 | 13F | Jane Street Group, Llc | 171.694 | 5,35 | 688 | 43,33 | ||||
| 2026-02-12 | 13F | Mindset Wealth Management, Llc | 12.340 | 49 | ||||||
| 2026-02-12 | 13F | Bank Of Montreal /can/ | 244.381 | 51,84 | 983 | 109,38 | ||||
| 2025-11-14 | 13F | Cubist Systematic Strategies, LLC | 96.280 | 18,92 | 282 | 132,23 | ||||
| 2026-01-08 | 13F | Wealth Enhancement Advisory Services, Llc | 12.933 | 0,15 | 53 | 26,83 | ||||
| 2025-10-31 | 13F | GHP Investment Advisors, Inc. | 0 | -100,00 | 0 | |||||
| 2025-09-30 | NP | ASA Gold & Precious Metals Ltd | 3.937.472 | 0,00 | 9.017 | 41,36 | ||||
| 2025-11-14 | 13F | Gmt Capital Corp | 0 | -100,00 | 0 | -100,00 | ||||
| 2026-02-12 | 13F | Sprott Inc. | 504.016 | -17,57 | 2.021 | 12,09 | ||||
| 2026-02-17 | 13F | Weiss Asset Management LP | 292.223 | 0,00 | 1.172 | 35,85 | ||||
| 2026-02-17 | 13F | Russell Investments Group, Ltd. | 52.304 | 47,73 | 210 | 100,96 | ||||
| 2025-11-14 | 13F | Wexford Capital Lp | 0 | -100,00 | 0 | |||||
| 2026-01-26 | 13F | Cwm, Llc | 25 | 0 | ||||||
| 2026-02-10 | 13F | Goldman Sachs Group Inc | 318.358 | 27,07 | 1.277 | 72,67 | ||||
| 2026-02-17 | 13F | Parvin Asset Management, LLC | 1.700 | 0,00 | 7 | 20,00 | ||||
| 2026-02-13 | 13F | Stifel Financial Corp | 559.417 | -51,11 | 2.243 | -33,54 | ||||
| 2026-02-12 | 13F | Hohimer Wealth Management, Llc | 10.000 | 40 | ||||||
| 2026-02-17 | 13F | Advisor Group Holdings, Inc. | 0 | -100,00 | 0 | |||||
| 2026-02-06 | 13F/A | Rathbone Brothers plc | 33.625 | -26,74 | 136 | 0,75 | ||||
| 2026-01-29 | 13F | KC Investment Advisors, LLC | 13.645 | 55 | ||||||
| 2026-02-05 | 13F | Cambridge Investment Research Advisors, Inc. | 287.630 | -21,58 | 1 | 0,00 | ||||
| 2026-02-13 | 13F | MAI Capital Management | 256 | 0,00 | 1 | |||||
| 2026-02-17 | 13F | Tower Research Capital LLC (TRC) | 7.457 | 30 | ||||||
| 2026-02-13 | 13F | Walleye Capital LLC | 1.736.438 | 15,89 | 6.963 | 57,53 | ||||
| 2026-01-22 | 13F | Financial Consulate, Inc | 1.000 | 4 | ||||||
| 2026-02-17 | 13F | Cetera Investment Advisers | 11.567 | 46 | ||||||
| 2026-02-13 | 13F | Citigroup Inc | 1 | 0,00 | 0 | |||||
| 2026-02-04 | 13F | Independent Advisor Alliance | 10.000 | 40 | ||||||
| 2025-11-13 | 13F | Tradition Wealth Management, LLC | 0 | -100,00 | 0 | |||||
| 2026-02-13 | 13F | Wells Fargo & Company/mn | 9.900 | 12,50 | 40 | 56,00 | ||||
| 2026-01-28 | 13F | CAPROCK Group, Inc. | 15.100 | 61 | ||||||
| 2026-02-13 | 13F | OMERS ADMINISTRATION Corp | 0 | -100,00 | 0 | |||||
| 2026-01-21 | 13F | Prime Capital Investment Advisors, LLC | 19.748 | 0,00 | 79 | 36,21 | ||||
| 2026-02-23 | 13F | Virtu Financial LLC | 82.023 | 157,21 | 0 | |||||
| 2026-02-10 | 13F | Close Asset Management Ltd | 6.800 | 0,00 | 0 | |||||
| 2026-01-14 | 13F | Tradewinds Capital Management, LLC | 5 | 0,00 | 0 | |||||
| 2026-02-17 | 13F | SageView Advisory Group, LLC | 21 | 0 | ||||||
| 2026-02-17 | 13F | Jump Financial, LLC | 205.051 | 822 | ||||||
| 2026-02-03 | 13F | Anfield Capital Management, LLC | 92 | 0,00 | 0 | |||||
| 2026-01-28 | 13F | U S Global Investors Inc | 1.386.127 | 824,08 | 5.558 | 1.157,47 | ||||
| 2026-02-17 | 13F | Corsair Capital Management, L.p. | 475.000 | 1.905 | ||||||
| 2026-02-12 | 13F | BlackRock, Inc. | 681.702 | 6.708,85 | 2.734 | 9.324,14 | ||||
| 2026-02-05 | 13F | Allworth Financial LP | 0 | -100,00 | 0 | |||||
| 2026-02-17 | 13F | MIRAE ASSET GLOBAL ETFS HOLDINGS Ltd. | 7.716.259 | 17,30 | 31.073 | 61,89 | ||||
| 2026-02-11 | 13F | Franklin Resources Inc | 11.525.543 | -2,29 | 46.330 | 34,48 | ||||
| 2025-09-29 | NP | SIL - Global X Silver Miners ETF This fund is a listed as child fund of Mirae Asset Global Investments Co., Ltd. and if that institution has disclosed ownership in this security, then these positions will not be double counted when calculating total shares and total value | 4.375.766 | 452,44 | 6.615 | 168,32 | ||||
| 2026-02-17 | 13F | Two Sigma Advisers, Lp | 304.500 | 55,67 | 1.221 | 111,61 | ||||
| 2026-02-17 | 13F | Two Sigma Investments, Lp | 1.501.540 | 60,01 | 6.021 | 117,52 | ||||
| 2026-02-17 | 13F | Medici Capital Llc | 907.875 | 643,55 | 3.656 | 926,97 | ||||
| 2026-02-17 | 13F | Royal Bank Of Canada | 15.988 | -44,96 | 64 | -25,58 | ||||
| 2026-02-13 | 13F | Manufacturers Life Insurance Company, The | 0 | -100,00 | 0 | |||||
| 2025-11-07 | 13F | Jpmorgan Chase & Co | 0 | -100,00 | 0 | |||||
| 2026-02-12 | 13F | Groupe la Francaise | 0 | -100,00 | 0 | |||||
| 2026-02-17 | 13F | Bank Of America Corp /de/ | 1.222.117 | -67,89 | 4.901 | -56,36 | ||||
| 2026-02-12 | 13F | Northwest & Ethical Investments L.P. | 242.442 | -0,80 | 975 | 36,75 | ||||
| 2026-01-16 | 13F | FNY Investment Advisers, LLC | 0 | -100,00 | 0 | |||||
| 2026-01-22 | 13F | Apollon Wealth Management, LLC | 10.732 | -11,61 | 43 | 22,86 | ||||
| 2026-01-27 | 13F | TD Waterhouse Canada Inc. | 143 | 1 | ||||||
| 2026-02-13 | 13F | Arrowstreet Capital, Limited Partnership | 1.042.761 | 3.808,55 | 4.191 | 5.341,56 | ||||
| 2026-02-02 | 13F | Chung Wu Investment Group, LLC | 1.000 | 4 | ||||||
| 2026-02-17 | 13F | XTX Topco Ltd | 267.825 | 35,20 | 1.074 | 83,73 | ||||
| 2026-02-13 | 13F | State Street Corp | 92.190 | -1,51 | 370 | 33,70 | ||||
| 2026-02-13 | 13F | Hurley Capital, LLC | 0 | -100,00 | 0 | |||||
| 2026-02-13 | 13F | Morgan Stanley | 1.994.832 | 47,83 | 7.999 | 100,98 | ||||
| 2025-10-22 | 13F | Commonwealth Equity Services, Llc | 0 | -100,00 | 0 | |||||
| 2026-02-17 | 13F | Susquehanna International Group, Llp | 69.203 | 239,41 | 278 | 361,67 | ||||
| 2026-02-17 | 13F | Mason Hill Advisors Llc | 5.891.437 | -6,11 | 23.695 | 29,45 | ||||
| 2026-01-09 | 13F | Pacifica Partners Inc. | 480 | 0,00 | 2 | 0,00 | ||||
| 2026-01-15 | 13F | Brookstone Capital Management | 10.100 | 41 | ||||||
| 2026-01-29 | 13F | UBS Group AG | 608.482 | 315,98 | 2.440 | 466,13 | ||||
| 2026-02-17 | 13F | Millennium Management Llc | 1.954.804 | 175,73 | 7.850 | 276,99 | ||||
| 2026-02-13 | 13F | Virtus ETF Advisers LLC | 60.700 | 0,00 | 243 | 35,75 | ||||
| 2026-02-13 | 13F | Caitong International Asset Management Co., Ltd | 2.049 | 8 | ||||||
| 2026-01-16 | 13F | Ronald Blue Trust, Inc. | 467 | 0,00 | 2 | 0,00 | ||||
| 2026-02-10 | 13F | Quantbot Technologies LP | 128.668 | -43,60 | 516 | -23,48 |