Grundlæggende statistik
| Institutionelle aktier (lange) | 30.300.192 - 54,25% (ex 13D/G) - change of 2,12MM shares 7,51% MRQ |
| Institutionel værdi (lang) | $ 105.848 USD ($1000) |
Institutionelt ejerskab og aktionærer
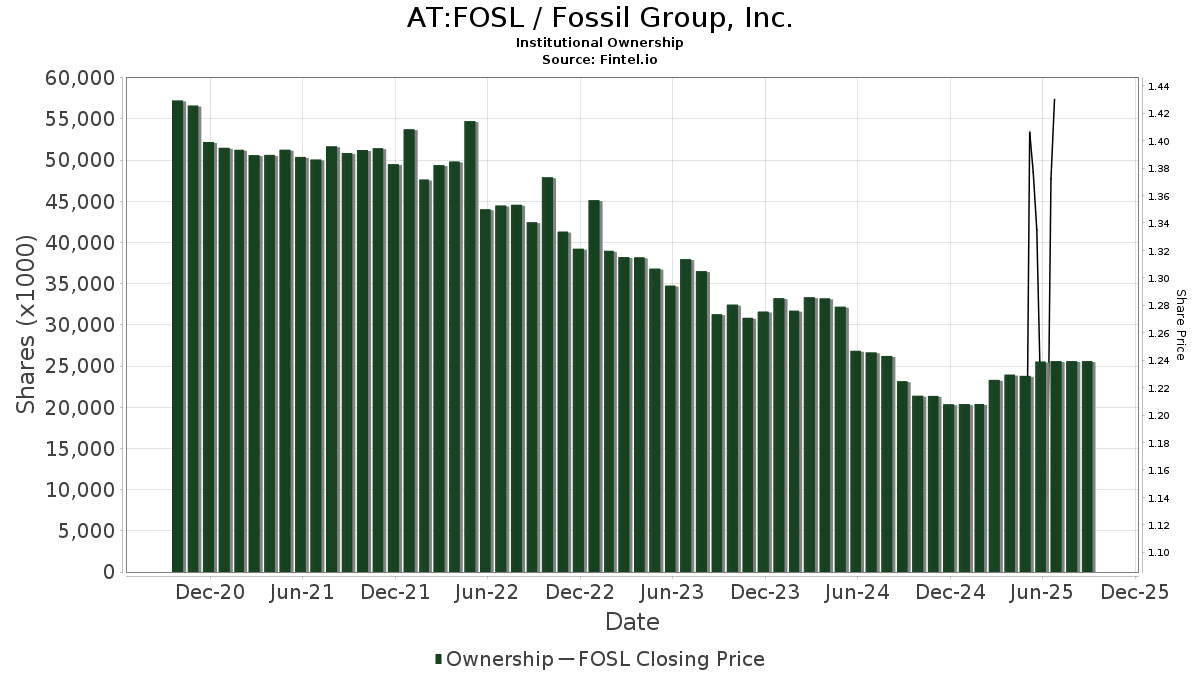
Fossil Group, Inc. (AT:FOSL) har 89 institutionelle ejere og aktionærer, der har indsendt 13D/G- eller 13F-formularer til Securities Exchange Commission (SEC). Disse institutioner har i alt 30,300,192 aktier. Største aktionærer omfatter Nantahala Capital Management, LLC, Miller Value Partners, Llc, Vanguard Group Inc, HG Vora Capital Management, LLC, Ameriprise Financial Inc, Kanen Wealth Management LLC, Two Sigma Investments, Lp, Susquehanna International Group, Llp, Prescott Group Capital Management, L.l.c., and BlackRock, Inc. .
Fossil Group, Inc. (WBAG:FOSL) institutionel ejerskabsstruktur viser aktuelle positioner i virksomheden efter institutioner og fonde, samt seneste ændringer i positionsstørrelse. Større aktionærer kan omfatte individuelle investorer, investeringsforeninger, hedgefonde eller institutioner. Skema 13D angiver, at investoren besidder (eller besidder) mere end 5 % af virksomheden og har til hensigt (eller har til hensigt at) aktivt at forfølge en ændring i forretningsstrategi. Skema 13G indikerer en passiv investering på over 5%.
The share price as of April 27, 2026 is 3,89 / share. Previously, on May 9, 2025, the share price was 1,15 / share. This represents an increase of 238,26% over that period.
Fondens stemningsscore
Fund Sentiment Score (fka Ownership Accumulation Score) finder de aktier, der bliver mest købt af fonde. Det er resultatet af en sofistikeret, multi-faktor kvantitativ model, der identificerer virksomheder med de højeste niveauer af institutionel akkumulering. Scoringsmodellen bruger en kombination af den samlede stigning i oplyste ejere, ændringerne i porteføljeallokeringer i disse ejere og andre målinger. Tallet går fra 0 til 100, hvor højere tal indikerer et højere niveau af akkumulering for sine jævnaldrende, og 50 er gennemsnittet.
Opdateringsfrekvens: Dagligt
Se Ownership Explorer, som giver en liste over højest rangerende virksomheder.
AI+ Ask Fintel’s AI assistant about Fossil Group, Inc..
Select a question to share a public post with an AI-crafted answer.
Thinking of good questions…
13F og NPORT arkivering
Detaljer om 13F-arkivering er gratis. Detaljer om NP-ansøgninger kræver et premium-medlemskab. Grønne rækker angiver nye positioner. Røde rækker angiver lukkede positioner. Klik på linket ikon for at se den fulde transaktionshistorik.
Opgrader
for at låse premium-data op og eksportere til Excel ![]() .
.
| Fil dato | Kilde | Investor | Type | Gennemsnitlig pris (Øst) |
Aktier | Δ Aktier (%) |
Rapporteret Værdi ($1000) |
Δ Værdi (%) |
Port Alloc (%) |
|
|---|---|---|---|---|---|---|---|---|---|---|
| 2026-02-17 | 13F | Fund 1 Investments, LLC | 642.043 | 180,74 | 2.414 | 311,24 | ||||
| 2026-02-17 | 13F | Mangrove Partners | 17.619 | 66 | ||||||
| 2026-02-17 | 13F | Balyasny Asset Management Llc | 30.014 | 113 | ||||||
| 2026-02-13 | 13F | Marshall Wace, Llp | 47.272 | 178 | ||||||
| 2026-02-13 | 13F | Hudson Bay Capital Management LP | 76.484 | 288 | ||||||
| 2026-02-13 | 13F | Headlands Technologies LLC | 39.812 | 107,87 | 150 | 204,08 | ||||
| 2026-04-08 | 13F | Partnership Wealth Management, LLC | 16.100 | 0,00 | 69 | 15,00 | ||||
| 2026-02-18 | 13F | Kanen Wealth Management LLC | 1.458.678 | 6 | ||||||
| 2026-02-11 | 13F | Spark Investment Management LLC | 55.900 | 210 | ||||||
| 2026-02-17 | 13F | Susquehanna International Group, Llp | 132.834 | -53,12 | 499 | -31,46 | ||||
| 2026-02-04 | 13F | First Eagle Investment Management, LLC | 495.000 | -22,84 | 1.861 | 12,92 | ||||
| 2026-02-13 | 13F | Walleye Capital LLC | 262.277 | -37,80 | 986 | -8,96 | ||||
| 2026-02-13 | 13F | American Century Companies Inc | 532.774 | 301,42 | 2.003 | 487,39 | ||||
| 2026-02-17 | 13F | Susquehanna International Group, Llp | Call | 960.000 | 820,42 | 3.610 | 1.246,64 | |||
| 2025-11-14 | 13F | Wolverine Trading, Llc | 24.695 | -46,38 | 67 | -2,90 | ||||
| 2026-02-17 | 13F | Schonfeld Strategic Advisors LLC | 16.668 | 63 | ||||||
| 2026-02-17 | 13F | Citadel Advisors Llc | Put | 35.400 | 58,04 | 133 | 133,33 | |||
| 2026-01-28 | 13F | CAPROCK Group, Inc. | 52.373 | -3,71 | 197 | 18,07 | ||||
| 2026-01-30 | 13F | Carrera Capital Advisors | 10.068 | 38 | ||||||
| 2026-04-07 | 13F | CoreCap Advisors, LLC | 0 | -100,00 | 0 | |||||
| 2026-02-17 | 13F | Citadel Advisors Llc | 106.360 | -20,92 | 400 | 15,65 | ||||
| 2026-02-17 | 13F | Citadel Advisors Llc | Call | 53.100 | -37,16 | 200 | -8,29 | |||
| 2026-02-13 | 13F | Quinn Opportunity Partners LLC | 766.262 | 62,93 | 2.881 | 138,49 | ||||
| 2026-04-21 | 13F | Huntleigh Advisors, Inc. | 302.687 | 1.305 | ||||||
| 2026-01-29 | 13F | Vanguard Group Inc | 2.337.411 | 0,52 | 8.789 | 47,08 | ||||
| 2026-02-06 | 13F | EverSource Wealth Advisors, LLC | 1.694 | 0,00 | 6 | 50,00 | ||||
| 2026-02-13 | 13F | Sei Investments Co | 122.240 | 460 | ||||||
| 2026-01-29 | 13F | IMC-Chicago, LLC | Call | 67.100 | 252 | |||||
| 2026-02-17 | 13F | Ameriprise Financial Inc | 1.500.094 | -36,58 | 5.640 | -7,22 | ||||
| 2026-02-17 | 13F | Lighthouse Investment Partners, LLC | 24.600 | 92 | ||||||
| 2025-12-29 | 13F | Swiss Life Asset Management Ltd | 0 | -100,00 | 0 | -100,00 | ||||
| 2026-02-17 | 13F | Millennium Management Llc | 125.578 | 114,96 | 472 | 214,67 | ||||
| 2025-11-14 | 13F | Susquehanna International Group, Llp | Put | 0 | -100,00 | 0 | -100,00 | |||
| 2026-02-17 | 13F | Raymond James Financial Inc | 20.853 | 0,00 | 78 | 47,17 | ||||
| 2026-02-09 | 13F | Geode Capital Management, Llc | 575.400 | 3,26 | 2.164 | 51,12 | ||||
| 2026-02-13 | 13F | Wells Fargo & Company/mn | 56.230 | 112.360,00 | 211 | |||||
| 2026-02-11 | 13F | Deutsche Bank Ag\ | 127.869 | 481 | ||||||
| 2026-02-17 | 13F | Two Sigma Investments, Lp | 1.016.527 | 7,22 | 3.822 | 56,90 | ||||
| 2026-02-11 | 13F | Jpmorgan Chase & Co | 1.653 | -94,43 | 6 | -92,11 | ||||
| 2026-02-13 | 13F | Wexford Capital Lp | 0 | -100,00 | 0 | -100,00 | ||||
| 2026-02-13 | 13F | Centiva Capital, LP | 0 | -100,00 | 0 | |||||
| 2026-02-13 | 13F | OMERS ADMINISTRATION Corp | 63.600 | 239 | ||||||
| 2026-02-17 | 13F | HG Vora Capital Management, LLC | 2.163.349 | 8.134 | ||||||
| 2026-02-17 | 13F | Advisory Services Network, LLC | 0 | -100,00 | 0 | |||||
| 2026-04-21 | 13F | Cannon Global Investment Management, LLC | 25.600 | 110 | ||||||
| 2026-01-15 | 13F | Nisa Investment Advisors, Llc | 150 | 0,00 | 1 | |||||
| 2026-02-13 | 13F | Prudential Financial Inc | 0 | -100,00 | 0 | |||||
| 2026-02-17 | 13F | Qube Research & Technologies Ltd | 165.603 | 978,28 | 623 | 1.494,87 | ||||
| 2026-02-13 | 13F | LGT Financial Advisors LLC | 400 | 0,00 | 2 | 0,00 | ||||
| 2026-02-17 | 13F | Algert Global Llc | 51.619 | 0,00 | 0 | |||||
| 2026-02-13 | 13F | State Street Corp | 230.149 | 7,62 | 865 | 57,56 | ||||
| 2026-02-11 | 13F | Simplex Trading, Llc | Put | 4.900 | -87,56 | 18 | ||||
| 2026-02-11 | 13F | Simplex Trading, Llc | 3.386 | -94,70 | 13 | |||||
| 2026-02-17 | 13F | Lotus Technology Management, LP | 90.288 | 339 | ||||||
| 2026-02-11 | 13F | Simplex Trading, Llc | Call | 125.100 | 1.151,00 | 470 | ||||
| 2026-02-09 | 13F | Texas Capital Bank Wealth Management Services Inc | 17.540 | 0,00 | 66 | 44,44 | ||||
| 2026-02-06 | 13F | Prescott Group Capital Management, L.l.c. | 875.026 | 1.220,67 | 3.290 | 1.835,29 | ||||
| 2026-02-17 | 13F | Bridgeway Capital Management Inc | 540.203 | 21,32 | 2.031 | 77,53 | ||||
| 2025-11-14 | 13F | Wolverine Trading, Llc | Put | 0 | -100,00 | 0 | -100,00 | |||
| 2026-02-12 | 13F | Renaissance Technologies Llc | 0 | -100,00 | 0 | |||||
| 2025-11-14 | 13F | Cubist Systematic Strategies, LLC | 23.512 | 60 | ||||||
| 2026-02-17 | 13F | Royal Bank Of Canada | 384 | 12.700,00 | 1 | |||||
| 2026-02-17 | 13F | Ancora Advisors, LLC | 34.710 | 131 | ||||||
| 2026-02-13 | 13F | Charles Schwab Investment Management Inc | 25.000 | 0,00 | 94 | 46,88 | ||||
| 2026-02-10 | 13F | Connor, Clark & Lunn Investment Management Ltd. | 239.750 | -1,39 | 901 | 44,39 | ||||
| 2026-02-06 | 13F | Gsa Capital Partners Llp | 0 | -100,00 | 0 | |||||
| 2026-02-11 | 13F | Group One Trading, L.p. | Call | 112.700 | -38,55 | 424 | -10,19 | |||
| 2026-02-13 | 13F | Citigroup Inc | 24.636 | 7.480,31 | 93 | |||||
| 2026-02-11 | 13F | Group One Trading, L.p. | Put | 19.600 | -90,71 | 74 | -86,53 | |||
| 2026-02-10 | 13F | Goldman Sachs Group Inc | 290.558 | 41,03 | 1.092 | 106,43 | ||||
| 2026-02-11 | 13F | Group One Trading, L.p. | 50.260 | 189 | ||||||
| 2026-02-13 | 13F | Squarepoint Ops LLC | 32.919 | 124 | ||||||
| 2026-02-12 | 13F | Hrt Financial Lp | 0 | -100,00 | 0 | |||||
| 2026-02-13 | 13F | Arrowstreet Capital, Limited Partnership | 688.142 | 0,78 | 2.587 | 47,49 | ||||
| 2026-04-23 | 13F | Ewa, Llc | 12.021 | 0,00 | 52 | 13,33 | ||||
| 2026-02-12 | 13F | Federated Hermes, Inc. | 1.517 | 0,00 | 6 | 66,67 | ||||
| 2026-02-18 | 13F/A | Empowered Funds, LLC | 114.403 | 10,45 | 430 | 61,65 | ||||
| 2026-02-17 | 13F | Fmr Llc | 5.195 | 0,00 | 20 | 46,15 | ||||
| 2026-02-17 | 13F | SageView Advisory Group, LLC | 54 | 0 | ||||||
| 2026-04-20 | 13F | LVW Advisors, LLC | 150.000 | 0,00 | 646 | 14,54 | ||||
| 2026-02-12 | 13F | Dimensional Fund Advisors Lp | 152.636 | -11,66 | 574 | 29,28 | ||||
| 2026-02-13 | 13F | Barclays Plc | 132.459 | 70,70 | 498 | 150,25 | ||||
| 2026-02-12 | 13F | EHP Funds Inc. | 0 | -100,00 | 0 | |||||
| 2026-02-17 | 13F | Two Sigma Advisers, Lp | 811.616 | -8,44 | 3.052 | 33,93 | ||||
| 2026-02-13 | 13F | Sycamore Partners Management, L.P. | 284.050 | 1.068 | ||||||
| 2026-02-17 | 13F | Quadrature Capital Ltd | 0 | -100,00 | 0 | |||||
| 2026-04-27 | 13F | HB Wealth Management, LLC | 28.498 | 123 | ||||||
| 2026-02-06 | 13F | Larson Financial Group LLC | 0 | -100,00 | 0 | |||||
| 2026-02-12 | 13F | Jane Street Group, Llc | 408.920 | 6,07 | 1.538 | 55,25 | ||||
| 2026-01-30 | 13F | R Squared Ltd | 0 | -100,00 | 0 | |||||
| 2026-02-13 | 13F | Morgan Stanley | 86.100 | -49,91 | 324 | -26,76 | ||||
| 2026-02-12 | 13F | Jane Street Group, Llc | Call | 35.000 | 132 | |||||
| 2026-02-19 | 13F | Invesco Ltd. | 19.686 | -77,36 | 74 | -66,82 | ||||
| 2026-02-12 | 13F | BlackRock, Inc. | 854.077 | 0,75 | 3.211 | 47,43 | ||||
| 2026-02-18 | 13F/A | Fuller & Thaler Asset Management, Inc. | 0 | -100,00 | 0 | -100,00 | ||||
| 2026-02-17 | 13F | Miller Value Partners, Llc | 3.184.415 | -4,27 | 11.973 | 40,07 | ||||
| 2025-11-13 | 13F | Hsbc Holdings Plc | 0 | -100,00 | 0 | -100,00 | ||||
| 2026-02-13 | 13F | Mink Brook Asset Management LLC | 0 | -100,00 | 0 | |||||
| 2026-02-17 | 13F | Tower Research Capital LLC (TRC) | 13.305 | 20,35 | 50 | 78,57 | ||||
| 2026-02-13 | 13F | Dynamic Technology Lab Private Ltd | 0 | -100,00 | 0 | -100,00 | ||||
| 2026-02-13 | 13F | Nantahala Capital Management, LLC | 5.064.359 | 35,37 | 19.042 | 98,05 | ||||
| 2026-02-13 | 13F | JustInvest LLC | 18.206 | 2,21 | 68 | 51,11 | ||||
| 2026-02-12 | 13F | EAM Investors, LLC | 200.894 | 0,00 | 755 | 46,32 | ||||
| 2026-02-17 | 13F/A | RBF Capital, LLC | 116.241 | -27,41 | 437 | 6,33 | ||||
| 2026-02-10 | 13F | Acadian Asset Management Llc | 608.222 | 30,15 | 2 | 100,00 | ||||
| 2026-02-03 | 13F | SBI Securities Co., Ltd. | 33 | 0,00 | 0 | |||||
| 2026-01-29 | 13F | UBS Group AG | 518.790 | -7,62 | 1.951 | 35,14 | ||||
| 2026-02-10 | 13F | Bnp Paribas Arbitrage, Sa | 510 | -5,90 | 2 | 0,00 | ||||
| 2026-02-17 | 13F | Price T Rowe Associates Inc /md/ | 86.628 | 0,00 | 0 | |||||
| 2026-02-17 | 13F | XTX Topco Ltd | 39.184 | -22,91 | 147 | 13,08 | ||||
| 2026-02-17 | 13F | Northern Trust Corp | 121.975 | -0,72 | 459 | 45,40 | ||||
| 2026-04-15 | 13F | Fortitude Family Office, LLC | 105 | 0 | ||||||
| 2026-02-17 | 13F | Bank Of America Corp /de/ | 305.248 | -16,21 | 1.148 | 22,54 | ||||
| 2026-02-17 | 13F | Creative Planning | 41.322 | 155 | ||||||
| 2026-02-17 | 13F | Point72 Asset Management, L.P. | 28.605 | 108 | ||||||
| 2026-02-17 | 13F | 683 Capital Management, LLC | 258.065 | 970 | ||||||
| 2026-02-12 | 13F | Federation des caisses Desjardins du Quebec | 0 | -100,00 | 0 |