Grundlæggende statistik
| Institutionelle ejere | 64 total, 60 long only, 0 short only, 4 long/short - change of 8,47% MRQ |
| Gennemsnitlig porteføljeallokering | 0.0603 % - change of -1.533,83% MRQ |
| Institutionelle aktier (lange) | 2.153.614 (ex 13D/G) - change of -0,09MM shares -3,95% MRQ |
| Institutionel værdi (lang) | $ 20.635 USD ($1000) |
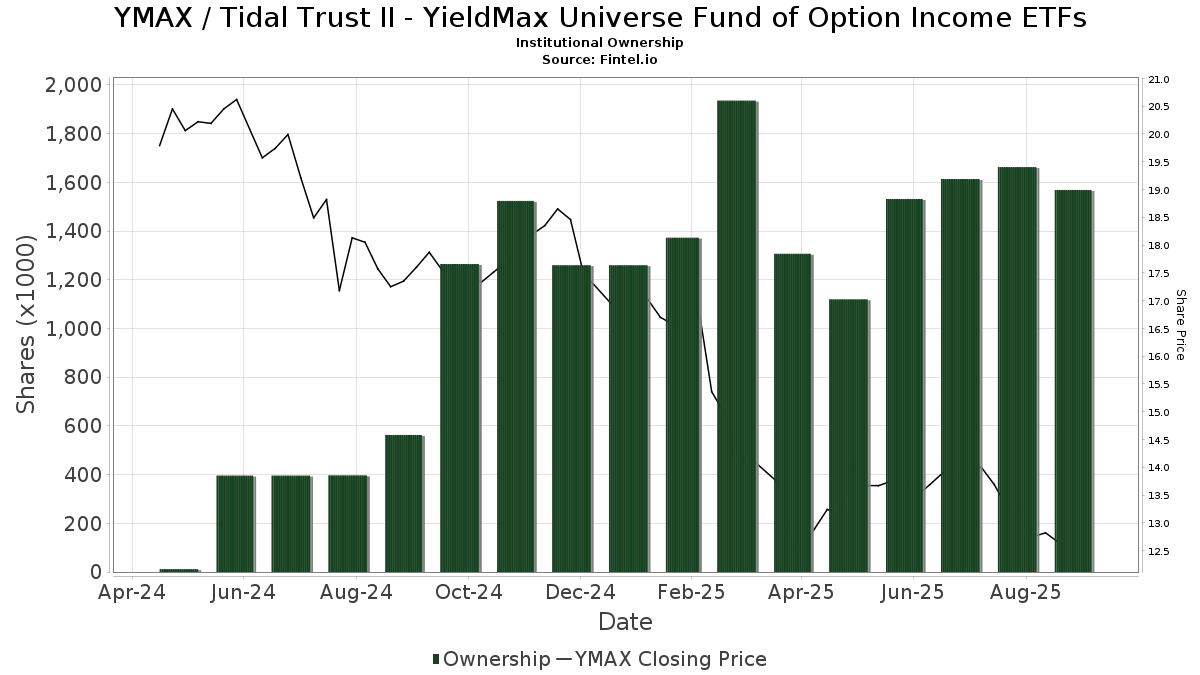
Institutionelt ejerskab og aktionærer
Tidal Trust II - YieldMax Universe Fund of Option Income ETFs (US:YMAX) har 64 institutionelle ejere og aktionærer, der har indsendt 13D/G- eller 13F-formularer til Securities Exchange Commission (SEC). Disse institutioner har i alt 2,153,614 aktier. Største aktionærer omfatter Susquehanna International Group, Llp, Old Mission Capital Llc, Wealth Watch Advisors, INC, ZEGA Investments, LLC, Jane Street Group, Llc, Winnow Wealth Llc, ZEGA Investments, LLC, Wealth Watch Advisors, INC, Coppell Advisory Solutions LLC, and Group One Trading, L.p. .
Tidal Trust II - YieldMax Universe Fund of Option Income ETFs (ARCA:YMAX) institutionel ejerskabsstruktur viser aktuelle positioner i virksomheden efter institutioner og fonde, samt seneste ændringer i positionsstørrelse. Større aktionærer kan omfatte individuelle investorer, investeringsforeninger, hedgefonde eller institutioner. Skema 13D angiver, at investoren besidder (eller besidder) mere end 5 % af virksomheden og har til hensigt (eller har til hensigt at) aktivt at forfølge en ændring i forretningsstrategi. Skema 13G indikerer en passiv investering på over 5%.
The share price as of March 31, 2026 is 7,83 / share. Previously, on April 1, 2025, the share price was 13,57 / share. This represents a decline of 42,30% over that period.
Fondens stemningsscore
Fund Sentiment Score (fka Ownership Accumulation Score) finder de aktier, der bliver mest købt af fonde. Det er resultatet af en sofistikeret, multi-faktor kvantitativ model, der identificerer virksomheder med de højeste niveauer af institutionel akkumulering. Scoringsmodellen bruger en kombination af den samlede stigning i oplyste ejere, ændringerne i porteføljeallokeringer i disse ejere og andre målinger. Tallet går fra 0 til 100, hvor højere tal indikerer et højere niveau af akkumulering for sine jævnaldrende, og 50 er gennemsnittet.
Opdateringsfrekvens: Dagligt
Se Ownership Explorer, som giver en liste over højest rangerende virksomheder.
AI+ Ask Fintel’s AI assistant about Tidal Trust II - YieldMax Universe Fund of Option Income ETFs.
Select a question to share a public post with an AI-crafted answer.
Thinking of good questions…
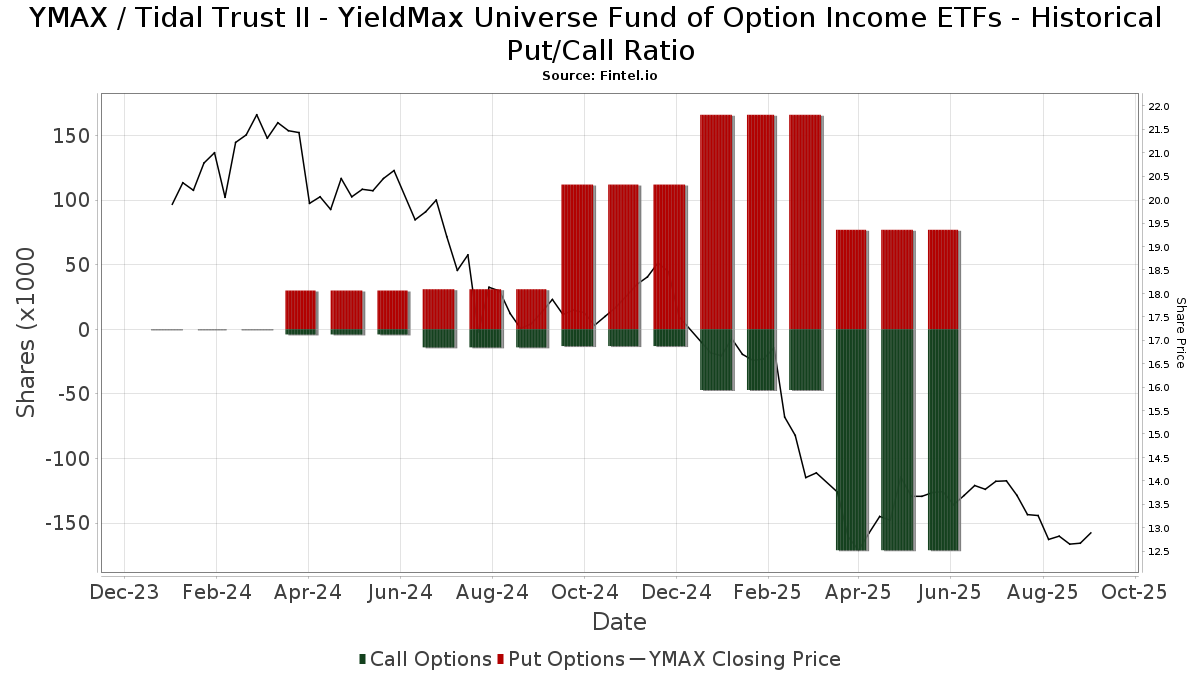
Institutionel Put/Call-forhold
Ud over at indberette standardaktie- og gældsudstedelser skal institutter med mere end 100 mill. aktiver under forvaltning også oplyse deres put- og call-optionsbeholdninger. Da salgsoptioner generelt indikerer negativ stemning, og købsoptioner indikerer positiv stemning, kan vi få en fornemmelse af den overordnede institutionelle stemning ved at plotte forholdet mellem put og kald. Diagrammet til højre viser det historiske put/call-forhold for dette instrument.
Brug af Put/Call Ratio som en indikator for investorernes stemning overvinder en af de vigtigste mangler ved at bruge totalt institutionelt ejerskab, som er, at en betydelig mængde af aktiver under forvaltning investeres passivt for at spore indekser. Passivt forvaltede fonde køber typisk ikke optioner, så indikatoren for put/call-forholdet følger mere nøje følelsen af aktivt forvaltede fonde.
13F og NPORT arkivering
Detaljer om 13F-arkivering er gratis. Detaljer om NP-ansøgninger kræver et premium-medlemskab. Grønne rækker angiver nye positioner. Røde rækker angiver lukkede positioner. Klik på linket ikon for at se den fulde transaktionshistorik.
Opgrader
for at låse premium-data op og eksportere til Excel ![]() .
.
| Fil dato | Kilde | Investor | Type | Gennemsnitlig pris (Øst) |
Aktier | Δ Aktier (%) |
Rapporteret Værdi ($1000) |
Δ Værdi (%) |
Port Alloc (%) |
|
|---|---|---|---|---|---|---|---|---|---|---|
| 2026-02-17 | 13F | Old Mission Capital Llc | 235.667 | 365,81 | 2.352 | 262,81 | ||||
| 2026-02-17 | 13F | Advisor Group Holdings, Inc. | 2.350 | -35,28 | 23 | -50,00 | ||||
| 2026-02-17 | 13F | Coppell Advisory Solutions LLC | 98.833 | 13,35 | 1.007 | -10,09 | ||||
| 2026-02-13 | 13F | National Bank Of Canada /fi/ | 0 | -100,00 | 0 | |||||
| 2026-02-11 | 13F | Simplex Trading, Llc | 3.181 | -63,49 | 32 | |||||
| 2026-02-10 | 13F | Belvedere Trading LLC | Call | 0 | -100,00 | 0 | -100,00 | |||
| 2026-02-12 | 13F | Federation des caisses Desjardins du Quebec | 0 | -100,00 | 0 | -100,00 | ||||
| 2026-02-13 | 13F | Mml Investors Services, Llc | 55.027 | -25,11 | 549 | -41,66 | ||||
| 2026-01-28 | 13F | Quaker Wealth Management, LLC | 520 | 16,85 | 5 | 0,00 | ||||
| 2026-01-29 | 13F | ODonnell Financial Services, LLC | 0 | -100,00 | 0 | |||||
| 2026-01-08 | 13F | Wealth Enhancement Advisory Services, Llc | 11.336 | 116 | ||||||
| 2026-02-12 | 13F | Hollencrest Capital Management | 20 | 0,00 | 0 | |||||
| 2025-11-06 | 13F | Ameritas Advisory Services, LLC | 0 | -100,00 | 0 | |||||
| 2026-01-27 | 13F | ZEGA Investments, LLC | 171.644 | -16,32 | 1.713 | -34,79 | ||||
| 2026-01-27 | 13F | ZEGA Investments, LLC | Put | 99.400 | 992 | |||||
| 2026-02-12 | 13F | Hrt Financial Lp | 59.276 | -32,19 | 1 | -100,00 | ||||
| 2026-02-17 | 13F | Cetera Investment Advisers | 15.591 | -13,90 | 156 | -32,90 | ||||
| 2026-01-26 | 13F | PFG Investments, LLC | 20.317 | 203 | ||||||
| 2026-02-19 | 13F | Mcguire Capital Advisors Inc | 61.326 | 612 | ||||||
| 2026-02-04 | 13F | Meridian Wealth Management, LLC | 12.946 | 129 | ||||||
| 2025-10-31 | 13F | Virtue Capital Management, LLC | 0 | -100,00 | 0 | |||||
| 2026-02-10 | 13F | Envestnet Asset Management Inc | 13.495 | -17,71 | 135 | -36,19 | ||||
| 2026-02-17 | 13F | Two Sigma Securities, Llc | 36.268 | 165,62 | 362 | 107,47 | ||||
| 2026-02-17 | 13F | Creative Planning | 12.886 | 129 | ||||||
| 2026-01-09 | 13F | SG Americas Securities, LLC | 0 | -100,00 | 0 | |||||
| 2026-02-05 | 13F | Allworth Financial LP | 13.234 | 25,85 | 132 | -1,49 | ||||
| 2026-01-23 | 13F | Farther Finance Advisors, LLC | 330 | 0,00 | 3 | -25,00 | ||||
| 2025-11-07 | 13F | Beacon Capital Management, LLC | 0 | -100,00 | 0 | -100,00 | ||||
| 2026-02-10 | 13F | Bnp Paribas Arbitrage, Sa | 34 | -55,26 | 0 | |||||
| 2026-02-06 | 13F | Authentikos Wealth Advisory, LLC | 88.451 | 17,28 | 883 | -8,70 | ||||
| 2026-02-12 | 13F | Renaissance Technologies Llc | 0 | -100,00 | 0 | |||||
| 2026-02-11 | 13F | Straight Path Wealth Management | 29.657 | -22,29 | 296 | -39,55 | ||||
| 2026-02-17 | 13F | Fmr Llc | 0 | -100,00 | 0 | |||||
| 2026-02-06 | 13F | Motco | 725 | 0,00 | 7 | -22,22 | ||||
| 2026-02-12 | 13F | Manchester Financial Inc | 85.672 | -12,83 | 855 | -32,03 | ||||
| 2026-01-12 | 13F | Daymark Wealth Partners, Llc | 11.852 | 118 | ||||||
| 2026-01-29 | 13F | UBS Group AG | 2.000 | -80,00 | 20 | -85,16 | ||||
| 2026-02-05 | 13F | Cambridge Investment Research Advisors, Inc. | 15.533 | -20,65 | 0 | |||||
| 2026-02-10 | 13F | Belvedere Trading LLC | Put | 30.300 | 185,85 | 302 | 123,70 | |||
| 2026-01-15 | 13F | Investment Partners Asset Management, Inc. | 0 | -100,00 | 0 | |||||
| 2026-02-12 | 13F | Commonwealth Equity Services, Llc | 10.656 | -11,07 | 106 | |||||
| 2026-02-17 | 13F | Bank Of America Corp /de/ | 306 | 3 | ||||||
| 2026-02-12 | 13F | IFC & Insurance Marketing, Inc. | 62 | 0 | ||||||
| 2026-02-17 | 13F | Citadel Advisors Llc | 0 | -100,00 | 0 | |||||
| 2025-11-14 | 13F | Integrity Alliance, Llc. | 0 | -100,00 | 0 | -100,00 | ||||
| 2026-01-12 | 13F | World Equity Group, Inc. | 14.000 | 140 | ||||||
| 2026-01-29 | 13F | Kestra Private Wealth Services, Llc | 13.240 | 0,00 | 132 | -21,89 | ||||
| 2026-02-10 | 13F | Belvedere Trading LLC | 12.658 | 1.512,48 | 126 | 1.160,00 | ||||
| 2026-02-12 | 13F | Jane Street Group, Llc | 159.264 | -15,94 | 1.589 | -34,53 | ||||
| 2026-02-06 | 13F | Larson Financial Group LLC | 3.370 | 16,85 | 34 | -8,33 | ||||
| 2026-02-09 | 13F | Harbour Investments, Inc. | 6.170 | 44,56 | 62 | 12,96 | ||||
| 2026-02-13 | 13F | Morgan Stanley | 570 | 277,48 | 6 | 400,00 | ||||
| 2026-02-06 | 13F | IFP Advisors, Inc | 500 | -46,52 | 5 | -63,64 | ||||
| 2026-02-06 | 13F | New Millennium Group LLC | 0 | -100,00 | 0 | |||||
| 2026-02-11 | 13F | Group One Trading, L.p. | 90.395 | -11,69 | 902 | -31,20 | ||||
| 2026-02-11 | 13F | Winnow Wealth Llc | 110.928 | 21,07 | 1.109 | -6,88 | ||||
| 2026-02-12 | 13F | SWAN Capital LLC | 450 | 0,00 | 4 | -20,00 | ||||
| 2026-02-17 | 13F | Citadel Advisors Llc | Put | 40.800 | -60,00 | 407 | -68,84 | |||
| 2026-02-04 | 13F | Atlantic Union Bankshares Corp | 377 | 4 | ||||||
| 2026-02-17 | 13F | Citadel Advisors Llc | Call | 29.800 | -78,73 | 297 | -83,44 | |||
| 2026-01-13 | 13F | CoreCap Advisors, LLC | 5 | 0,00 | 0 | |||||
| 2026-02-12 | 13F | Bank Of Montreal /can/ | 1.150 | 0,00 | 11 | -21,43 | ||||
| 2026-02-13 | 13F | Visionary Wealth Advisors | 20.102 | 10,27 | 201 | -14,16 | ||||
| 2026-01-14 | 13F | ORG Wealth Partners, LLC | 0 | -100,00 | 0 | -100,00 | ||||
| 2026-02-13 | 13F | Wells Fargo & Company/mn | 4 | 300,00 | 0 | |||||
| 2025-11-14 | 13F | Raymond James Financial Inc | 0 | -100,00 | 0 | |||||
| 2026-01-07 | 13F | Winebrenner Capital Management Llc | 23.869 | -7,73 | 238 | -28,10 | ||||
| 2026-01-21 | 13F | Stonebridge Financial Group, LLC | 10.000 | 100 | ||||||
| 2026-02-10 | 13F | Root Financial Partners, LLC | 28 | 0 | ||||||
| 2026-02-17 | 13F | Wealth Watch Advisors, INC | Put | 99.400 | 183 | |||||
| 2026-02-05 | 13F | Tucker Asset Management Llc | 14.113 | -5,34 | 141 | -26,32 | ||||
| 2026-01-29 | 13F | Dougherty Wealth Advisers LLC | 367 | 0,00 | 4 | -25,00 | ||||
| 2026-02-17 | 13F | Wealth Watch Advisors, INC | 176.462 | 320,35 | 1.761 | 227,93 | ||||
| 2026-01-26 | 13F | Independent Wealth Network Inc. | 14.311 | 13,19 | 143 | -11,80 | ||||
| 2026-02-17 | 13F | WFA of San Diego, LLC | 0 | -100,00 | 0 | |||||
| 2026-01-26 | 13F | AE Wealth Management LLC | 3.715 | 725,56 | 37 | 640,00 | ||||
| 2026-02-13 | 13F | Kestra Advisory Services, LLC | 7.183 | 72 | ||||||
| 2025-11-20 | 13F | Centaurus Financial, Inc. | 0 | -100,00 | 0 | |||||
| 2026-02-18 | 13F | EP Wealth Advisors, Inc. | 15.323 | 153 | ||||||
| 2026-02-17 | 13F/A | BluePath Capital Management, LLC | 0 | -100,00 | 0 | |||||
| 2026-02-17 | 13F | Susquehanna International Group, Llp | 327.070 | 71,39 | 3.264 | 33,55 | ||||
| 2025-10-31 | 13F | Frazier Financial Advisors, LLC | 0 | -100,00 | 0 | |||||
| 2025-11-14 | 13F | XTX Topco Ltd | 0 | -100,00 | 0 | -100,00 | ||||
| 2026-01-22 | 13F | Brookwood Investment Group LLC | 0 | -100,00 | 0 | |||||
| 2026-02-17 | 13F | Scarborough Advisors, LLC | 2 | 0 | ||||||
| 2026-02-13 | 13F | Toroso Investments, LLC | 13.067 | 18,90 | 130 | -7,14 | ||||
| 2026-03-17 | 13F | Stance Capital Llc | 0 | -100,00 | 0 | |||||
| 2026-02-11 | 13F | J.w. Cole Advisors, Inc. | 10.046 | 99 | ||||||
| 2026-02-13 | 13F | Motiv8 Investments LLC | 10.953 | 0 | ||||||
| 2026-02-20 | 13F | Sunbelt Securities, Inc. | 582 | 6 | ||||||
| 2026-02-11 | 13F | Jpmorgan Chase & Co | 0 | -100,00 | 0 | -100,00 | ||||
| 2026-01-05 | 13F | Legacy Wealth Management, LLC / MS | 24.145 | 5,15 | 241 | -18,37 |