Grundlæggende statistik
| Institutionelle ejere | 39 total, 33 long only, 0 short only, 6 long/short - change of -2,50% MRQ |
| Gennemsnitlig porteføljeallokering | 0.0096 % - change of -90,17% MRQ |
| Institutionelle aktier (lange) | 879.362 (ex 13D/G) - change of -0,71MM shares -44,58% MRQ |
| Institutionel værdi (lang) | $ 35.769 USD ($1000) |
Institutionelt ejerskab og aktionærer
Direxion Shares ETF Trust - Direxion Daily FTSE China Bull 3X Shares (US:YINN) har 39 institutionelle ejere og aktionærer, der har indsendt 13D/G- eller 13F-formularer til Securities Exchange Commission (SEC). Disse institutioner har i alt 879,362 aktier. Største aktionærer omfatter Susquehanna International Group, Llp, Jane Street Group, Llc, Citadel Advisors Llc, Jane Street Group, Llc, Susquehanna International Group, Llp, Citadel Advisors Llc, Belvedere Trading LLC, Quadrature Capital Ltd, Belvedere Trading LLC, and Susquehanna International Group, Llp .
Direxion Shares ETF Trust - Direxion Daily FTSE China Bull 3X Shares (ARCA:YINN) institutionel ejerskabsstruktur viser aktuelle positioner i virksomheden efter institutioner og fonde, samt seneste ændringer i positionsstørrelse. Større aktionærer kan omfatte individuelle investorer, investeringsforeninger, hedgefonde eller institutioner. Skema 13D angiver, at investoren besidder (eller besidder) mere end 5 % af virksomheden og har til hensigt (eller har til hensigt at) aktivt at forfølge en ændring i forretningsstrategi. Skema 13G indikerer en passiv investering på over 5%.
The share price as of March 19, 2026 is 34,13 / share. Previously, on March 20, 2025, the share price was 47,02 / share. This represents a decline of 27,41% over that period.

Fondens stemningsscore
Fund Sentiment Score (fka Ownership Accumulation Score) finder de aktier, der bliver mest købt af fonde. Det er resultatet af en sofistikeret, multi-faktor kvantitativ model, der identificerer virksomheder med de højeste niveauer af institutionel akkumulering. Scoringsmodellen bruger en kombination af den samlede stigning i oplyste ejere, ændringerne i porteføljeallokeringer i disse ejere og andre målinger. Tallet går fra 0 til 100, hvor højere tal indikerer et højere niveau af akkumulering for sine jævnaldrende, og 50 er gennemsnittet.
Opdateringsfrekvens: Dagligt
Se Ownership Explorer, som giver en liste over højest rangerende virksomheder.
AI+ Ask Fintel’s AI assistant about Direxion Shares ETF Trust - Direxion Daily FTSE China Bull 3X Shares.
Select a question to share a public post with an AI-crafted answer.
Thinking of good questions…
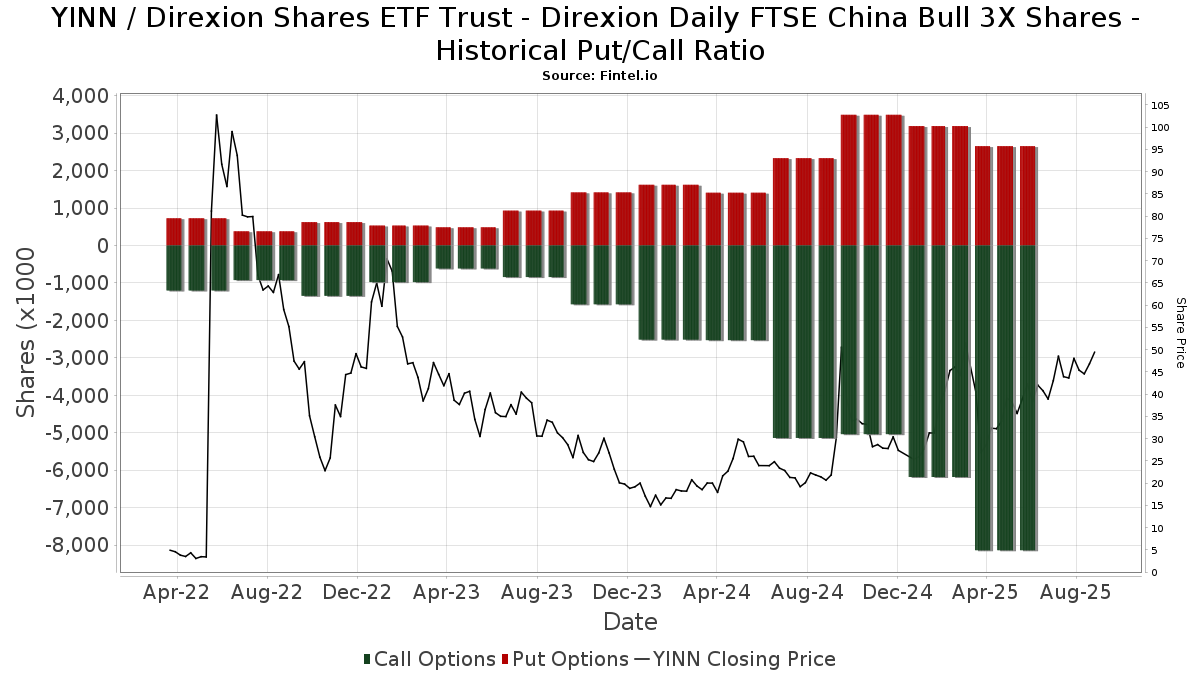
Institutionel Put/Call-forhold
Ud over at indberette standardaktie- og gældsudstedelser skal institutter med mere end 100 mill. aktiver under forvaltning også oplyse deres put- og call-optionsbeholdninger. Da salgsoptioner generelt indikerer negativ stemning, og købsoptioner indikerer positiv stemning, kan vi få en fornemmelse af den overordnede institutionelle stemning ved at plotte forholdet mellem put og kald. Diagrammet til højre viser det historiske put/call-forhold for dette instrument.
Brug af Put/Call Ratio som en indikator for investorernes stemning overvinder en af de vigtigste mangler ved at bruge totalt institutionelt ejerskab, som er, at en betydelig mængde af aktiver under forvaltning investeres passivt for at spore indekser. Passivt forvaltede fonde køber typisk ikke optioner, så indikatoren for put/call-forholdet følger mere nøje følelsen af aktivt forvaltede fonde.
13F og NPORT arkivering
Detaljer om 13F-arkivering er gratis. Detaljer om NP-ansøgninger kræver et premium-medlemskab. Grønne rækker angiver nye positioner. Røde rækker angiver lukkede positioner. Klik på linket ikon for at se den fulde transaktionshistorik.
Opgrader
for at låse premium-data op og eksportere til Excel ![]() .
.
| Fil dato | Kilde | Investor | Type | Gennemsnitlig pris (Øst) |
Aktier | Δ Aktier (%) |
Rapporteret Værdi ($1000) |
Δ Værdi (%) |
Port Alloc (%) |
|
|---|---|---|---|---|---|---|---|---|---|---|
| 2026-02-17 | 13F | Balyasny Asset Management Llc | Call | 61.400 | 55,84 | 2.615 | 22,25 | |||
| 2026-02-12 | 13F | Federation des caisses Desjardins du Quebec | 658 | 0,00 | 28 | -20,00 | ||||
| 2026-02-11 | 13F | Simplex Trading, Llc | 71.661 | 3.052 | ||||||
| 2026-02-17 | 13F | XTX Topco Ltd | 0 | -100,00 | 0 | |||||
| 2026-01-14 | 13F | Spire Wealth Management | 179 | 0,00 | 8 | -22,22 | ||||
| 2026-02-12 | 13F | Hrt Financial Lp | 16.266 | 1 | ||||||
| 2026-02-17 | 13F | Toronto Dominion Bank | 3 | 0 | ||||||
| 2026-02-17 | 13F | Balyasny Asset Management Llc | Put | 15.300 | -3,77 | 652 | -24,57 | |||
| 2026-02-13 | 13F | Squarepoint Ops LLC | Call | 24.600 | -55,27 | 1.048 | -64,92 | |||
| 2026-02-10 | 13F | Bank of New York Mellon Corp | 5.002 | 213 | ||||||
| 2026-02-13 | 13F | Squarepoint Ops LLC | Put | 29.400 | 0,00 | 1.252 | -21,55 | |||
| 2026-01-16 | 13F | FNY Investment Advisers, LLC | Call | 0 | -100,00 | 0 | ||||
| 2026-02-17 | 13F | Qube Research & Technologies Ltd | 303 | -89,27 | 13 | -92,16 | ||||
| 2026-02-17 | 13F/A | Cantor Fitzgerald, L. P. | 0 | -100,00 | 0 | -100,00 | ||||
| 2026-02-03 | 13F | SBI Securities Co., Ltd. | 9.022 | 58,81 | 384 | 24,68 | ||||
| 2026-01-08 | 13F | Wealth Enhancement Advisory Services, Llc | 5.239 | 252 | ||||||
| 2026-02-02 | 13F | Ping Capital Management, Inc. | 0 | -100,00 | 0 | |||||
| 2026-01-07 | 13F | Sovereign Financial Group, Inc. | 5.601 | -9,86 | 239 | -29,38 | ||||
| 2025-10-17 | 13F | TB Alternative Assets Ltd. | 0 | -100,00 | 0 | |||||
| 2026-02-13 | 13F | Barclays Plc | 2.500 | -66,07 | 106 | -73,50 | ||||
| 2026-02-11 | 13F | Jpmorgan Chase & Co | 53.811 | -27,94 | 2.292 | -43,49 | ||||
| 2026-02-13 | 13F | Truvestments Capital Llc | 250 | 0,00 | 11 | -23,08 | ||||
| 2026-02-17 | 13F | Jump Financial, LLC | 0 | -100,00 | 0 | |||||
| 2026-02-23 | 13F | Virtu Financial LLC | 23.967 | -55,67 | 1 | -50,00 | ||||
| 2026-02-11 | 13F | Parallel Advisors, LLC | 5.300 | 0,00 | 226 | -21,60 | ||||
| 2026-02-17 | 13F | Citadel Advisors Llc | Call | 1.372.600 | -66,15 | 58.459 | -73,45 | |||
| 2025-11-03 | 13F | AE Wealth Management LLC | 0 | -100,00 | 0 | |||||
| 2026-02-17 | 13F | Citadel Advisors Llc | Put | 500.000 | -1,09 | 21.295 | -22,40 | |||
| 2026-02-17 | 13F | Citadel Advisors Llc | 101.140 | 4.308 | ||||||
| 2026-01-21 | 13F | Signature Resources Capital Management, LLC | 2.290 | 0,00 | 98 | -21,77 | ||||
| 2026-02-13 | 13F | Walleye Trading LLC | Call | 53.300 | -29,59 | 2.270 | -44,76 | |||
| 2026-02-13 | 13F | Walleye Trading LLC | 10.912 | 537,38 | 465 | 404,35 | ||||
| 2026-02-17 | 13F | Tower Research Capital LLC (TRC) | 58 | 314,29 | 2 | |||||
| 2026-02-12 | 13F | Jane Street Group, Llc | Put | 1.082.200 | -4,87 | 46.091 | -25,37 | |||
| 2026-02-12 | 13F | Jane Street Group, Llc | Call | 1.549.900 | 51,52 | 66.010 | 18,87 | |||
| 2026-02-13 | 13F | Flow Traders U.s. Llc | 0 | -100,00 | 0 | |||||
| 2026-02-03 | 13F | Pilgrim Partners Asia Pte Ltd | 1.000 | 43 | ||||||
| 2025-11-14 | 13F | Advisor Group Holdings, Inc. | 0 | -100,00 | 0 | |||||
| 2026-02-17 | 13F | Bank Of America Corp /de/ | 2.328 | 0,00 | 99 | -21,43 | ||||
| 2025-11-12 | 13F | HAP Trading, LLC | Call | 17.000 | 192 | |||||
| 2026-02-17 | 13F | Optiver Holding B.V. | 0 | -100,00 | 0 | |||||
| 2026-02-12 | 13F | Renaissance Technologies Llc | 0 | -100,00 | 0 | |||||
| 2026-02-13 | 13F | Bard Associates Inc | Call | 13 | ||||||
| 2026-01-08 | 13F | Wedmont Private Capital | 5.292 | 0,00 | 241 | -14,54 | ||||
| 2026-02-12 | 13F | Bank Of Montreal /can/ | 165 | -29,49 | 7 | -41,67 | ||||
| 2026-02-13 | 13F | Bard Associates Inc | 725 | 31 | ||||||
| 2026-02-19 | 13F | CI Private Wealth, LLC | 7.028 | 299 | ||||||
| 2025-11-13 | 13F | Rathbone Brothers plc | 0 | -100,00 | 0 | |||||
| 2026-02-12 | 13F | Summit Financial, LLC | 0 | -100,00 | 0 | |||||
| 2026-01-29 | 13F | UBS Group AG | 59.191 | -87,98 | 2.521 | -90,58 | ||||
| 2026-02-17 | 13F | Susquehanna International Group, Llp | Call | 2.515.800 | -26,67 | 107.148 | -42,47 | |||
| 2026-02-13 | 13F | Morgan Stanley | 5.201 | -4,08 | 222 | -24,83 | ||||
| 2026-02-10 | 13F/A | Northwestern Mutual Wealth Management Co | 126 | 0,00 | 5 | -16,67 | ||||
| 2026-02-17 | 13F | Quadrature Capital Ltd | 197.493 | 8.411 | ||||||
| 2026-02-17 | 13F | Susquehanna International Group, Llp | 102.518 | -60,76 | 4.366 | -69,22 | ||||
| 2025-11-14 | 13F | Gts Securities Llc | 0 | -100,00 | 0 | -100,00 | ||||
| 2026-02-17 | 13F | Susquehanna International Group, Llp | Put | 882.700 | 7,61 | 37.594 | -15,58 | |||
| 2026-01-26 | 13F | Great Hill Capital LLC | 0 | -100,00 | 0 | |||||
| 2026-02-17 | 13F | Two Sigma Securities, Llc | 13.492 | 575 | ||||||
| 2026-01-28 | 13F | Kingswood Wealth Advisors, Llc | 6.906 | 0,00 | 294 | -21,39 | ||||
| 2026-02-13 | 13F | Vontobel Holding Ltd. | Call | 8.000 | 341 | |||||
| 2026-02-10 | 13F | Hillsdale Investment Management Inc. | 110 | 0,00 | 5 | -20,00 | ||||
| 2026-02-12 | 13F | Jane Street Group, Llc | 0 | -100,00 | 0 | -100,00 | ||||
| 2026-01-28 | 13F | Hoey Investments, Inc | 0 | -100,00 | 0 | |||||
| 2026-02-10 | 13F | Belvedere Trading LLC | Put | 219.800 | 9.361 | |||||
| 2026-02-10 | 13F | Belvedere Trading LLC | 163.625 | 6.969 |