Grundlæggende statistik
| Institutionelle ejere | 130 total, 130 long only, 0 short only, 0 long/short - change of 17,12% MRQ |
| Gennemsnitlig porteføljeallokering | 0.2598 % - change of -41,82% MRQ |
| Institutionelle aktier (lange) | 14.137.700 (ex 13D/G) - change of 1,09MM shares 8,36% MRQ |
| Institutionel værdi (lang) | $ 848.037 USD ($1000) |
Institutionelt ejerskab og aktionærer
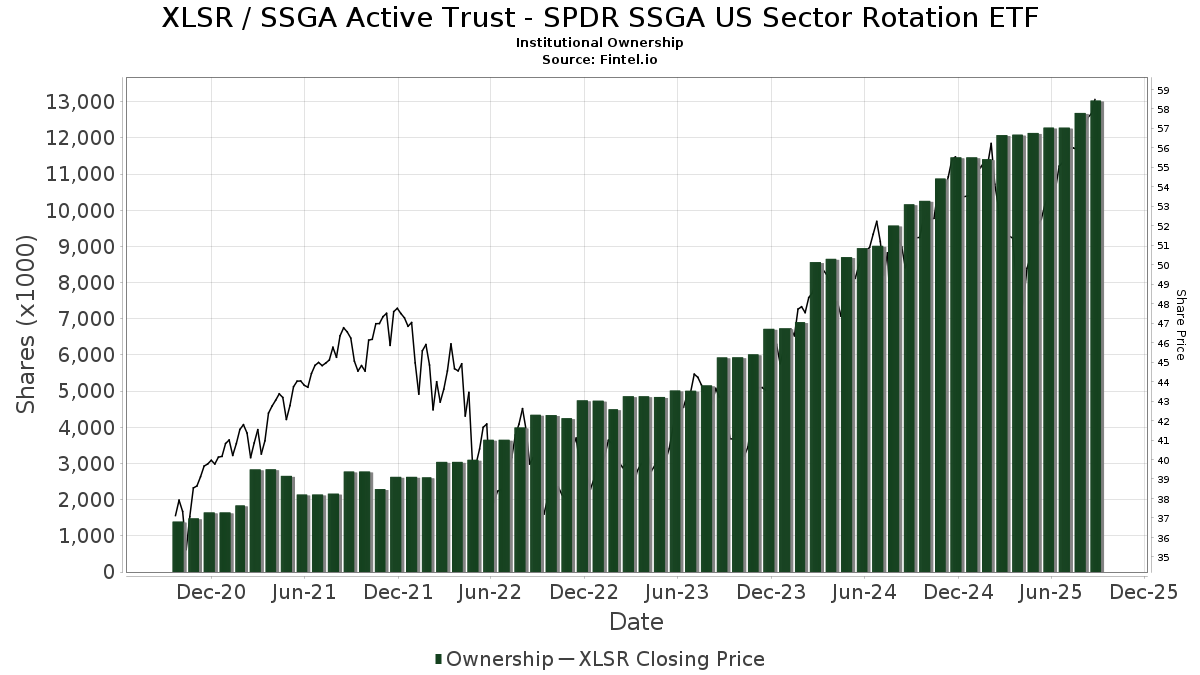
SSGA Active Trust - State Street US Sector Rotation ETF (US:XLSR) har 130 institutionelle ejere og aktionærer, der har indsendt 13D/G- eller 13F-formularer til Securities Exchange Commission (SEC). Disse institutioner har i alt 14,137,700 aktier. Største aktionærer omfatter LPL Financial LLC, Envestnet Portfolio Solutions, Inc., Envestnet Asset Management Inc, Park Avenue Securities Llc, Hibernia Wealth Partners, LLC, Austin Private Wealth, LLC, Mariner, LLC, Landmark Wealth Management, Inc., GWM Advisors LLC, and Aspire Private Capital, LLC .
SSGA Active Trust - State Street US Sector Rotation ETF (ARCA:XLSR) institutionel ejerskabsstruktur viser aktuelle positioner i virksomheden efter institutioner og fonde, samt seneste ændringer i positionsstørrelse. Større aktionærer kan omfatte individuelle investorer, investeringsforeninger, hedgefonde eller institutioner. Skema 13D angiver, at investoren besidder (eller besidder) mere end 5 % af virksomheden og har til hensigt (eller har til hensigt at) aktivt at forfølge en ændring i forretningsstrategi. Skema 13G indikerer en passiv investering på over 5%.
The share price as of March 27, 2026 is 56,25 / share. Previously, on March 28, 2025, the share price was 50,57 / share. This represents an increase of 11,24% over that period.
Fondens stemningsscore
Fund Sentiment Score (fka Ownership Accumulation Score) finder de aktier, der bliver mest købt af fonde. Det er resultatet af en sofistikeret, multi-faktor kvantitativ model, der identificerer virksomheder med de højeste niveauer af institutionel akkumulering. Scoringsmodellen bruger en kombination af den samlede stigning i oplyste ejere, ændringerne i porteføljeallokeringer i disse ejere og andre målinger. Tallet går fra 0 til 100, hvor højere tal indikerer et højere niveau af akkumulering for sine jævnaldrende, og 50 er gennemsnittet.
Opdateringsfrekvens: Dagligt
Se Ownership Explorer, som giver en liste over højest rangerende virksomheder.
AI+ Ask Fintel’s AI assistant about SSGA Active Trust - State Street US Sector Rotation ETF.
Select a question to share a public post with an AI-crafted answer.
Thinking of good questions…
Institutionel Put/Call-forhold
Ud over at indberette standardaktie- og gældsudstedelser skal institutter med mere end 100 mill. aktiver under forvaltning også oplyse deres put- og call-optionsbeholdninger. Da salgsoptioner generelt indikerer negativ stemning, og købsoptioner indikerer positiv stemning, kan vi få en fornemmelse af den overordnede institutionelle stemning ved at plotte forholdet mellem put og kald. Diagrammet til højre viser det historiske put/call-forhold for dette instrument.
Brug af Put/Call Ratio som en indikator for investorernes stemning overvinder en af de vigtigste mangler ved at bruge totalt institutionelt ejerskab, som er, at en betydelig mængde af aktiver under forvaltning investeres passivt for at spore indekser. Passivt forvaltede fonde køber typisk ikke optioner, så indikatoren for put/call-forholdet følger mere nøje følelsen af aktivt forvaltede fonde.
13F og NPORT arkivering
Detaljer om 13F-arkivering er gratis. Detaljer om NP-ansøgninger kræver et premium-medlemskab. Grønne rækker angiver nye positioner. Røde rækker angiver lukkede positioner. Klik på linket ikon for at se den fulde transaktionshistorik.
Opgrader
for at låse premium-data op og eksportere til Excel ![]() .
.
| Fil dato | Kilde | Investor | Type | Gennemsnitlig pris (Øst) |
Aktier | Δ Aktier (%) |
Rapporteret Værdi ($1000) |
Δ Værdi (%) |
Port Alloc (%) |
|
|---|---|---|---|---|---|---|---|---|---|---|
| 2026-02-05 | 13F | Cambridge Investment Research Advisors, Inc. | 30.128 | -2,18 | 2 | 0,00 | ||||
| 2026-02-09 | 13F | Smithfield Trust Co | 167 | 0 | ||||||
| 2026-02-13 | 13F | SRS Capital Advisors, Inc. | 258 | 0,00 | 16 | 6,67 | ||||
| 2026-01-12 | 13F | Castleview Partners, Llc | 5.433 | -7,77 | 339 | -3,70 | ||||
| 2026-01-28 | 13F | Family Wealth Group, LLC | 9.469 | -2,47 | 590 | 2,08 | ||||
| 2026-02-09 | 13F | Frazier Financial Advisors, LLC | 560 | 0,00 | 35 | 3,03 | ||||
| 2026-02-10 | 13F | Envestnet Asset Management Inc | 1.924.116 | 4,56 | 119.892 | 9,29 | ||||
| 2026-02-13 | 13F | Change Path, LLC | 112.986 | 4,10 | 7.040 | 8,83 | ||||
| 2026-01-26 | 13F | Patriot Financial Group Insurance Agency, LLC | 3.615 | -3,91 | 225 | 0,45 | ||||
| 2026-02-06 | 13F | Creative Financial Designs Inc /adv | 10.209 | 11,21 | 636 | 16,27 | ||||
| 2026-02-13 | 13F | Citigroup Inc | 1.300 | 81 | ||||||
| 2026-01-14 | 13F | Kraft, Davis & Associates, LLC | 5.961 | -0,48 | 374 | 3,61 | ||||
| 2026-01-20 | 13F | AdvisorNet Financial, Inc | 199 | 0,00 | 12 | 9,09 | ||||
| 2026-02-12 | 13F | Principal Securities, Inc. | 36.876 | 173,07 | 2.298 | 185,70 | ||||
| 2026-02-13 | 13F | Smartleaf Asset Management LLC | 6.912 | 9,45 | 434 | 15,78 | ||||
| 2026-02-17 | 13F | Advisory Services Network, LLC | 4.790 | 14,21 | 298 | 19,20 | ||||
| 2026-01-26 | 13F | Key Capital Management, INC | 1 | 0 | ||||||
| 2026-02-12 | 13F | Ruggiero Investments, Inc. | 4.152 | 259 | ||||||
| 2026-02-10 | 13F | REAP Financial Group, LLC | 468 | 0,00 | 29 | 7,41 | ||||
| 2026-01-09 | 13F | Silverlake Wealth Management Llc | 6.593 | -2,69 | 411 | 1,74 | ||||
| 2026-02-12 | 13F | Summit Financial, LLC | 101.445 | -1,71 | 6.321 | 2,75 | ||||
| 2026-01-21 | 13F | Lockerman Financial Group, Inc. | 37.878 | 2,49 | 2.360 | 7,13 | ||||
| 2026-02-17 | 13F | Susquehanna International Group, Llp | 5.232 | -54,86 | 326 | -52,75 | ||||
| 2026-02-11 | 13F | Jpmorgan Chase & Co | 216 | 13 | ||||||
| 2026-02-06 | 13F | HighTower Advisors, LLC | 132.688 | 11,40 | 8.268 | 16,44 | ||||
| 2026-02-17 | 13F | One Wealth Capital Management, Llc | 4.982 | 310 | ||||||
| 2026-02-12 | 13F | Jane Street Group, Llc | 4.523 | 282 | ||||||
| 2026-02-13 | 13F | Croban | 3.670 | -26,47 | 229 | -23,23 | ||||
| 2026-02-26 | 13F/A | Authentikos Wealth Advisory, LLC | 0 | -100,00 | 0 | |||||
| 2026-02-17 | 13F | VestGen Advisors, LLC | 10.699 | -33,08 | 667 | -30,12 | ||||
| 2026-03-24 | 13F | Armis Advisers, LLC | 11.549 | 669 | ||||||
| 2026-01-16 | 13F | Balboa Wealth Partners | 27.798 | -2,82 | 1.732 | 1,58 | ||||
| 2026-02-17 | 13F | Cetera Investment Advisers | 164.364 | 6,82 | 10.242 | 11,66 | ||||
| 2026-02-11 | 13F | LPL Financial LLC | 4.676.742 | 1,21 | 291.408 | 5,79 | ||||
| 2026-01-20 | 13F | October Effect Ltd | 19.954 | 12,95 | 1.243 | 18,04 | ||||
| 2026-01-20 | 13F | Austin Private Wealth, LLC | 342.395 | 2,93 | 21.335 | 7,60 | ||||
| 2026-02-17 | 13F | Fmr Llc | 0 | -100,00 | 0 | |||||
| 2026-01-07 | 13F | Private Client Services, Llc | 4.159 | -0,83 | 259 | 3,60 | ||||
| 2026-01-20 | 13F | J2 Capital Management Inc | 6.345 | -3,57 | 395 | 0,77 | ||||
| 2026-02-05 | 13F | Allworth Financial LP | 494 | -35,00 | 31 | -33,33 | ||||
| 2026-02-17 | 13F | Creative Planning | 6.844 | 0,06 | 426 | 4,67 | ||||
| 2026-02-17 | 13F | Bank Of America Corp /de/ | 4.377 | 273 | ||||||
| 2026-02-18 | 13F | GWM Advisors LLC | 265.772 | -7,91 | 16.560 | -3,74 | ||||
| 2026-02-13 | 13F | Maia Wealth LLC | 5.123 | -1,02 | 311 | -2,20 | ||||
| 2026-02-13 | 13F | Stifel Financial Corp | 11.431 | 5,78 | 712 | 10,56 | ||||
| 2026-02-17 | 13F | Pinnacle Family Advisors, LLC | 3.801 | 237 | ||||||
| 2026-01-29 | 13F | Quest 10 Wealth Builders, Inc. | 950 | 97,51 | 59 | 110,71 | ||||
| 2026-02-02 | 13F | FSA Advisors, Inc. | 9.345 | 582 | ||||||
| 2026-01-26 | 13F | Private Trust Co Na | 1.896 | -2,37 | 118 | 2,61 | ||||
| 2026-02-11 | 13F | Outlook Wealth Advisors, LLC | 35.949 | -3,14 | 2.240 | 1,22 | ||||
| 2026-01-13 | 13F | Signal Advisors Wealth, LLC | 195.986 | 0,63 | 12.212 | 5,18 | ||||
| 2026-02-13 | 13F | Wells Fargo & Company/mn | 1.463 | 236,32 | 91 | 264,00 | ||||
| 2025-11-21 | 13F | Forefront Analytics, LLC | 0 | -100,00 | 0 | -100,00 | ||||
| 2026-01-05 | 13F | Park Avenue Securities Llc | 486.505 | 5,32 | 30 | 11,11 | ||||
| 2026-01-14 | 13F | International Private Wealth Advisors LLC | 63.061 | 3,00 | 3.929 | 7,67 | ||||
| 2026-03-13 | 13F/A | Pensionmark Financial Group, Llc | 20.957 | 1.306 | ||||||
| 2025-11-03 | 13F | Foundations Investment Advisors, LLC | 0 | -100,00 | 0 | |||||
| 2026-01-21 | 13F | Future Financial Wealth Managment LLC | 0 | -100,00 | 0 | |||||
| 2026-02-06 | 13F | Kingdom Financial Group LLC. | 260 | 16 | ||||||
| 2026-02-11 | 13F | J.w. Cole Advisors, Inc. | 10.210 | 23,83 | 159 | -67,82 | ||||
| 2026-02-17 | 13F | GeoWealth Management, LLC | 54.351 | -3,20 | 3.387 | 1,20 | ||||
| 2026-01-20 | 13F | Stratos Wealth Partners, LTD. | 13.158 | -1,56 | 820 | 2,89 | ||||
| 2026-02-13 | 13F | Mml Investors Services, Llc | 79.052 | 56,92 | 4.926 | 64,00 | ||||
| 2026-02-06 | 13F | Global Retirement Partners, LLC | 423 | -12,24 | 26 | -7,14 | ||||
| 2026-01-13 | 13F | Kelly Financial Services LLC | 9.720 | -8,35 | 606 | -4,27 | ||||
| 2026-02-06 | 13F | Signature Estate & Investment Advisors Llc | 4.826 | 301 | ||||||
| 2026-02-06 | 13F | Envestnet Portfolio Solutions, Inc. | 2.038.665 | 3,49 | 127.029 | 8,17 | ||||
| 2026-01-13 | 13F | CoreCap Advisors, LLC | 449 | -25,79 | 28 | -25,00 | ||||
| 2026-02-12 | 13F | Steward Partners Investment Advisory, Llc | 0 | -100,00 | 0 | |||||
| 2026-01-30 | 13F | Us Bancorp \de\ | 277 | 0,00 | 17 | 6,25 | ||||
| 2026-01-09 | 13F | Capital CS Group, LLC | 11.919 | 13,18 | 743 | 18,34 | ||||
| 2026-02-13 | 13F | Kestra Advisory Services, LLC | 0 | -100,00 | 0 | |||||
| 2026-01-26 | 13F | AE Wealth Management LLC | 131.825 | 3,70 | 8.214 | 8,41 | ||||
| 2026-02-17 | 13F | Hilltop Holdings Inc. | 21.385 | -3,79 | 1.332 | 0,53 | ||||
| 2026-01-12 | 13F | Spinnaker Investment Group, LLC | 13.373 | 10,07 | 833 | 15,06 | ||||
| 2026-02-05 | 13F | Aegis Wealth Management, Inc. | 11.571 | 721 | ||||||
| 2026-02-09 | 13F | Harbour Investments, Inc. | 159.209 | -13,49 | 9.920 | -9,57 | ||||
| 2026-02-13 | 13F | Mariner, LLC | 286.549 | 17,14 | 17.855 | 22,45 | ||||
| 2026-02-02 | 13F | Truist Financial Corp | 7.282 | 6,07 | 454 | 10,76 | ||||
| 2026-01-22 | 13F | Richardson Financial Services Inc. | 1.724 | 0,00 | 459 | 350,00 | ||||
| 2026-02-12 | 13F | Rossby Financial, LCC | 28 | 12,00 | 2 | 0,00 | ||||
| 2025-11-12 | 13F | Kingsview Wealth Management, LLC | 0 | -100,00 | 0 | |||||
| 2025-11-14 | 13F | Skopos Labs, Inc. | 0 | -100,00 | 0 | |||||
| 2025-11-12 | 13F | Transce3nd, LLC | 0 | -100,00 | 0 | -100,00 | ||||
| 2026-01-23 | 13F | Farther Finance Advisors, LLC | 1.916 | 11,79 | 119 | 16,67 | ||||
| 2026-01-29 | 13F | Sanctuary Advisors, LLC | 99.791 | -13,79 | 6.218 | -9,89 | ||||
| 2025-11-07 | 13F | Synovus Financial Corp | 0 | -100,00 | 0 | |||||
| 2026-02-10 | 13F | Spectrum Planning & Advisory Services Inc. | 15.620 | -1,27 | 973 | 3,18 | ||||
| 2026-02-12 | 13F | Mosley Wealth Management | 199.220 | 9,06 | 12.029 | 19,77 | ||||
| 2026-02-26 | 13F | TD Capital Management LLC | 1.365 | 0,00 | 85 | 4,94 | ||||
| 2026-02-12 | 13F | Triumph Capital Management | 11.134 | -1,44 | 694 | 2,97 | ||||
| 2026-01-14 | 13F | MeadowBrook Investment Advisors LLC | 2.509 | 0,00 | 156 | 4,70 | ||||
| 2026-01-30 | 13F | Sigma Planning Corp | 3.405 | 212 | ||||||
| 2026-02-17 | 13F | Private Advisor Group, LLC | 88.270 | 16,27 | 5.500 | 21,55 | ||||
| 2026-02-17 | 13F | Advisor Group Holdings, Inc. | 29.789 | -2,20 | 1.856 | 2,43 | ||||
| 2026-01-12 | 13F | VisionPoint Advisory Group, LLC | 5.124 | -2,79 | 319 | 1,59 | ||||
| 2026-01-21 | 13F | Raleigh Capital Management Inc. | 129.883 | 1,84 | 8.093 | 6,46 | ||||
| 2026-01-26 | 13F | Iams Wealth Management, Llc | 25.108 | -12,61 | 1.564 | -8,64 | ||||
| 2026-01-09 | 13F | First Heartland Consultants, Inc. | 7.197 | -1,76 | 448 | 2,75 | ||||
| 2026-02-10 | 13F | Argent Trust Co | 12.670 | -6,36 | 789 | -2,11 | ||||
| 2026-02-12 | 13F | Absolute Capital Management, LLC | 0 | -100,00 | 0 | |||||
| 2026-01-21 | 13F | Flagship Harbor Advisors, Llc | 16.418 | 1.023 | ||||||
| 2026-02-04 | 13F | Nwam Llc | 5.408 | 0,00 | 339 | 3,36 | ||||
| 2026-02-13 | 13F | Motiv8 Investments LLC | 77 | 0 | ||||||
| 2026-02-17 | 13F | Mpwm Advisory Solutions, Llc | 0 | -100,00 | 0 | |||||
| 2026-01-27 | 13F | Global Financial Private Client, LLC | 64.077 | 3,27 | 3.993 | 7,95 | ||||
| 2026-01-26 | 13F | Merit Financial Group, LLC | 3.431 | -87,30 | 214 | -86,77 | ||||
| 2025-11-14 | 13F | Maripau Wealth Management Llc | 0 | -100,00 | 0 | |||||
| 2026-02-06 | 13F | Axxcess Wealth Management, Llc | 203.070 | 137,04 | 12.653 | 147,81 | ||||
| 2025-11-14 | 13F | Two Sigma Investments, Lp | 0 | -100,00 | 0 | |||||
| 2026-02-12 | 13F | Richard W. Paul & Associates, LLC | 10.057 | -14,75 | 627 | -10,95 | ||||
| 2026-02-06 | 13F | Covestor Ltd | 649 | 14,46 | 0 | |||||
| 2026-02-13 | 13F | Integrated Wealth Concepts LLC | 3.654 | -1,03 | 228 | 3,18 | ||||
| 2026-02-17 | 13F | Legacy Wealth Partners, LLC | 68.406 | 4.262 | ||||||
| 2026-02-10 | 13F | Evolution Wealth Management Inc. | 10.111 | 161,13 | 630 | 173,91 | ||||
| 2026-02-19 | 13F | WealthPoint Financial, LLC | 25.052 | 1.561 | ||||||
| 2026-01-16 | 13F | Worth Financial Advisory Group, LLC | 35.303 | -1,04 | 2.200 | 3,43 | ||||
| 2026-02-17 | 13F | Gladstone Institutional Advisory LLC | 19.544 | 30,83 | 1.218 | 36,74 | ||||
| 2026-02-17 | 13F | NorthRock Partners, LLC | 5.540 | -19,30 | 345 | -15,65 | ||||
| 2026-02-12 | 13F | Hibernia Wealth Partners, LLC | 420.972 | 91,94 | 26.231 | 100,61 | ||||
| 2026-01-14 | 13F | True Vision MN LLC | 7.757 | 3,66 | 483 | 8,30 | ||||
| 2026-02-05 | 13F | Atria Investments Llc | 7.889 | -1,99 | 492 | 2,51 | ||||
| 2026-02-04 | 13F | Independent Advisor Alliance | 7.442 | 464 | ||||||
| 2026-02-18 | 13F/A | Virtue Capital Management, LLC | 3.488 | -88,38 | 217 | -74,41 | ||||
| 2026-01-16 | 13F | Aspire Private Capital, LLC | 205.449 | -4,52 | 12.802 | -0,19 | ||||
| 2026-02-13 | 13F | Landmark Wealth Management, Inc. | 271.382 | 0,44 | 16.910 | 4,99 | ||||
| 2026-01-21 | 13F | Stone House Investment Management, LLC | 951 | -0,83 | 59 | 3,51 | ||||
| 2026-02-17 | 13F | Royal Bank Of Canada | 12.587 | 15,45 | 784 | 20,62 | ||||
| 2026-02-09 | 13F | Hantz Financial Services, Inc. | 159 | 0,00 | 0 | |||||
| 2026-02-19 | 13F | Atomi Financial Group, Inc. | 6.552 | -1,55 | 408 | 3,03 | ||||
| 2026-01-09 | 13F | Capital Asset Advisory Services LLC | 10.023 | -16,68 | 629 | -12,27 | ||||
| 2026-02-12 | 13F | Commonwealth Equity Services, Llc | 8.938 | -5,90 | 557 | |||||
| 2026-02-13 | 13F | Novus Advisors, Llc | 56.229 | -0,92 | 3.504 | 3,58 | ||||
| 2026-02-09 | 13F | Annis Gardner Whiting Capital Advisors, LLC | 517 | 0,00 | 32 | 6,67 | ||||
| 2026-01-22 | 13F | Networth Advisors, LLC | 12 | 1 | ||||||
| 2026-01-13 | 13F | Dakota Wealth Management | 15.367 | 957 | ||||||
| 2025-11-05 | 13F | Lokken Investment Group LLC | 16.851 | -4,32 | 1.004 | 3,83 | ||||
| 2026-02-13 | 13F | Morgan Stanley | 48.155 | -2,77 | 3.001 | 1,63 | ||||
| 2026-01-13 | 13F | Sharkey, Howes & Javer | 97.171 | -27,73 | 6.055 | -24,46 | ||||
| 2026-01-21 | 13F | Apella Capital, LLC | 28.098 | 1,14 | 1.751 | 5,74 | ||||
| 2026-02-24 | 13F | Chelsea Counsel Co | 164 | 0,00 | 10 | 11,11 | ||||
| 2026-02-17 | 13F | Raymond James Financial Inc | 55.818 | 54,52 | 3.478 | 61,54 | ||||
| 2026-02-10 | 13F/A | Northwestern Mutual Wealth Management Co | 45.769 | 29,83 | 2.852 | 35,70 | ||||
| 2026-02-12 | 13F | M1 Capital Management LLC | 4.975 | 2,47 | 310 | 6,92 | ||||
| 2026-01-15 | 13F | SILVER OAK SECURITIES, Inc | 12.145 | 0,00 | 762 | 5,26 | ||||
| 2026-01-16 | 13F | Ronald Blue Trust, Inc. | 0 | -100,00 | 0 | |||||
| 2025-11-14 | 13F | Fort Point Capital Partners LLC | 0 | -100,00 | 0 | |||||
| 2026-02-13 | 13F | Aptus Capital Advisors, LLC | 0 | -100,00 | 0 |