Grundlæggende statistik
| Institutionelle ejere | 101 total, 101 long only, 0 short only, 0 long/short - change of 9,78% MRQ |
| Gennemsnitlig porteføljeallokering | 0.3664 % - change of -30,99% MRQ |
| Institutionelle aktier (lange) | 9.012.087 (ex 13D/G) - change of 0,54MM shares 6,39% MRQ |
| Institutionel værdi (lang) | $ 325.612 USD ($1000) |
Institutionelt ejerskab og aktionærer
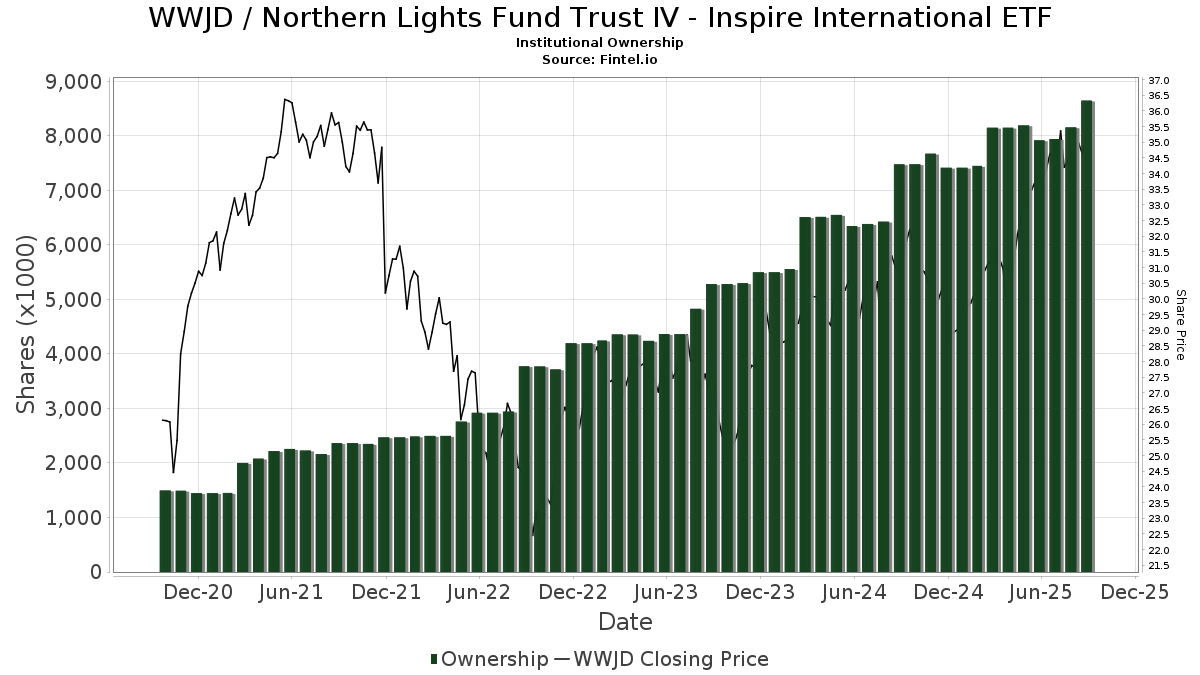
Northern Lights Fund Trust IV - Inspire International ETF (US:WWJD) har 101 institutionelle ejere og aktionærer, der har indsendt 13D/G- eller 13F-formularer til Securities Exchange Commission (SEC). Disse institutioner har i alt 9,012,087 aktier. Største aktionærer omfatter Inspire Advisors, LLC, Bare Financial Services, Inc, CWM Advisors, LLC, PAX Financial Group, LLC, Ambassador Advisors, LLC, Creative Financial Designs Inc /adv, Fiduciary Alliance LLC, Legacy Wealth Asset Management, LLC, Turning Point Benefit Group, Inc., and LPL Financial LLC .
Northern Lights Fund Trust IV - Inspire International ETF (ARCA:WWJD) institutionel ejerskabsstruktur viser aktuelle positioner i virksomheden efter institutioner og fonde, samt seneste ændringer i positionsstørrelse. Større aktionærer kan omfatte individuelle investorer, investeringsforeninger, hedgefonde eller institutioner. Skema 13D angiver, at investoren besidder (eller besidder) mere end 5 % af virksomheden og har til hensigt (eller har til hensigt at) aktivt at forfølge en ændring i forretningsstrategi. Skema 13G indikerer en passiv investering på over 5%.
The share price as of March 27, 2026 is 36,20 / share. Previously, on March 31, 2025, the share price was 30,74 / share. This represents an increase of 17,74% over that period.
Fondens stemningsscore
Fund Sentiment Score (fka Ownership Accumulation Score) finder de aktier, der bliver mest købt af fonde. Det er resultatet af en sofistikeret, multi-faktor kvantitativ model, der identificerer virksomheder med de højeste niveauer af institutionel akkumulering. Scoringsmodellen bruger en kombination af den samlede stigning i oplyste ejere, ændringerne i porteføljeallokeringer i disse ejere og andre målinger. Tallet går fra 0 til 100, hvor højere tal indikerer et højere niveau af akkumulering for sine jævnaldrende, og 50 er gennemsnittet.
Opdateringsfrekvens: Dagligt
Se Ownership Explorer, som giver en liste over højest rangerende virksomheder.
AI+ Ask Fintel’s AI assistant about Northern Lights Fund Trust IV - Inspire International ETF.
Select a question to share a public post with an AI-crafted answer.
Thinking of good questions…
Institutionel Put/Call-forhold
Ud over at indberette standardaktie- og gældsudstedelser skal institutter med mere end 100 mill. aktiver under forvaltning også oplyse deres put- og call-optionsbeholdninger. Da salgsoptioner generelt indikerer negativ stemning, og købsoptioner indikerer positiv stemning, kan vi få en fornemmelse af den overordnede institutionelle stemning ved at plotte forholdet mellem put og kald. Diagrammet til højre viser det historiske put/call-forhold for dette instrument.
Brug af Put/Call Ratio som en indikator for investorernes stemning overvinder en af de vigtigste mangler ved at bruge totalt institutionelt ejerskab, som er, at en betydelig mængde af aktiver under forvaltning investeres passivt for at spore indekser. Passivt forvaltede fonde køber typisk ikke optioner, så indikatoren for put/call-forholdet følger mere nøje følelsen af aktivt forvaltede fonde.
13F og NPORT arkivering
Detaljer om 13F-arkivering er gratis. Detaljer om NP-ansøgninger kræver et premium-medlemskab. Grønne rækker angiver nye positioner. Røde rækker angiver lukkede positioner. Klik på linket ikon for at se den fulde transaktionshistorik.
Opgrader
for at låse premium-data op og eksportere til Excel ![]() .
.
| Fil dato | Kilde | Investor | Type | Gennemsnitlig pris (Øst) |
Aktier | Δ Aktier (%) |
Rapporteret Værdi ($1000) |
Δ Værdi (%) |
Port Alloc (%) |
|
|---|---|---|---|---|---|---|---|---|---|---|
| 2026-01-12 | 13F | Legacy Wealth Asset Management, LLC | 265.462 | 3,21 | 9.684 | 6,77 | ||||
| 2026-02-09 | 13F | Keating Financial Advisory Services, Inc. | 32 | 1 | ||||||
| 2026-01-22 | 13F | Fiduciary Alliance LLC | 351.540 | 4,19 | 12.824 | 7,78 | ||||
| 2026-01-26 | 13F | PFG Investments, LLC | 8.276 | -7,62 | 302 | -4,44 | ||||
| 2026-02-13 | 13F | SRS Capital Advisors, Inc. | 168 | 6 | ||||||
| 2026-02-05 | 13F | Allworth Financial LP | 10 | 0 | ||||||
| 2026-02-09 | 13F | Sterling Investment Advisors, Ltd. | 15.600 | 0,00 | 569 | 3,45 | ||||
| 2026-02-04 | 13F | Frontier Asset Management, LLC | 94.978 | 6,35 | 3.465 | 10,00 | ||||
| 2026-02-13 | 13F | Inspire Advisors, LLC | 2.709.843 | 5,11 | 98.855 | 8,73 | ||||
| 2026-02-17 | 13F | Fmr Llc | 912 | -7,32 | 33 | -2,94 | ||||
| 2026-02-10 | 13F | Envestnet Asset Management Inc | 45.599 | 15,22 | 1.663 | 19,21 | ||||
| 2026-02-13 | 13F | Mosaic Family Wealth Partners, Llc | 0 | -100,00 | 0 | |||||
| 2026-01-07 | 13F | Sagespring Wealth Partners, Llc | 7.663 | 1,28 | 280 | 4,89 | ||||
| 2026-02-05 | 13F | Cambridge Investment Research Advisors, Inc. | 56.830 | 1,10 | 2 | 100,00 | ||||
| 2026-02-12 | 13F | Principal Securities, Inc. | 0 | -100,00 | 0 | |||||
| 2026-01-30 | 13F | Strategic Blueprint, LLC | 11.031 | 11,50 | 402 | 15,52 | ||||
| 2026-01-28 | 13F | Geneos Wealth Management Inc. | 3.095 | 55,37 | 113 | 60,00 | ||||
| 2026-01-23 | 13F | Westside Investment Management, Inc. | 1.958 | 0,00 | 71 | 2,90 | ||||
| 2026-02-13 | 13F | Ambassador Advisors, LLC | 441.252 | -1,12 | 16.097 | 2,28 | ||||
| 2026-02-17 | 13F | Advisory Services Network, LLC | 24.403 | 54,53 | 890 | 60,07 | ||||
| 2026-02-17 | 13F | LaSalle St. Investment Advisors, LLC | 7.808 | -4,40 | 0 | |||||
| 2026-03-04 | 13F | SHP Wealth Management | 2.401 | 88 | ||||||
| 2026-02-17 | 13F | Hilltop Holdings Inc. | 5.663 | 207 | ||||||
| 2026-02-02 | 13F | CX Institutional | 691 | 0 | ||||||
| 2026-02-03 | 13F | Winch Advisory Services, LLC | 299 | 1,36 | 11 | 0,00 | ||||
| 2026-03-25 | 13F | Mission Financial Group, LLC | 15.515 | 566 | ||||||
| 2026-02-13 | 13F | Gts Securities Llc | 34.034 | -30,57 | 1.242 | -28,18 | ||||
| 2026-02-06 | 13F | EverSource Wealth Advisors, LLC | 164.212 | 6,51 | 5.990 | 10,19 | ||||
| 2026-02-10 | 13F/A | Northwestern Mutual Wealth Management Co | 74.355 | 1,16 | 2.712 | 4,63 | ||||
| 2026-02-10 | 13F | Koss-Olinger Consulting, LLC | 14.446 | -11,41 | 527 | -5,72 | ||||
| 2026-02-11 | 13F | OneAscent Financial Services LLC | 132.010 | 46,92 | 4.816 | 51,99 | ||||
| 2026-02-11 | 13F | OneAscent Wealth Management LLC | 12.142 | 67,27 | 443 | 73,33 | ||||
| 2026-01-22 | 13F | Christian Investment Advisors, Inc. | 0 | -100,00 | 0 | |||||
| 2026-02-12 | 13F | Keel Point, LLC | 17.494 | -0,82 | 638 | 2,57 | ||||
| 2026-02-10 | 13F | IAG Wealth Partners, LLC | 224 | 0,00 | 8 | 14,29 | ||||
| 2026-02-12 | 13F | Jane Street Group, Llc | 14.070 | -32,31 | 513 | -30,01 | ||||
| 2026-02-13 | 13F | Colony Group, LLC | 121.831 | 8,20 | 4.444 | 11,94 | ||||
| 2026-02-11 | 13F | Schwallier Wealth Management LLC | 18.283 | 10,26 | 698 | 19,52 | ||||
| 2026-02-05 | 13F | Cornerstone Wealth Management, LLC | 5.653 | 206 | ||||||
| 2025-11-12 | 13F | Transce3nd, LLC | 0 | -100,00 | 0 | |||||
| 2026-01-15 | 13F | SILVER OAK SECURITIES, Inc | 130.896 | 4,19 | 4.783 | 7,95 | ||||
| 2026-02-13 | 13F | Morgan Stanley | 2.284 | -1,89 | 83 | 1,22 | ||||
| 2026-02-02 | 13F | Benjamin Edwards Inc | 17.125 | 3,78 | 625 | 7,40 | ||||
| 2026-02-13 | 13F | Clarity Asset Management, Inc. | 0 | -100,00 | 0 | |||||
| 2026-02-06 | 13F | IFP Advisors, Inc | 20.597 | 1,55 | 751 | 5,03 | ||||
| 2026-01-23 | 13F | Clear Creek Financial Management, LLC | 5.501 | 201 | ||||||
| 2026-01-26 | 13F | Nations Financial Group Inc, /ia/ /adv | 41.339 | 32,88 | 1.508 | 37,47 | ||||
| 2026-02-12 | 13F | Rossby Financial, LCC | 4.629 | -0,75 | 169 | 1,82 | ||||
| 2026-02-06 | 13F | Envestnet Portfolio Solutions, Inc. | 12.863 | 25,35 | 469 | 29,92 | ||||
| 2026-02-13 | 13F | SageOak Financial, LLC | 47.011 | 4,40 | 1.715 | 7,93 | ||||
| 2026-01-16 | 13F | HFG Wealth Management, LLC | 8.328 | -25,93 | 304 | -23,48 | ||||
| 2026-02-02 | 13F | AlphaStar Capital Management, LLC | 0 | -100,00 | 0 | |||||
| 2026-01-22 | 13F | Whitaker-Myers Wealth Managers, LTD. | 22.817 | 167,24 | 832 | 176,41 | ||||
| 2026-02-13 | 13F | Cornerstone Financial Management LLC | 25.599 | 934 | ||||||
| 2026-02-05 | 13F | PAX Financial Group, LLC | 450.289 | 1,94 | 16.427 | 5,46 | ||||
| 2026-02-10 | 13F | Goldman Sachs Group Inc | 224.428 | 1.029,37 | 8.187 | 1.069,57 | ||||
| 2025-11-07 | 13F | Wealthcare Advisory Partners LLC | 0 | -100,00 | 0 | |||||
| 2026-01-15 | 13F | Range Financial Group LLC | 60.905 | 5,89 | 2.222 | 9,52 | ||||
| 2026-02-11 | 13F | LPL Financial LLC | 248.941 | 37,06 | 9.081 | 41,78 | ||||
| 2026-02-17 | 13F | Cetera Investment Advisers | 28.526 | 9,23 | 1.041 | 12,92 | ||||
| 2026-02-13 | 13F | Stifel Financial Corp | 69.035 | 2.518 | ||||||
| 2026-01-23 | 13F | Assetmark, Inc | 158 | 0,00 | 6 | 0,00 | ||||
| 2026-02-13 | 13F | Kestra Advisory Services, LLC | 63.282 | 12,94 | 2.309 | 16,86 | ||||
| 2026-01-27 | 13F | Belpointe Asset Management LLC | 68.482 | 3,20 | 2.498 | 6,75 | ||||
| 2025-11-06 | 13F | Ameritas Advisory Services, LLC | 0 | -100,00 | 0 | -100,00 | ||||
| 2026-02-17 | 13F | Wealth Watch Advisors, INC | 302 | 5,59 | 11 | 10,00 | ||||
| 2026-01-26 | 13F | AE Wealth Management LLC | 44.981 | 31,92 | 1.641 | 36,44 | ||||
| 2026-02-17 | 13F | Harvest Investment Services, LLC | 10.373 | 5,57 | 378 | 9,25 | ||||
| 2026-02-17 | 13F | Aqr Capital Management Llc | 9.603 | 0,00 | 350 | 3,55 | ||||
| 2026-02-03 | 13F | Sound Financial Strategies Group, LLC | 100.524 | 2,84 | 3.667 | 6,41 | ||||
| 2026-02-17 | 13F | CWM Advisors, LLC | 456.363 | 0,90 | 16.648 | 4,38 | ||||
| 2026-02-18 | 13F | GWM Advisors LLC | 400 | 0,00 | 15 | 0,00 | ||||
| 2026-02-11 | 13F | Gateway Wealth Partners, LLC | 6.589 | 1,26 | 240 | 4,80 | ||||
| 2026-01-20 | 13F | AdvisorNet Financial, Inc | 222 | 0,00 | 8 | 14,29 | ||||
| 2026-02-04 | 13F | Pensionmark Financial Group, Llc | 83.924 | 11,33 | 3.062 | 15,16 | ||||
| 2026-02-17 | 13F | Raymond James Financial Inc | 36.138 | -39,16 | 1.318 | -37,06 | ||||
| 2026-01-16 | 13F | FNY Investment Advisers, LLC | 0 | -100,00 | 0 | |||||
| 2026-02-13 | 13F | Mml Investors Services, Llc | 9.962 | 27,08 | 363 | 31,52 | ||||
| 2026-01-05 | 13F | LifeGuide Financial Advisors, LLC | 50.163 | 4,83 | 1.840 | 12,00 | ||||
| 2026-02-11 | 13F | Ameritas Investment Partners, Inc. | 5.158 | 188 | ||||||
| 2026-01-30 | 13F | Simplicity Wealth,LLC | 12.168 | 20,15 | 444 | 24,09 | ||||
| 2026-02-12 | 13F | Commonwealth Equity Services, Llc | 89.814 | 0,81 | 3.276 | 109.100,00 | ||||
| 2026-01-29 | 13F | Camelot Portfolios, LLC | 30 | 1 | ||||||
| 2026-02-06 | 13F | Bare Financial Services, Inc | 513.235 | 2,60 | 18.723 | 6,13 | ||||
| 2026-02-17 | 13F | United Capital Financial Advisers, Llc | 97.748 | 30,68 | 3.566 | 35,19 | ||||
| 2026-01-28 | 13F | Bedel Financial Consulting, Inc. | 6.560 | -1,26 | 239 | 2,14 | ||||
| 2026-02-17 | 13F | Royal Bank Of Canada | 0 | -100,00 | 0 | |||||
| 2026-02-13 | 13F | Wells Fargo & Company/mn | 0 | -100,00 | 0 | |||||
| 2026-01-12 | 13F | Optivise Advisory Services LLC | 20.635 | 63,61 | 753 | 69,37 | ||||
| 2026-02-17 | 13F | TCG Advisory Services, LLC | 9.000 | 0,00 | 328 | 3,47 | ||||
| 2026-02-12 | 13F | Betterment LLC | 6.175 | 4,41 | 0 | |||||
| 2026-01-13 | 13F | Trust Point Inc. | 55.724 | 18,04 | 2.033 | 22,12 | ||||
| 2026-01-29 | 13F | Sanctuary Advisors, LLC | 42.471 | -16,45 | 1.549 | -13,56 | ||||
| 2026-01-27 | 13F | Security Financial Services, INC. | 55.893 | 4,90 | 2.039 | 8,46 | ||||
| 2026-01-26 | 13F | Cwm, Llc | 11.564 | 218,83 | 0 | |||||
| 2026-02-06 | 13F | Creative Financial Designs Inc /adv | 378.850 | -18,47 | 13.820 | -15,66 | ||||
| 2025-11-06 | 13F | Financial Advocates Investment Management | 0 | -100,00 | 0 | -100,00 | ||||
| 2026-01-29 | 13F | Courier Capital Llc | 6.007 | 219 | ||||||
| 2026-02-13 | 13F | Centaurus Financial, Inc. | 3.401 | 1,80 | 0 | |||||
| 2026-01-30 | 13F | Turning Point Benefit Group, Inc. | 264.746 | -6,61 | 9.658 | -4,04 | ||||
| 2026-02-17 | 13F | Jones Financial Companies Lllp | 34 | 1 | ||||||
| 2026-01-28 | 13F | N.E.W. Advisory Services LLC | 1.065 | 39 | ||||||
| 2026-02-13 | 13F | LGT Financial Advisors LLC | 0 | -100,00 | 0 | |||||
| 2026-02-05 | 13F | Moneywise, Inc. | 28.442 | 2,32 | 1.038 | 5,82 | ||||
| 2026-01-29 | 13F | UBS Group AG | 340 | 12 | ||||||
| 2026-02-17 | 13F | Advisor Group Holdings, Inc. | 56.902 | -6,41 | 2.077 | -2,54 | ||||
| 2026-02-06 | 13F | Plan A Wealth LLC | 90.396 | -4,77 | 3.298 | -1,49 | ||||
| 2026-02-05 | 13F | Atria Investments Llc | 59.523 | 1,84 | 2.171 | 5,34 | ||||
| 2026-02-13 | 13F | Smartleaf Asset Management LLC | 223 | 0,00 | 8 | 14,29 | ||||
| 2026-03-11 | 13F | Larry Mathis Financial Planning, LLC | 8.188 | 299 | ||||||
| 2026-02-09 | 13F | Harbour Investments, Inc. | 570 | 4,20 | 21 | 5,26 | ||||
| 2026-01-16 | 13F | Ronald Blue Trust, Inc. | 2.808 | 102 | ||||||
| 2026-02-09 | 13F | Strategic Equity Management | 34.177 | 4,81 | 1.247 | 8,44 | ||||
| 2026-01-26 | 13F | WorthPointe, LLC | 107.878 | 3.935 |