Grundlæggende statistik
| Institutionelle aktier (lange) | 36.854.992 - 6,00% (ex 13D/G) - change of 29,08MM shares 374,04% MRQ |
| Institutionel værdi (lang) | $ 23.957 USD ($1000) |
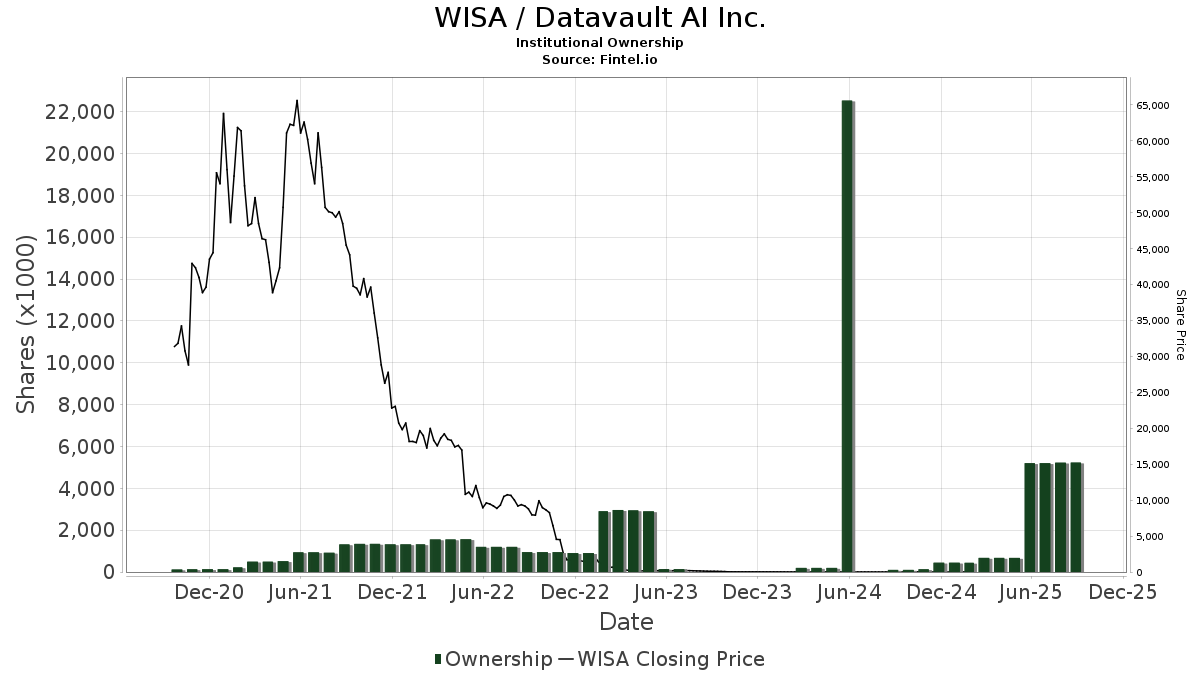
Institutionelt ejerskab og aktionærer
Datavault AI Inc. (US:WISA) har 81 institutionelle ejere og aktionærer, der har indsendt 13D/G- eller 13F-formularer til Securities Exchange Commission (SEC). Disse institutioner har i alt 36,854,992 aktier. Største aktionærer omfatter Vanguard Group Inc, State Street Corp, Jane Street Group, Llc, BlackRock, Inc., Morgan Stanley, Northern Trust Corp, UBS Group AG, XTX Topco Ltd, Vident Advisory, LLC, and LPL Financial LLC .
Datavault AI Inc. (NasdaqCM:WISA) institutionel ejerskabsstruktur viser aktuelle positioner i virksomheden efter institutioner og fonde, samt seneste ændringer i positionsstørrelse. Større aktionærer kan omfatte individuelle investorer, investeringsforeninger, hedgefonde eller institutioner. Skema 13D angiver, at investoren besidder (eller besidder) mere end 5 % af virksomheden og har til hensigt (eller har til hensigt at) aktivt at forfølge en ændring i forretningsstrategi. Skema 13G indikerer en passiv investering på over 5%.
Fondens stemningsscore
Fund Sentiment Score (fka Ownership Accumulation Score) finder de aktier, der bliver mest købt af fonde. Det er resultatet af en sofistikeret, multi-faktor kvantitativ model, der identificerer virksomheder med de højeste niveauer af institutionel akkumulering. Scoringsmodellen bruger en kombination af den samlede stigning i oplyste ejere, ændringerne i porteføljeallokeringer i disse ejere og andre målinger. Tallet går fra 0 til 100, hvor højere tal indikerer et højere niveau af akkumulering for sine jævnaldrende, og 50 er gennemsnittet.
Opdateringsfrekvens: Dagligt
Se Ownership Explorer, som giver en liste over højest rangerende virksomheder.
AI+ Ask Fintel’s AI assistant about Datavault AI Inc..
Select a question to share a public post with an AI-crafted answer.
Thinking of good questions…
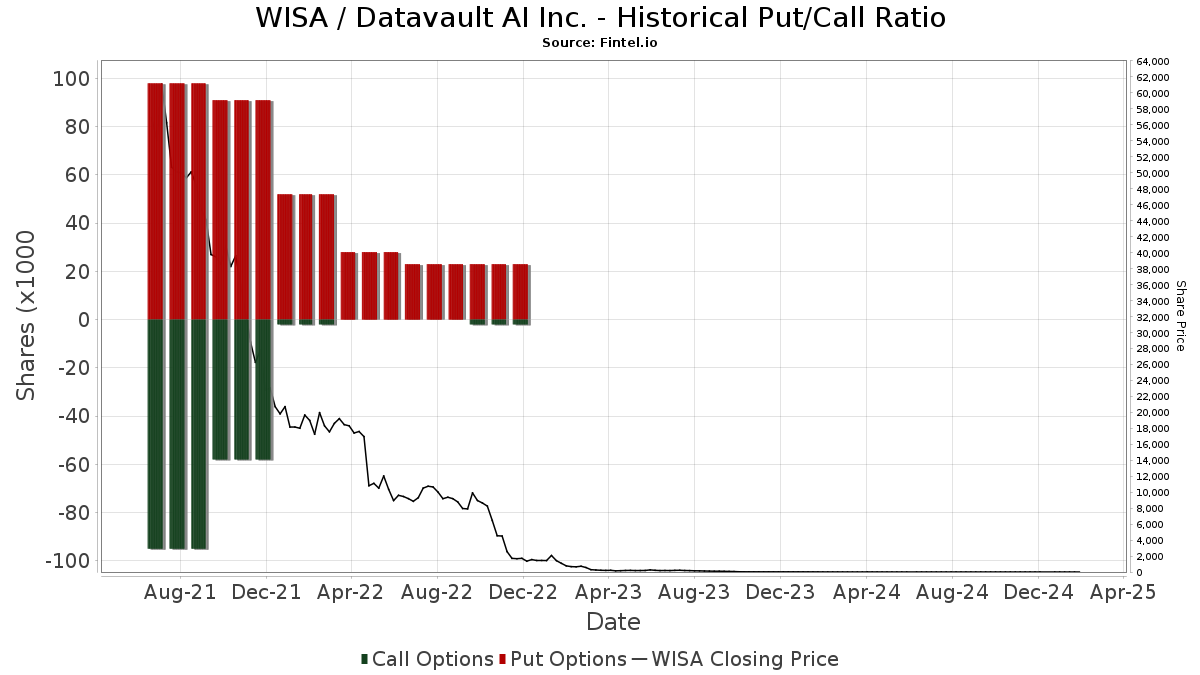
Institutionel Put/Call-forhold
Ud over at indberette standardaktie- og gældsudstedelser skal institutter med mere end 100 mill. aktiver under forvaltning også oplyse deres put- og call-optionsbeholdninger. Da salgsoptioner generelt indikerer negativ stemning, og købsoptioner indikerer positiv stemning, kan vi få en fornemmelse af den overordnede institutionelle stemning ved at plotte forholdet mellem put og kald. Diagrammet til højre viser det historiske put/call-forhold for dette instrument.
Brug af Put/Call Ratio som en indikator for investorernes stemning overvinder en af de vigtigste mangler ved at bruge totalt institutionelt ejerskab, som er, at en betydelig mængde af aktiver under forvaltning investeres passivt for at spore indekser. Passivt forvaltede fonde køber typisk ikke optioner, så indikatoren for put/call-forholdet følger mere nøje følelsen af aktivt forvaltede fonde.
13F og NPORT arkivering
Detaljer om 13F-arkivering er gratis. Detaljer om NP-ansøgninger kræver et premium-medlemskab. Grønne rækker angiver nye positioner. Røde rækker angiver lukkede positioner. Klik på linket ikon for at se den fulde transaktionshistorik.
Opgrader
for at låse premium-data op og eksportere til Excel ![]() .
.
| Fil dato | Kilde | Investor | Type | Gennemsnitlig pris (Øst) |
Aktier | Δ Aktier (%) |
Rapporteret Værdi ($1000) |
Δ Værdi (%) |
Port Alloc (%) |
|
|---|---|---|---|---|---|---|---|---|---|---|
| 2026-02-13 | 13F | Arete Wealth Advisors, LLC | 90.000 | 0 | ||||||
| 2026-02-04 | 13F | Leicht Financial Planning & Wealth Management, Inc. | 19.780 | 13 | ||||||
| 2026-02-17 | 13F | Qube Research & Technologies Ltd | 340.736 | 222 | ||||||
| 2026-01-12 | 13F | Wealth Management Partners, LLC | 0 | -100,00 | 0 | -100,00 | ||||
| 2026-02-18 | 13F | Vident Advisory, LLC | 392.114 | 255 | ||||||
| 2026-02-12 | 13F | Marex Group plc | 180.000 | -10,88 | 117 | -46,82 | ||||
| 2026-02-04 | 13F | Tsfg, Llc | 0 | -100,00 | 0 | |||||
| 2026-02-12 | 13F | Granite Islands Private Wealth, Llc | 13.000 | 8 | ||||||
| 2026-02-11 | 13F | Waddell & Associates, Llc | 23.696 | 15 | ||||||
| 2026-02-14 | 13F | Berkshire Asset Management Llc/pa | 10.000 | 7 | ||||||
| 2026-01-30 | 13F | Laurel Wealth Advisors LLC | 20 | 0 | ||||||
| 2026-02-17 | 13F | Advisor Group Holdings, Inc. | 19.929 | 3.885,80 | 13 | |||||
| 2025-10-29 | 13F | AMH Equity Ltd | 99.200 | 108 | ||||||
| 2026-01-30 | 13F | Wealthfront Advisers Llc | 15.944 | 10 | ||||||
| 2026-01-20 | 13F/A | Miller Wealth Advisors, Llc | 882 | 1 | ||||||
| 2026-02-13 | 13F | MAI Capital Management | 2.000 | 1 | ||||||
| 2026-02-09 | 13F | Geode Capital Management, Llc | 0 | -100,00 | 0 | -100,00 | ||||
| 2026-01-29 | 13F | UBS Group AG | 512.379 | 128,74 | 334 | 36,89 | ||||
| 2026-02-17 | 13F | Advisory Services Network, LLC | 0 | -100,00 | 0 | -100,00 | ||||
| 2025-11-14 | 13F | Hrt Financial Lp | 0 | -100,00 | 0 | |||||
| 2026-04-13 | 13F | Creative Financial Designs Inc /adv | 6.391 | 0,00 | 4 | -25,00 | ||||
| 2026-02-06 | 13F | Pnc Financial Services Group, Inc. | 0 | -100,00 | 0 | |||||
| 2026-02-13 | 13F | American Century Companies Inc | 24.402 | 16 | ||||||
| 2026-02-11 | 13F | Franklin Resources Inc | 79.132 | 52 | ||||||
| 2026-02-17 | 13F | Balyasny Asset Management Llc | 20.498 | 13 | ||||||
| 2026-02-17 | 13F | Two Sigma Securities, Llc | 15.104 | 10 | ||||||
| 2026-02-13 | 13F | State Street Corp | 10.064.089 | 51.505,42 | 6.563 | 31.147,62 | ||||
| 2026-02-17 | 13F | Cetera Investment Advisers | 121.486 | 668,90 | 79 | 364,71 | ||||
| 2026-02-10 | 13F | Bank of New York Mellon Corp | 25.002 | 16 | ||||||
| 2026-02-17 | 13F | Fmr Llc | 100 | 0 | ||||||
| 2026-01-29 | 13F | Almanack Investment Partners, LLC. | 0 | -100,00 | 0 | -100,00 | ||||
| 2026-02-04 | 13F | Investors Asset Management Of Georgia Inc /ga/ /adv | 11.000 | 7 | ||||||
| 2026-02-12 | 13F | Stonebridge Capital Advisors LLC | 55.000 | 175,00 | 36 | 66,67 | ||||
| 2026-02-17 | 13F | EFG International AG | 9.500 | 6 | ||||||
| 2026-02-11 | 13F | Group One Trading, L.p. | 0 | -100,00 | 0 | |||||
| 2026-02-03 | 13F | SBI Securities Co., Ltd. | 141 | -2,08 | 0 | |||||
| 2026-02-10 | 13F | Bnp Paribas Arbitrage, Sa | 0 | -100,00 | 0 | -100,00 | ||||
| 2026-02-12 | 13F | Wedbush Securities Inc | 10.000 | 0,00 | 0 | |||||
| 2026-02-13 | 13F | Charles Schwab Investment Management Inc | 174.967 | 114 | ||||||
| 2026-02-17 | 13F | Bank Of America Corp /de/ | 186.275 | 24.736,67 | 121 | |||||
| 2026-02-17 | 13F | Anson Funds Management LP | 0 | -100,00 | 0 | -100,00 | ||||
| 2026-02-17 | 13F | Tower Research Capital LLC (TRC) | 700 | 0 | ||||||
| 2026-02-13 | 13F | Hurley Capital, LLC | 2.016 | 1 | ||||||
| 2026-02-17 | 13F | National Asset Management, Inc. | 0 | -100,00 | 0 | -100,00 | ||||
| 2026-02-10 | 13F | Madison Wealth Partners, Inc | 26.978 | 18 | ||||||
| 2026-02-11 | 13F | Buckingham Strategic Partners | 0 | -100,00 | 0 | -100,00 | ||||
| 2026-02-17 | 13F | Millennium Management Llc | 88.616 | 58 | ||||||
| 2026-04-10 | 13F | DKM Wealth Management, Inc. | 10.000 | 0,00 | 6 | 0,00 | ||||
| 2026-02-11 | 13F | Cerity Partners LLC | 69.347 | 45 | ||||||
| 2026-02-13 | 13F | Victory Capital Management Inc | 27.289 | 18 | ||||||
| 2026-01-29 | 13F | Verdence Capital Advisors LLC | 0 | -100,00 | 0 | -100,00 | ||||
| 2025-11-12 | 13F | CIBC Bancorp USA Inc. | 16.000 | 17 | ||||||
| 2026-02-17 | 13F | XTX Topco Ltd | 444.240 | 290 | ||||||
| 2026-01-28 | 13F | SP Asset Management LLC | 10.000 | 0,00 | 7 | -40,00 | ||||
| 2026-04-15 | 13F | Valley National Advisers Inc | 17.100 | 612,50 | 0 | |||||
| 2026-01-13 | 13F | Synergy Financial Management, LLC | 52.110 | -57,43 | 34 | -75,19 | ||||
| 2025-10-31 | 13F | PFG Investments, LLC | 0 | -100,00 | 0 | -100,00 | ||||
| 2026-02-05 | 13F | Cambridge Investment Research Advisors, Inc. | 0 | -100,00 | 0 | |||||
| 2026-02-13 | 13F | Rafferty Asset Management, LLC | 22.083 | 14 | ||||||
| 2026-02-17 | 13F | Scientech Research LLC | 275.734 | 180 | ||||||
| 2026-02-13 | 13F | Nicolet Advisory Services, Llc | 0 | -100,00 | 0 | -100,00 | ||||
| 2026-01-29 | 13F | Ashton Thomas Private Wealth, LLC | 15.000 | 10 | ||||||
| 2026-02-09 | 13F | Jefferies Financial Group Inc. | 30.066 | 20 | ||||||
| 2026-02-17 | 13F | Jones Financial Companies Lllp | 78.415 | 51 | ||||||
| 2026-04-20 | 13F | Sowell Financial Services LLC | 19.000 | 0,00 | 12 | -8,33 | ||||
| 2026-02-13 | 13F | Citigroup Inc | 194.042 | 137,06 | 127 | 41,57 | ||||
| 2026-02-11 | 13F | Jpmorgan Chase & Co | 66.627 | -76,04 | 43 | -85,81 | ||||
| 2026-02-11 | 13F | LPL Financial LLC | 341.387 | 223 | ||||||
| 2026-01-28 | 13F | HB Wealth Management, LLC | 20.000 | 13 | ||||||
| 2026-01-28 | 13F | Hoey Investments, Inc | 10 | 0,00 | 0 | |||||
| 2026-02-12 | 13F | StoneX Group Inc. | 80.000 | 52 | ||||||
| 2026-04-17 | 13F/A | Capital Investment Advisors, LLC | 10.500 | 6 | ||||||
| 2026-02-13 | 13F | Mariner, LLC | 114.190 | 1.019,51 | 74 | 572,73 | ||||
| 2026-02-10 | 13F | Goldman Sachs Group Inc | 29.500 | 19 | ||||||
| 2026-02-12 | 13F | Jane Street Group, Llc | 4.483.074 | 2.923 | ||||||
| 2026-04-13 | 13F | IFP Advisors, Inc | 0 | -100,00 | 0 | -100,00 | ||||
| 2026-04-13 | 13F | Massmutual Trust Co Fsb/adv | 3.000 | 2 | ||||||
| 2026-02-10 | 13F/A | Northwestern Mutual Wealth Management Co | 60 | 0 | ||||||
| 2026-01-30 | 13F | American Capital Advisory, LLC | 1.000 | -90,04 | 1 | -100,00 | ||||
| 2026-01-23 | 13F | Avion Wealth | 1.000 | 0 | ||||||
| 2026-02-13 | 13F | Wells Fargo & Company/mn | 50.000 | -1,85 | 33 | -41,82 | ||||
| 2026-04-08 | 13F | Wealth Enhancement Advisory Services, Llc | 28.403 | 20 | ||||||
| 2026-02-02 | 13F | Cornerstone Planning Group LLC | 0 | -100,00 | 0 | |||||
| 2026-04-16 | 13F | SG Americas Securities, LLC | 17.101 | 0 | ||||||
| 2026-02-12 | 13F | Commonwealth Equity Services, Llc | 0 | -100,00 | 0 | |||||
| 2026-01-22 | 13F | Apollon Wealth Management, LLC | 22.000 | 14 | ||||||
| 2026-02-17 | 13F | Prelude Capital Management, Llc | 0 | -100,00 | 0 | -100,00 | ||||
| 2026-01-29 | 13F | Vanguard Group Inc | 11.819.663 | 895,45 | 7.706 | 495,52 | ||||
| 2026-02-13 | 13F | Diametric Capital, LP | 0 | -100,00 | 0 | -100,00 | ||||
| 2026-02-17 | 13F | Raymond James Financial Inc | 75.869 | 15,87 | 49 | -30,99 | ||||
| 2026-01-29 | 13F | Dupree Financial Group, LLC | 15.000 | 10 | ||||||
| 2026-01-16 | 13F | FNY Investment Advisers, LLC | 0 | -100,00 | 0 | |||||
| 2026-02-17 | 13F | Northern Trust Corp | 562.341 | 656,15 | 367 | 351,85 | ||||
| 2026-02-12 | 13F | CIBC Private Wealth Group, LLC | 0 | -100,00 | 0 | -100,00 | ||||
| 2026-02-13 | 13F | OMERS ADMINISTRATION Corp | 64.200 | 42 | ||||||
| 2026-02-13 | 13F | Morgan Stanley | 773.763 | 38.549,50 | 505 | 25.100,00 | ||||
| 2026-02-17 | 13F | Creative Planning | 114.187 | 74 | ||||||
| 2026-01-30 | 13F | Us Bancorp \de\ | 15.306 | 10 | ||||||
| 2026-01-23 | 13F | Clear Creek Financial Management, LLC | 68.136 | 44 | ||||||
| 2026-02-13 | 13F | Barclays Plc | 9.053 | -96,19 | 6 | -98,07 | ||||
| 2026-02-12 | 13F | BlackRock, Inc. | 4.100.984 | 2.248,96 | 2.674 | 1.307,37 | ||||
| 2026-02-18 | 13F | GWM Advisors LLC | 0 | -100,00 | 0 | -100,00 | ||||
| 2026-02-17 | 13F | Royal Bank Of Canada | 5.771 | 4 | ||||||
| 2026-04-07 | 13F | CoreCap Advisors, LLC | 60 | 0,00 | 0 | |||||
| 2026-02-17 | 13F | Susquehanna International Group, Llp | 41.304 | 27 |
Other Listings
| US:DVLT | 0,74 $ |