Grundlæggende statistik
| Institutionelle ejere | 124 total, 124 long only, 0 short only, 0 long/short - change of 9,73% MRQ |
| Gennemsnitlig porteføljeallokering | 0.1592 % - change of 8,73% MRQ |
| Institutionelle aktier (lange) | 6.070.769 (ex 13D/G) - change of -0,01MM shares -0,18% MRQ |
| Institutionel værdi (lang) | $ 368.729 USD ($1000) |
Institutionelt ejerskab og aktionærer
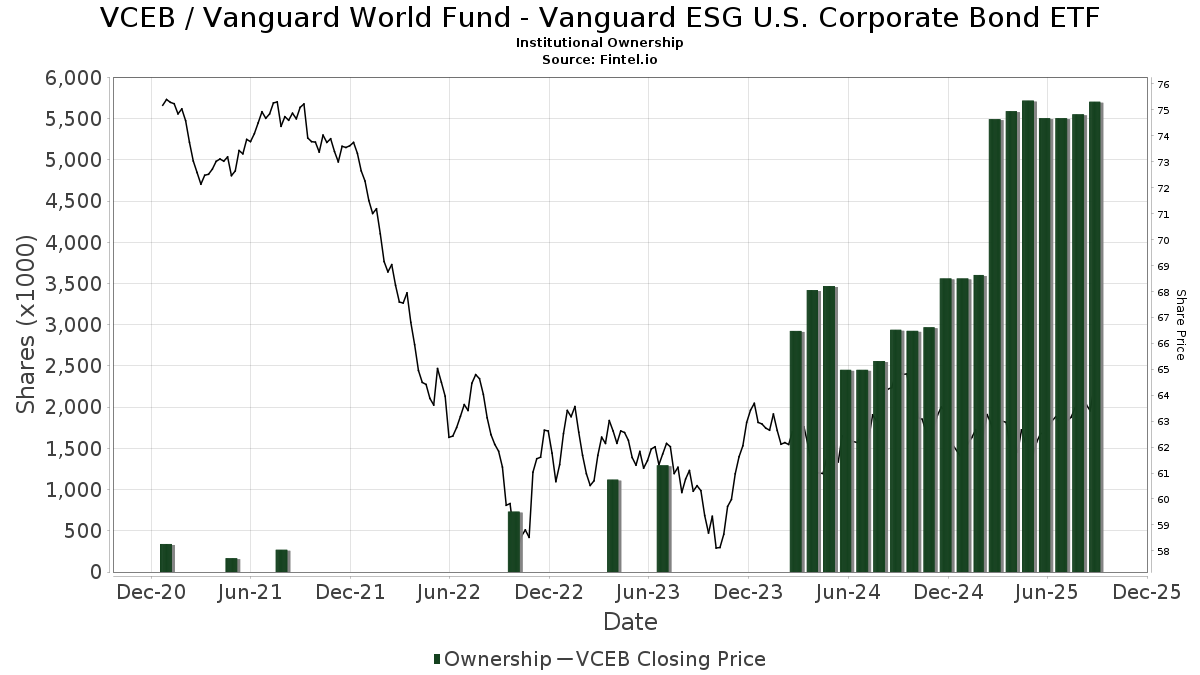
Vanguard World Fund - Vanguard ESG U.S. Corporate Bond ETF (US:VCEB) har 124 institutionelle ejere og aktionærer, der har indsendt 13D/G- eller 13F-formularer til Securities Exchange Commission (SEC). Disse institutioner har i alt 6,070,769 aktier. Største aktionærer omfatter Vanguard Group Inc, Varma Mutual Pension Insurance Co, Truist Financial Corp, Envestnet Asset Management Inc, Hanson & Doremus Investment Management, SageView Advisory Group, LLC, DeDora Capital, Inc., IMA Wealth, Inc., GWM Advisors LLC, and Modera Wealth Management, LLC .
Vanguard World Fund - Vanguard ESG U.S. Corporate Bond ETF (BATS:VCEB) institutionel ejerskabsstruktur viser aktuelle positioner i virksomheden efter institutioner og fonde, samt seneste ændringer i positionsstørrelse. Større aktionærer kan omfatte individuelle investorer, investeringsforeninger, hedgefonde eller institutioner. Skema 13D angiver, at investoren besidder (eller besidder) mere end 5 % af virksomheden og har til hensigt (eller har til hensigt at) aktivt at forfølge en ændring i forretningsstrategi. Skema 13G indikerer en passiv investering på over 5%.
The share price as of March 6, 2026 is 63,43 / share. Previously, on March 7, 2025, the share price was 62,75 / share. This represents an increase of 1,08% over that period.
Fondens stemningsscore
Fund Sentiment Score (fka Ownership Accumulation Score) finder de aktier, der bliver mest købt af fonde. Det er resultatet af en sofistikeret, multi-faktor kvantitativ model, der identificerer virksomheder med de højeste niveauer af institutionel akkumulering. Scoringsmodellen bruger en kombination af den samlede stigning i oplyste ejere, ændringerne i porteføljeallokeringer i disse ejere og andre målinger. Tallet går fra 0 til 100, hvor højere tal indikerer et højere niveau af akkumulering for sine jævnaldrende, og 50 er gennemsnittet.
Opdateringsfrekvens: Dagligt
Se Ownership Explorer, som giver en liste over højest rangerende virksomheder.
AI+ Ask Fintel’s AI assistant about Vanguard World Fund - Vanguard ESG U.S. Corporate Bond ETF.
Select a question to share a public post with an AI-crafted answer.
Thinking of good questions…
Institutionel Put/Call-forhold
Ud over at indberette standardaktie- og gældsudstedelser skal institutter med mere end 100 mill. aktiver under forvaltning også oplyse deres put- og call-optionsbeholdninger. Da salgsoptioner generelt indikerer negativ stemning, og købsoptioner indikerer positiv stemning, kan vi få en fornemmelse af den overordnede institutionelle stemning ved at plotte forholdet mellem put og kald. Diagrammet til højre viser det historiske put/call-forhold for dette instrument.
Brug af Put/Call Ratio som en indikator for investorernes stemning overvinder en af de vigtigste mangler ved at bruge totalt institutionelt ejerskab, som er, at en betydelig mængde af aktiver under forvaltning investeres passivt for at spore indekser. Passivt forvaltede fonde køber typisk ikke optioner, så indikatoren for put/call-forholdet følger mere nøje følelsen af aktivt forvaltede fonde.
13F og NPORT arkivering
Detaljer om 13F-arkivering er gratis. Detaljer om NP-ansøgninger kræver et premium-medlemskab. Grønne rækker angiver nye positioner. Røde rækker angiver lukkede positioner. Klik på linket ikon for at se den fulde transaktionshistorik.
Opgrader
for at låse premium-data op og eksportere til Excel ![]() .
.
| Fil dato | Kilde | Investor | Type | Gennemsnitlig pris (Øst) |
Aktier | Δ Aktier (%) |
Rapporteret Værdi ($1000) |
Δ Værdi (%) |
Port Alloc (%) |
|
|---|---|---|---|---|---|---|---|---|---|---|
| 2026-02-13 | 13F | Kestra Advisory Services, LLC | 345 | 22 | ||||||
| 2026-02-17 | 13F | Royal Bank Of Canada | 17.787 | 3,35 | 1.132 | 2,44 | ||||
| 2026-02-11 | 13F | Cerity Partners LLC | 80.648 | 17,85 | 5.132 | 16,80 | ||||
| 2026-01-26 | 13F | Level Financial Advisors, Inc. | 24.529 | 27,90 | 1.561 | 26,73 | ||||
| 2026-02-13 | 13F | American Investment Services, Inc. | 6.578 | 1,84 | 419 | 0,97 | ||||
| 2026-01-12 | 13F | AllSquare Wealth Management LLC | 564 | 0,00 | 36 | 2,86 | ||||
| 2026-02-17 | 13F | Raymond James Financial Inc | 7.222 | -76,31 | 460 | -76,55 | ||||
| 2026-02-06 | 13F | Keudell/Morrison Wealth Management | 0 | -100,00 | 0 | |||||
| 2026-01-29 | 13F | RMG Wealth Management LLC | 0 | -100,00 | 0 | |||||
| 2026-02-11 | 13F | Jpmorgan Chase & Co | 13.556 | -66,68 | 863 | -66,99 | ||||
| 2026-01-30 | 13F | Wealthfront Advisers Llc | 87.633 | 2,87 | 5.576 | 1,98 | ||||
| 2026-02-11 | 13F | Ameritas Investment Partners, Inc. | 10.862 | 691 | ||||||
| 2026-02-17 | 13F | Blair William & Co/il | 1.174 | 75 | ||||||
| 2026-02-02 | 13F | Varma Mutual Pension Insurance Co | 1.100.000 | 0,00 | 69.993 | -0,89 | ||||
| 2026-02-03 | 13F | Black Diamond Financial, LLC | 4.219 | -0,54 | 268 | -1,47 | ||||
| 2026-02-17 | 13F | Banco Bilbao Vizcaya Argentaria, S.a. | 0 | -100,00 | 0 | |||||
| 2026-01-12 | 13F | Skyline Advisors, Inc. | 5.032 | 42,55 | 320 | 41,59 | ||||
| 2026-01-29 | 13F | Equita Financial Network, Inc. | 17.728 | 37,11 | 1.128 | 35,90 | ||||
| 2026-01-14 | 13F | Tradewinds Capital Management, LLC | 142 | 1,43 | 9 | 12,50 | ||||
| 2026-02-09 | 13F | Harbour Investments, Inc. | 22.276 | 6,22 | 1.417 | 5,27 | ||||
| 2025-11-14 | 13F | Old Mission Capital Llc | 0 | -100,00 | 0 | |||||
| 2026-01-22 | 13F | DeDora Capital, Inc. | 162.173 | 6,26 | 10.319 | 5,32 | ||||
| 2026-02-11 | 13F | Curio Wealth, Llc | 11.017 | 0,00 | 703 | -0,71 | ||||
| 2026-02-12 | 13F | Bank Of Montreal /can/ | 72 | 0,00 | 5 | 0,00 | ||||
| 2026-02-13 | 13F/A | New England Private Wealth Advisors LLC | 19.877 | 27,07 | 1.265 | 25,90 | ||||
| 2026-02-10 | 13F | Savant Capital, LLC | 5.542 | -45,38 | 353 | -45,93 | ||||
| 2026-01-20 | 13F | Hanson & Doremus Investment Management | 189.845 | 8,90 | 12 | 9,09 | ||||
| 2026-01-23 | 13F | Farther Finance Advisors, LLC | 2.733 | 174 | ||||||
| 2026-02-12 | 13F | Commonwealth Equity Services, Llc | 5.692 | -65,68 | 362 | 36.100,00 | ||||
| 2026-02-17 | 13F | Modern Wealth Management, LLC | 6.683 | 425 | ||||||
| 2026-02-17 | 13F | Advisor Group Holdings, Inc. | 11.008 | -10,93 | 700 | -11,50 | ||||
| 2026-02-17 | 13F | Townsend Financial Planning, LLC | 7.370 | 469 | ||||||
| 2026-03-02 | 13F | Reflection Asset Management | 1.204 | 77 | ||||||
| 2026-02-05 | 13F | Allworth Financial LP | 18.216 | -0,12 | 1.159 | -0,94 | ||||
| 2026-02-13 | 13F | Stifel Financial Corp | 5.881 | 10,01 | 374 | 9,04 | ||||
| 2026-02-13 | 13F | Mml Investors Services, Llc | 8.654 | 9,17 | 551 | 8,27 | ||||
| 2026-02-18 | 13F | GWM Advisors LLC | 147.734 | 3,05 | 9.400 | 2,14 | ||||
| 2026-02-13 | 13F | Morgan Stanley | 938 | 1,19 | 60 | 0,00 | ||||
| 2026-01-09 | 13F | Carr Financial Group Corp | 7.293 | 1,07 | 464 | 0,22 | ||||
| 2026-02-05 | 13F | Cambridge Investment Research Advisors, Inc. | 47.569 | 32,46 | 3 | 50,00 | ||||
| 2026-02-10 | 13F | Envestnet Asset Management Inc | 259.600 | 0,95 | 16.518 | 0,05 | ||||
| 2026-01-23 | 13F | Financial Futures Ltd Liability Co. | 3.320 | -19,63 | 211 | -20,38 | ||||
| 2026-01-28 | 13F | N.E.W. Advisory Services LLC | 1.546 | 98 | ||||||
| 2026-02-11 | 13F | Clarity Wealth Development LLC | 14.285 | 5,99 | 909 | 4,01 | ||||
| 2026-01-23 | 13F | Charter Oak Capital Management, LLC | 10.187 | 24,67 | 648 | 23,66 | ||||
| 2026-02-09 | 13F | White Lighthouse Investment Management Inc. | 5.674 | 31,13 | 361 | 30,32 | ||||
| 2026-01-15 | 13F | Essential Planning, LLC. | 6.335 | 0,16 | 403 | -0,74 | ||||
| 2026-02-06 | 13F | Pnc Financial Services Group, Inc. | 7.915 | 0,00 | 504 | -0,98 | ||||
| 2026-01-16 | 13F | Verus Wealth Management, Llc | 8.490 | 1,98 | 540 | 1,12 | ||||
| 2026-02-27 | 13F | Strategic Investment Solutions, Inc. /IL | 133 | 0,76 | 8 | 0,00 | ||||
| 2026-02-17 | 13F | Cetera Investment Advisers | 5.883 | -4,91 | 374 | -5,79 | ||||
| 2026-02-05 | 13F | Novare Capital Management Llc | 12.944 | -1,12 | 824 | -2,02 | ||||
| 2025-10-01 | 13F | Caldwell Trust Co | 0 | -100,00 | 0 | -100,00 | ||||
| 2026-01-27 | 13F | Meritage Portfolio Management | 11.338 | 0,00 | 721 | -0,83 | ||||
| 2026-01-27 | 13F | Human Investing LLC | 64.811 | 3,96 | 4.124 | 3,02 | ||||
| 2026-02-17 | 13F | SageView Advisory Group, LLC | 174.160 | 1,49 | 11.082 | 0,59 | ||||
| 2026-01-15 | 13F | Stewardship Advisors, LLC | 77.465 | -18,49 | 4.929 | -19,21 | ||||
| 2026-02-06 | 13F | Summit Wealth Group, LLC | 5.602 | 0,00 | 356 | -0,84 | ||||
| 2025-11-12 | 13F | Willow Creek Wealth Management Inc. | 9.282 | 6,36 | 596 | 7,59 | ||||
| 2026-01-13 | 13F | West Financial Advisors, LLC | 9.793 | 8,86 | 623 | 7,97 | ||||
| 2026-02-13 | 13F | Vontobel Holding Ltd. | 15.495 | 986 | ||||||
| 2026-02-17 | 13F | Bank Of America Corp /de/ | 25.715 | -2,64 | 1.636 | -3,48 | ||||
| 2026-01-20 | 13F | Princeton Global Asset Management LLC | 1.355 | -0,15 | 86 | -1,15 | ||||
| 2026-02-13 | 13F | First Trust Advisors Lp | 3.815 | 1,52 | 243 | 0,41 | ||||
| 2026-02-13 | 13F | Wells Fargo & Company/mn | 25.652 | 3,14 | 1.632 | 2,26 | ||||
| 2026-01-26 | 13F | XY Planning Network, Inc. | 7.987 | 97,06 | 508 | 98,44 | ||||
| 2026-01-28 | 13F | Fairway Wealth LLC | 1.906 | 0,00 | 121 | -0,82 | ||||
| 2026-01-21 | 13F | Modera Wealth Management, LLC | 145.425 | -2,86 | 9.253 | -3,71 | ||||
| 2026-01-21 | 13F | Flagship Harbor Advisors, Llc | 66 | 4 | ||||||
| 2026-02-18 | 13F | EP Wealth Advisors, Inc. | 10.471 | 666 | ||||||
| 2026-01-27 | 13F | Joel Adams & Associates, Inc. | 5.263 | 0,40 | 335 | -0,60 | ||||
| 2026-01-21 | 13F | Crux Wealth Advisors | 6.160 | 5,43 | 392 | 4,27 | ||||
| 2026-02-19 | 13F | Birchwood Financial Partners, Inc. | 815 | 52 | ||||||
| 2026-01-26 | 13F | Cwm, Llc | 10.662 | -1,61 | 1 | |||||
| 2026-01-12 | 13F | Farrell Financial LLC | 16.286 | 1,29 | 1.036 | 0,39 | ||||
| 2026-02-03 | 13F | Drucker Wealth 3.0, LLC | 4.405 | -9,55 | 280 | -10,26 | ||||
| 2026-02-13 | 13F | Bragg Financial Advisors, Inc | 5.935 | 21,49 | 378 | 20,45 | ||||
| 2026-01-12 | 13F | Scott Capital Advisors, LLC | 16.864 | 10,26 | 1.073 | 9,49 | ||||
| 2026-02-11 | 13F | Francis Financial, Inc. | 47.840 | 45,20 | 3.044 | 43,92 | ||||
| 2026-01-26 | 13F | Whittier Trust Co | 13.411 | 30.379,55 | 855 | 42.600,00 | ||||
| 2026-02-03 | 13F | Pearl Planning LLC | 36.197 | 2.303 | ||||||
| 2026-02-12 | 13F | Betterment LLC | 10.300 | 56,39 | 1 | |||||
| 2026-01-28 | 13F | Team Hewins, LLC | 37.032 | 4,08 | 2.356 | 3,15 | ||||
| 2026-02-11 | 13F | Milestone Investment Advisors LLC | 2.990 | -0,27 | 190 | -1,04 | ||||
| 2026-02-17 | 13F | WFA of San Diego, LLC | 0 | -100,00 | 0 | |||||
| 2026-01-23 | 13F | Natural Investments, Llc | 0 | -100,00 | 0 | |||||
| 2025-10-15 | 13F | Stephens Consulting, LLC | 0 | -100,00 | 0 | -100,00 | ||||
| 2026-02-13 | 13F | Sofos Investments, Inc. | 1.368 | 4,99 | 87 | 4,82 | ||||
| 2026-01-22 | 13F | Bartlett & Co. Wealth Management Llc | 13.716 | 20,44 | 873 | 19,29 | ||||
| 2026-01-22 | 13F | Bfsg, Llc | 116 | 0,00 | 7 | 0,00 | ||||
| 2026-01-21 | 13F | Apella Capital, LLC | 14.931 | 950 | ||||||
| 2026-02-03 | 13F | Grove Street Fiduciary, LLC | 3.861 | 0,00 | 246 | -0,81 | ||||
| 2026-02-02 | 13F | Truist Financial Corp | 281.610 | 2,80 | 17.919 | 1,88 | ||||
| 2026-03-04 | 13F | Rehmann Capital Advisory Group | 7.612 | 1,34 | 484 | 0,41 | ||||
| 2026-02-12 | 13F | Steward Partners Investment Advisory, Llc | 805 | 1,51 | 51 | 2,00 | ||||
| 2026-02-09 | 13F | Choate Investment Advisors | 7.181 | 457 | ||||||
| 2026-02-17 | 13F | Private Advisor Group, LLC | 9.179 | 7,44 | 584 | 6,57 | ||||
| 2026-02-06 | 13F | Keystone Financial Group | 0 | -100,00 | 0 | |||||
| 2026-01-29 | 13F | Vanguard Group Inc | 1.848.378 | 11,51 | 117.612 | 10,52 | ||||
| 2025-11-14 | 13F | Jane Street Group, Llc | 0 | -100,00 | 0 | |||||
| 2026-02-10 | 13F | Blueline Advisors Llc | 3.706 | 236 | ||||||
| 2026-02-11 | 13F | LPL Financial LLC | 80.661 | 24,01 | 5.132 | 22,92 | ||||
| 2026-01-23 | 13F | Valley National Advisers Inc | 10.961 | 17,00 | 1 | |||||
| 2026-02-17 | 13F | Fmr Llc | 1.415 | -0,91 | 90 | -1,10 | ||||
| 2026-01-28 | 13F | Boston Trust Walden Corp | 6.400 | 0,00 | 407 | -0,73 | ||||
| 2026-01-29 | 13F | UMA Financial Services, Inc. | 418 | 27 | ||||||
| 2026-02-06 | 13F | EverSource Wealth Advisors, LLC | 5.424 | 345 | ||||||
| 2026-02-17 | 13F | LaSalle St. Investment Advisors, LLC | 6.039 | 0 | ||||||
| 2026-01-29 | 13F | Live Oak Investment Partners | 5.013 | 0,00 | 319 | -0,93 | ||||
| 2026-02-12 | 13F | Adviser Investments LLC | 10.224 | 1,60 | 651 | 0,62 | ||||
| 2026-02-06 | 13F | Csenge Advisory Group | 8.737 | 1,13 | 556 | 0,18 | ||||
| 2026-03-03 | 13F | Strategic Advisory Partners, Llc | 5.040 | 321 | ||||||
| 2026-02-13 | 13F | Mariner, LLC | 136.790 | 12,22 | 8.704 | 11,22 | ||||
| 2026-01-12 | 13F | Shotwell Rutter Baer Inc | 8.491 | 6,93 | 541 | 6,09 | ||||
| 2026-01-15 | 13F | BetterWealth, LLC | 25.027 | 7,90 | 1.592 | 6,92 | ||||
| 2026-02-10 | 13F | Measured Wealth Private Client Group, LLC | 158 | 0,00 | 10 | 0,00 | ||||
| 2026-02-12 | 13F | Front Row Advisors LLC | 75 | 0,00 | 5 | 0,00 | ||||
| 2026-01-26 | 13F | AE Wealth Management LLC | 1.163 | 0,00 | 74 | 0,00 | ||||
| 2026-02-13 | 13F | Umb Bank N A/mo | 5.602 | 0,00 | 356 | -0,84 | ||||
| 2026-01-21 | 13F | Walkner Condon Financial Advisors LLC | 13.337 | 2,27 | 849 | 1,31 | ||||
| 2026-02-03 | 13F | Coston, McIsaac & Partners | 63 | 1,61 | 0 | |||||
| 2026-02-11 | 13F | IMA Wealth, Inc. | 148.608 | 0,40 | 9.456 | -0,49 | ||||
| 2026-01-15 | 13F | 25 Llc | 5.208 | 0,00 | 331 | -0,90 | ||||
| 2026-01-30 | 13F | Us Bancorp \de\ | 1.391 | 12,18 | 89 | 11,39 | ||||
| 2026-02-17 | 13F | Citadel Advisors Llc | 0 | -100,00 | 0 | |||||
| 2026-01-16 | 13F | Perigon Wealth Management, LLC | 5.083 | -0,47 | 323 | -1,22 | ||||
| 2026-02-06 | 13F | Larson Financial Group LLC | 529 | 1,54 | 34 | 0,00 | ||||
| 2026-02-10 | 13F | Keyvantage Wealth, Llc | 3.638 | -4,46 | 231 | -5,33 | ||||
| 2026-01-26 | 13F | Tribridge Partners Financial LLC | 5.178 | 329 | ||||||
| 2026-02-05 | 13F | Thayer Partners, LLC / MA | 13.718 | 873 | ||||||
| 2026-01-29 | 13F | St Germain D J Co Inc | 64.095 | 12,84 | 4.078 | 11,85 | ||||
| 2026-02-12 | 13F | WealthSpring Partners, LLC | 12.002 | -40,58 | 764 | -36,36 | ||||
| 2026-01-21 | 13F | Sound Income Strategies, LLC | 800 | 0,00 | 51 | 0,00 | ||||
| 2026-01-29 | 13F | UBS Group AG | 46.976 | -7,07 | 2.989 | -7,89 | ||||
| 2026-01-13 | 13F | Mather Group, Llc. | 39.436 | 4,13 | 2.509 | 3,21 |