Grundlæggende statistik
| Institutionelle ejere | 143 total, 138 long only, 0 short only, 5 long/short - change of 5,84% MRQ |
| Gennemsnitlig porteføljeallokering | 0.3535 % - change of -32,07% MRQ |
| Institutionelle aktier (lange) | 3.015.615 (ex 13D/G) - change of -6,50MM shares -68,26% MRQ |
| Institutionel værdi (lang) | $ 321.524 USD ($1000) |
Institutionelt ejerskab og aktionærer
ProShares Trust - ProShares UltraPro S&P500 (US:UPRO) har 143 institutionelle ejere og aktionærer, der har indsendt 13D/G- eller 13F-formularer til Securities Exchange Commission (SEC). Disse institutioner har i alt 3,015,615 aktier. Største aktionærer omfatter Citadel Advisors Llc, Howard Capital Management Inc., Jane Street Group, Llc, Jane Street Group, Llc, Susquehanna International Group, Llp, Citadel Advisors Llc, Susquehanna International Group, Llp, Ridgepath Capital Management LLC, BXM Wealth LLC, and Axxcess Wealth Management, Llc .
ProShares Trust - ProShares UltraPro S&P500 (ARCA:UPRO) institutionel ejerskabsstruktur viser aktuelle positioner i virksomheden efter institutioner og fonde, samt seneste ændringer i positionsstørrelse. Større aktionærer kan omfatte individuelle investorer, investeringsforeninger, hedgefonde eller institutioner. Skema 13D angiver, at investoren besidder (eller besidder) mere end 5 % af virksomheden og har til hensigt (eller har til hensigt at) aktivt at forfølge en ændring i forretningsstrategi. Skema 13G indikerer en passiv investering på over 5%.
The share price as of April 15, 2026 is 120,06 / share. Previously, on April 16, 2025, the share price was 58,12 / share. This represents an increase of 106,57% over that period.

Fondens stemningsscore
Fund Sentiment Score (fka Ownership Accumulation Score) finder de aktier, der bliver mest købt af fonde. Det er resultatet af en sofistikeret, multi-faktor kvantitativ model, der identificerer virksomheder med de højeste niveauer af institutionel akkumulering. Scoringsmodellen bruger en kombination af den samlede stigning i oplyste ejere, ændringerne i porteføljeallokeringer i disse ejere og andre målinger. Tallet går fra 0 til 100, hvor højere tal indikerer et højere niveau af akkumulering for sine jævnaldrende, og 50 er gennemsnittet.
Opdateringsfrekvens: Dagligt
Se Ownership Explorer, som giver en liste over højest rangerende virksomheder.
AI+ Ask Fintel’s AI assistant about ProShares Trust - ProShares UltraPro S&P500.
Select a question to share a public post with an AI-crafted answer.
Thinking of good questions…
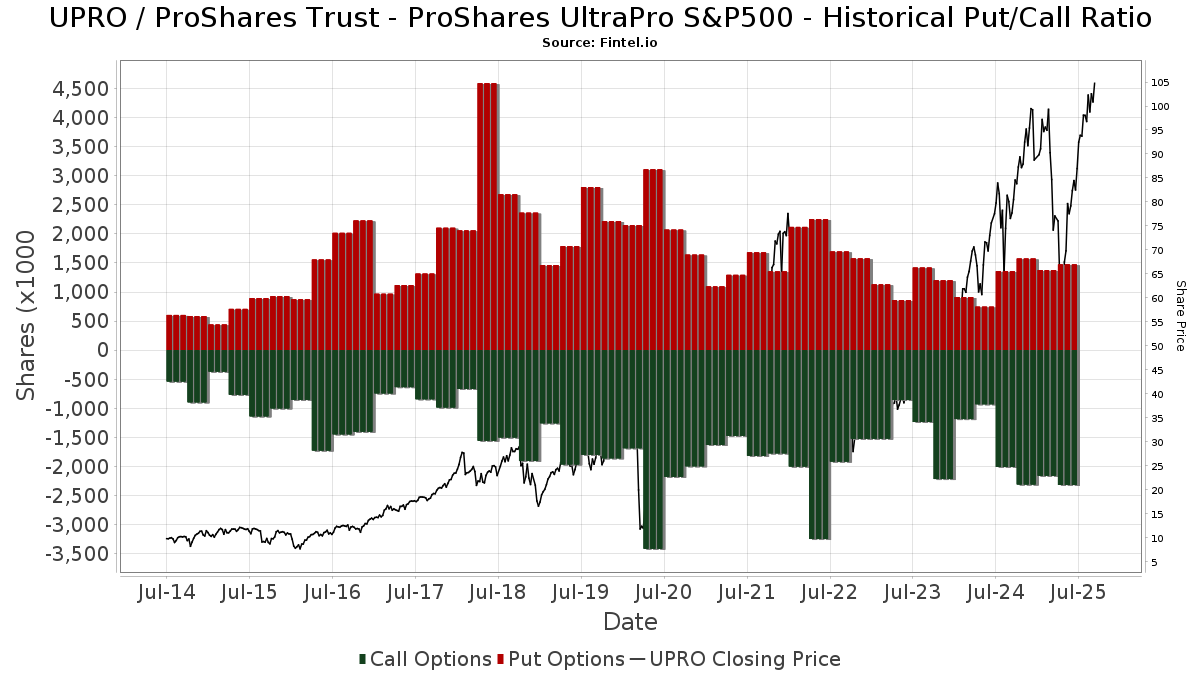
Institutionel Put/Call-forhold
Ud over at indberette standardaktie- og gældsudstedelser skal institutter med mere end 100 mill. aktiver under forvaltning også oplyse deres put- og call-optionsbeholdninger. Da salgsoptioner generelt indikerer negativ stemning, og købsoptioner indikerer positiv stemning, kan vi få en fornemmelse af den overordnede institutionelle stemning ved at plotte forholdet mellem put og kald. Diagrammet til højre viser det historiske put/call-forhold for dette instrument.
Brug af Put/Call Ratio som en indikator for investorernes stemning overvinder en af de vigtigste mangler ved at bruge totalt institutionelt ejerskab, som er, at en betydelig mængde af aktiver under forvaltning investeres passivt for at spore indekser. Passivt forvaltede fonde køber typisk ikke optioner, så indikatoren for put/call-forholdet følger mere nøje følelsen af aktivt forvaltede fonde.
13F og NPORT arkivering
Detaljer om 13F-arkivering er gratis. Detaljer om NP-ansøgninger kræver et premium-medlemskab. Grønne rækker angiver nye positioner. Røde rækker angiver lukkede positioner. Klik på linket ikon for at se den fulde transaktionshistorik.
Opgrader
for at låse premium-data op og eksportere til Excel ![]() .
.
| Fil dato | Kilde | Investor | Type | Gennemsnitlig pris (Øst) |
Aktier | Δ Aktier (%) |
Rapporteret Værdi ($1000) |
Δ Værdi (%) |
Port Alloc (%) |
|
|---|---|---|---|---|---|---|---|---|---|---|
| 2026-04-03 | 13F | Hickory Point Bank & Trust | 4.845 | -3,96 | 470 | -19,69 | ||||
| 2026-01-22 | 13F | DeDora Capital, Inc. | 18.280 | 0,00 | 2.116 | 3,83 | ||||
| 2026-04-08 | 13F | Cadent Capital Advisors, LLC | 0 | -100,00 | 0 | |||||
| 2026-02-12 | 13F | Fortress Private Ledger, Llc | 8.053 | 39,95 | 932 | 45,40 | ||||
| 2026-02-13 | 13F | LM Advisors LLC | 662 | -87,39 | 6 | |||||
| 2026-01-21 | 13F | Sound Income Strategies, LLC | 7.266 | 873 | ||||||
| 2025-11-14 | 13F | Fort Point Capital Partners LLC | 0 | -100,00 | 0 | |||||
| 2026-04-10 | 13F | Abound Wealth Management | 6 | 0,00 | 1 | |||||
| 2026-01-16 | 13F | Ronald Blue Trust, Inc. | 130 | -58,60 | 15 | -44,44 | ||||
| 2026-02-13 | 13F | Parkside Financial Bank & Trust | 93 | 0,00 | 11 | 0,00 | ||||
| 2026-02-12 | 13F | Jane Street Group, Llc | Call | 766.100 | -2,59 | 88.684 | 1,14 | |||
| 2026-02-17 | 13F | Creative Planning | 37.606 | 10,89 | 4.353 | 15,16 | ||||
| 2026-02-04 | 13F | Pensionmark Financial Group, Llc | 9.179 | 3,08 | 1.031 | 3,83 | ||||
| 2026-02-12 | 13F | Jane Street Group, Llc | 4.515 | 523 | ||||||
| 2026-02-13 | 13F | Pinnacle Wealth Planning Services, Inc. | 88 | 10 | ||||||
| 2026-04-08 | 13F | Erickson Financial Group, LLC | 6.952 | 3,13 | 674 | -13,59 | ||||
| 2026-02-11 | 13F | Jpmorgan Chase & Co | 19.383 | -9,45 | 2.244 | -5,99 | ||||
| 2026-02-12 | 13F | Jane Street Group, Llc | Put | 644.000 | 19,35 | 74.549 | 23,92 | |||
| 2026-02-13 | 13F | Kestra Advisory Services, LLC | 244 | 28 | ||||||
| 2026-01-29 | 13F | Golden State Equity Partners | 14.222 | -1,77 | 1.646 | 1,98 | ||||
| 2026-02-17 | 13F | Mittelman Wealth Management | 4.345 | 0,00 | 503 | 3,72 | ||||
| 2026-01-23 | 13F | TFC Financial Management | 0 | -100,00 | 0 | |||||
| 2026-02-10 | 13F | Lido Advisors, LLC | 18.713 | 0,00 | 2.086 | 0,00 | ||||
| 2026-02-17 | 13F | Qube Research & Technologies Ltd | 6.793 | 76,85 | 786 | 83,64 | ||||
| 2026-02-09 | 13F | Hantz Financial Services, Inc. | 1.587 | 29,23 | 0 | |||||
| 2026-02-18 | 13F | Beacon Pointe Advisors, LLC | 8.580 | 0,00 | 993 | 3,87 | ||||
| 2026-02-10 | 13F | Lido Advisors, LLC | Put | 300 | 0,00 | 35 | 3,03 | |||
| 2026-02-12 | 13F | Federation des caisses Desjardins du Quebec | 396 | 465,71 | 46 | 542,86 | ||||
| 2026-04-08 | 13F | Stonebridge Financial Group, LLC | 0 | -100,00 | 0 | |||||
| 2026-02-12 | 13F | Wealthspire Advisors, LLC | 0 | -100,00 | 0 | |||||
| 2026-04-09 | 13F | Turner Capital Investments, LLC | 0 | -100,00 | 0 | |||||
| 2026-02-12 | 13F | Bank Of Montreal /can/ | 0 | -100,00 | 0 | |||||
| 2026-02-17 | 13F | Quadrature Capital Ltd | 0 | -100,00 | 0 | |||||
| 2026-04-16 | 13F | Westmount Partners, LLC | 8.486 | 1,30 | 823 | -15,17 | ||||
| 2026-01-20 | 13F | Stratos Wealth Partners, LTD. | 1.806 | -0,06 | 209 | 3,98 | ||||
| 2026-02-04 | 13F | Ridgepath Capital Management LLC | 207.947 | 0,00 | 23.184 | 0,00 | ||||
| 2025-11-04 | 13F | Jones Financial Companies Lllp | 0 | -100,00 | 0 | -100,00 | ||||
| 2026-01-29 | 13F | UBS Group AG | 9.040 | -81,43 | 1.046 | -80,72 | ||||
| 2026-02-12 | 13F | Commonwealth Equity Services, Llc | 3.499 | -9,14 | 405 | |||||
| 2026-02-13 | 13F | SYM FINANCIAL Corp | 4.693 | -2,03 | 543 | 1,69 | ||||
| 2026-02-18 | 13F | GWM Advisors LLC | 480 | -29,41 | 56 | -26,67 | ||||
| 2025-11-12 | 13F | HAP Trading, LLC | Call | 6.500 | 208 | |||||
| 2026-02-12 | 13F | Hrt Financial Lp | 13.716 | 2 | ||||||
| 2025-11-14 | 13F | Gts Securities Llc | 0 | -100,00 | 0 | -100,00 | ||||
| 2026-02-04 | 13F | Timonier Family Office, LTD. | 7.868 | -3,61 | 911 | 0,00 | ||||
| 2026-04-08 | 13F | Wealth Enhancement Advisory Services, Llc | 2.333 | 232 | ||||||
| 2026-02-17 | 13F | Mercer Global Advisors Inc /adv | 4.577 | 15,79 | 530 | 20,23 | ||||
| 2026-02-17 | 13F | Citadel Advisors Llc | 0 | -100,00 | 0 | -100,00 | ||||
| 2026-02-17 | 13F | Susquehanna International Group, Llp | Put | 539.900 | 5,93 | 62.499 | 9,98 | |||
| 2026-02-13 | 13F | Mariner, LLC | 8.715 | -30,77 | 1.009 | -28,15 | ||||
| 2026-02-17 | 13F | Susquehanna International Group, Llp | Call | 594.900 | -21,29 | 68.866 | -18,27 | |||
| 2026-01-14 | 13F | Longview Financial Advisors LLC | 10 | -28,57 | 1 | 0,00 | ||||
| 2026-02-17 | 13F | Bank Of America Corp /de/ | 2.823 | 90,49 | 327 | 97,58 | ||||
| 2026-02-12 | 13F | Akuna Securities Llc | 4.809 | 557 | ||||||
| 2026-02-18 | 13F | Beacon Pointe Advisors, LLC | Put | 5.700 | 0,00 | 660 | 3,78 | |||
| 2026-02-17 | 13F | Two Sigma Securities, Llc | 0 | -100,00 | 0 | -100,00 | ||||
| 2026-02-13 | 13F | Vontobel Holding Ltd. | 0 | -100,00 | 0 | |||||
| 2026-02-17 | 13F | DV Trading LLC | 3.486 | 385 | ||||||
| 2026-01-28 | 13F | WMG Financial Advisors, LLC | 0 | -100,00 | 0 | |||||
| 2026-02-13 | 13F | Morgan Stanley | 545 | 1,87 | 63 | 6,78 | ||||
| 2026-02-17 | 13F | Quantinno Capital Management LP | 4.918 | 0,00 | 569 | 3,83 | ||||
| 2026-02-19 | 13F | CI Private Wealth, LLC | 20.065 | 6,67 | 2.323 | 10,73 | ||||
| 2026-01-28 | 13F | Provident Wealth Management, LLC | 685 | -65,75 | 79 | -64,41 | ||||
| 2026-04-02 | 13F | Silverleafe Capital Partners, LLC | 0 | -100,00 | 0 | |||||
| 2026-01-12 | 13F | Robinson Value Management, Ltd. | 146.158 | 16.919 | ||||||
| 2026-01-14 | 13F | ORG Wealth Partners, LLC | 251 | 0,00 | 29 | 7,41 | ||||
| 2025-11-04 | 13F | Guerra Advisors Inc | 0 | 0 | ||||||
| 2026-02-03 | 13F | Koshinski Asset Management, Inc. | 4.317 | -26,09 | 500 | -23,35 | ||||
| 2026-01-22 | 13F | Glass Jacobson Investment Advisors llc | 336 | 0,00 | 39 | 2,70 | ||||
| 2026-02-09 | 13F | Putnam Fl Investment Management Co | 5.803 | -4,85 | 672 | -1,18 | ||||
| 2026-02-12 | 13F | BlackRock, Inc. | 2.000 | -33,33 | 232 | -30,84 | ||||
| 2026-04-01 | 13F | Financial Insights, Inc. | 1.794 | 208 | ||||||
| 2026-02-12 | 13F | Mark Sheptoff Financial Planning, Llc | 452 | 0,00 | 52 | 4,00 | ||||
| 2026-01-23 | 13F | Assetmark, Inc | 2.943 | -98,60 | 341 | -98,55 | ||||
| 2026-01-23 | 13F | Rsm Us Wealth Management Llc | 3.735 | 0,00 | 444 | 6,49 | ||||
| 2026-02-17 | 13F | Optiver Holding B.V. | 0 | -100,00 | 0 | |||||
| 2026-04-07 | 13F | Farther Finance Advisors, LLC | 4.954 | 55,15 | 491 | 33,06 | ||||
| 2026-02-03 | 13F | American Financial Advisors, LLC | 5.957 | -1,41 | 690 | 2,38 | ||||
| 2026-01-15 | 13F | Brookstone Capital Management | 3.072 | 356 | ||||||
| 2026-04-16 | 13F | Diversified Trust Co | 43.000 | -14,00 | 4.170 | -27,95 | ||||
| 2026-02-10 | 13F | Goldman Sachs Group Inc | 1.900 | 0,00 | 220 | 3,79 | ||||
| 2026-02-17 | 13F | Susquehanna International Group, Llp | 66.341 | 889,87 | 7.680 | 927,98 | ||||
| 2026-02-13 | 13F | Wells Fargo & Company/mn | 2 | 0,00 | 0 | |||||
| 2026-02-17 | 13F | Captrust Financial Advisors | 1.862 | 1,36 | 216 | 5,39 | ||||
| 2026-02-27 | 13F | Strategic Investment Solutions, Inc. /IL | 100 | 12 | -78,43 | |||||
| 2026-02-06 | 13F | Axxcess Wealth Management, Llc | 198.096 | -4,54 | 22.932 | -0,89 | ||||
| 2026-04-16 | 13F | Toth Financial Advisory Corp | 13.631 | -3,43 | 1.322 | -19,11 | ||||
| 2026-01-23 | 13F | Visionary Horizons, LLC | 2.275 | 0,00 | 263 | 3,95 | ||||
| 2026-02-06 | 13F | Larson Financial Group LLC | 3.633 | -2,31 | 421 | 1,45 | ||||
| 2026-01-08 | 13F | Dagco, Inc. | 253 | 0,40 | 29 | 3,57 | ||||
| 2026-04-15 | 13F | Howard Capital Management Group, LLC | 10.000 | 0,00 | 970 | -16,25 | ||||
| 2026-01-29 | 13F | UMA Financial Services, Inc. | 945 | 0,11 | 109 | 3,81 | ||||
| 2026-01-14 | 13F | Spire Wealth Management | 2.007 | -8,98 | 232 | -5,31 | ||||
| 2026-02-11 | 13F | O'shaughnessy Asset Management, Llc | 241 | 28 | ||||||
| 2026-02-13 | 13F | Change Path, LLC | 3.654 | -5,61 | 423 | -2,09 | ||||
| 2026-02-17 | 13F | Jump Financial, LLC | 30.559 | 3.538 | ||||||
| 2025-11-12 | 13F | Bellwether Advisors, LLC | 0 | -100,00 | 0 | -100,00 | ||||
| 2025-11-14 | 13F | WealthTrak Capital Management LLC | 0 | -100,00 | 0 | -100,00 | ||||
| 2026-02-02 | 13F | Nicholas Hoffman & Company, LLC. | 2.877 | 0,00 | 333 | 4,06 | ||||
| 2026-04-14 | 13F | Howland Capital Management Llc | 2.174 | 0,00 | 211 | -16,33 | ||||
| 2026-02-10 | 13F/A | Northwestern Mutual Wealth Management Co | 1.915 | -2,45 | 222 | 1,38 | ||||
| 2026-02-11 | 13F | Parallel Advisors, LLC | 59 | -67,93 | 7 | -70,00 | ||||
| 2026-04-09 | 13F | Kwmg, Llc | 6.840 | 0,19 | 663 | -16,08 | ||||
| 2026-03-27 | 13F | Prosperity Wealth Management, Inc. | 23.807 | 0,11 | 2.756 | 3,92 | ||||
| 2026-02-12 | 13F | CIBC Private Wealth Group, LLC | 1.552 | 0,06 | 180 | 4,07 | ||||
| 2026-02-11 | 13F | J.w. Cole Advisors, Inc. | 3.108 | 0,29 | 360 | 4,06 | ||||
| 2026-01-30 | 13F | Spectrum Financial Alliance Ltd LLC | 125.596 | 37,79 | 14.539 | 43,06 | ||||
| 2026-01-16 | 13F | Surience Private Wealth Llc | 0 | -100,00 | 0 | |||||
| 2026-01-29 | 13F | Ashton Thomas Private Wealth, LLC | 3.557 | -28,08 | 412 | -25,41 | ||||
| 2026-02-17 | 13F | Tower Research Capital LLC (TRC) | 27.244 | -37,53 | 3.154 | -35,15 | ||||
| 2026-02-05 | 13F | Allworth Financial LP | 278 | -53,43 | 32 | -51,52 | ||||
| 2026-02-13 | 13F | Squarepoint Ops LLC | Call | 33.900 | 0,00 | 3.924 | 3,84 | |||
| 2026-02-13 | 13F | Uniting Wealth Partners, LLC | 21.000 | 0,00 | 2.431 | 3,80 | ||||
| 2026-02-12 | 13F | StoneX Group Inc. | 5.067 | 58,79 | 587 | 65,07 | ||||
| 2026-02-06 | 13F | HighTower Advisors, LLC | 1.930 | 223 | ||||||
| 2026-01-29 | 13F | Quent Capital, LLC | 35 | 0,00 | 4 | 33,33 | ||||
| 2026-01-26 | 13F | Main Street Group, LTD | 50.361 | -0,92 | 5.830 | 2,88 | ||||
| 2026-02-17 | 13F | Royal Bank Of Canada | 100 | 12 | ||||||
| 2026-02-17 | 13F | Citadel Advisors Llc | Put | 1.541.600 | -13,99 | 178.456 | -10,70 | |||
| 2026-04-15 | 13F | Badgley Phelps Wealth Managers, LLC | 4.385 | 46,17 | 425 | 22,48 | ||||
| 2026-02-17 | 13F | Blair William & Co/il | 1.200 | -21,16 | 139 | -18,34 | ||||
| 2026-02-10 | 13F | Bnp Paribas Arbitrage, Sa | 2.410 | 279 | ||||||
| 2026-01-15 | 13F | Sollinda Capital Management LLC | 6.197 | -50,15 | 717 | -48,27 | ||||
| 2026-04-09 | 13F | Wealth Alliance Advisory Group, LLC | 4.247 | 0,12 | 412 | -16,29 | ||||
| 2026-01-28 | 13F | Geneos Wealth Management Inc. | 157 | 0,00 | 18 | 5,88 | ||||
| 2026-02-17 | 13F | Citadel Advisors Llc | Call | 584.100 | -28,45 | 67.615 | -25,71 | |||
| 2026-04-09 | 13F | Mfg Wealth Management, Inc. | 17.541 | 1.701 | ||||||
| 2026-01-23 | 13F | Howard Capital Management Inc. | 1.025.589 | -13,82 | 118.722 | -10,52 | ||||
| 2026-01-14 | 13F | CPR Investments Inc. | 5.723 | -17,12 | 663 | -13,91 | ||||
| 2026-02-09 | 13F | Harbour Investments, Inc. | 11 | 1 | ||||||
| 2026-02-17 | 13F | EFG International AG | 952 | 110 | ||||||
| 2026-01-26 | 13F | Cwm, Llc | 100 | 0 | ||||||
| 2026-02-13 | 13F | Mill Creek Capital Advisors, LLC | 2.001 | 0,00 | 232 | 3,59 | ||||
| 2026-02-17 | 13F | Summit Trail Advisors, Llc | 2.518 | 0,00 | 291 | 3,93 | ||||
| 2026-01-07 | 13F | Innova Wealth Partners | 0 | -100,00 | 0 | -100,00 | ||||
| 2026-02-06 | 13F | Daviman Financial, LLC | 2.584 | 299 | ||||||
| 2026-02-13 | 13F | Motiv8 Investments LLC | 10 | 0 | ||||||
| 2026-02-12 | 13F | Hollencrest Capital Management | 25 | 0,00 | 3 | 0,00 | ||||
| 2026-02-10 | 13F | Essex Financial Services, Inc. | 2.710 | 0,41 | 314 | 4,33 | ||||
| 2026-02-13 | 13F | Headlands Technologies LLC | 22.087 | 277,49 | 2.557 | 292,02 | ||||
| 2026-02-17 | 13F | Safe Harbor Fiduciary, LLC | 19.836 | 4.589,36 | 2.296 | 5.942,11 | ||||
| 2026-02-11 | 13F | T3 Companies, LLC | 4.268 | 494 | ||||||
| 2026-02-10 | 13F | Founders Financial Securities Llc | 6.608 | -16,23 | 765 | -13,08 | ||||
| 2026-04-02 | 13F | Marex Group plc | 0 | -100,00 | 0 | |||||
| 2026-02-13 | 13F | Potomac Fund Management Inc /adv | 0 | -100,00 | 0 | |||||
| 2025-11-12 | 13F | Group One Trading, L.p. | 0 | -100,00 | 0 | |||||
| 2026-01-20 | 13F | BXM Wealth LLC | 201.623 | 3.308 | ||||||
| 2026-02-12 | 13F | Insigneo Advisory Services, Llc | 4.719 | -0,88 | 546 | 3,02 | ||||
| 2026-01-29 | 13F | Calamos Wealth Management LLC | 4.562 | 44,14 | 528 | 50,00 | ||||
| 2026-02-13 | 13F | Citigroup Inc | 0 | -100,00 | 0 | |||||
| 2026-01-26 | 13F | Discipline Wealth Solutions, LLC | 6.174 | -12,96 | 715 | -9,62 | ||||
| 2026-02-17 | 13F | XTX Topco Ltd | 4.468 | 517 | ||||||
| 2026-02-03 | 13F | SBI Securities Co., Ltd. | 651 | -4,55 | 75 | -1,32 | ||||
| 2026-02-06 | 13F | EverSource Wealth Advisors, LLC | 15.586 | -31,08 | 1.804 | -28,44 | ||||
| 2026-02-09 | 13F | Revere Asset Management, Inc | 197.317 | 8,62 | 22.841 | 12,78 | ||||
| 2026-02-13 | 13F | Edgestream Partners, L.P. | 5.120 | 593 | ||||||
| 2026-02-04 | 13F | Wsfs Capital Management, Llc | 7.929 | 0,00 | 918 | 3,73 | ||||
| 2026-02-17 | 13F | Advisor Group Holdings, Inc. | 12 | -65,71 | 1 | -66,67 | ||||
| 2026-02-03 | 13F | Encompass More Asset Management | 27.208 | -17,70 | 3.150 | -14,55 | ||||
| 2026-01-23 | 13F | Optima Capital Llc | 3.054 | 354 | ||||||
| 2026-04-07 | 13F | CoreCap Advisors, LLC | 0 | -100,00 | 0 | -100,00 | ||||
| 2026-04-15 | 13F | Dedeker Financial LLC | 4.290 | -16,81 | 416 | -30,32 | ||||
| 2026-04-10 | 13F | Great Oak Capital Partners, Llc | 0 | -100,00 | 0 | |||||
| 2026-04-13 | 13F | IFP Advisors, Inc | 74 | 362,50 | 7 | 600,00 | ||||
| 2026-04-13 | 13F | LexAurum Advisors, LLC | 2.832 | 13,33 | 275 | -1,44 | ||||
| 2026-02-02 | 13F | Ellis Investment Partners, LLC | 10.021 | -1,34 | 1.160 | 2,47 | ||||
| 2026-02-12 | 13F | DRW Securities, LLC | 0 | -100,00 | 0 | |||||
| 2025-11-05 | 13F | Envestnet Asset Management Inc | 0 | -100,00 | 0 | -100,00 | ||||
| 2025-11-07 | 13F | HC Advisors, LLC | 0 | -100,00 | 0 | |||||
| 2026-02-05 | 13F | Triton Wealth Management, PLLC | 0 | -100,00 | 0 | |||||
| 2026-02-11 | 13F | Simplex Trading, Llc | 0 | -100,00 | 0 | |||||
| 2026-02-05 | 13F | Bessemer Group Inc | 109 | 0 | ||||||
| 2026-02-10 | 13F | Meramec Financial Planners, LLC | 2.057 | 244 | ||||||
| 2026-01-13 | 13F | Mayflower Financial Advisors, LLC | 2.824 | -2,28 | 327 | 1,24 | ||||
| 2026-02-03 | 13F | Legacy Wealth Managment, LLC/ID | 0 | -100,00 | 0 | |||||
| 2026-02-09 | 13F | Millington Financial Advisors, LLC | 25.920 | -5,29 | 3.071 | 2,71 | ||||
| 2026-02-11 | 13F | Rise Advisors, LLC | 0 | -100,00 | 0 | |||||
| 2026-01-29 | 13F | Segment Wealth Management, LLC | 1.825 | 0,00 | 211 | 3,94 | ||||
| 2026-03-30 | 13F/A | Barclays Plc | 0 | -100,00 | 0 | |||||
| 2026-02-10 | 13F | Ritter Daniher Financial Advisory LLC / DE | 31 | 0,00 | 4 | 0,00 | ||||
| 2026-02-12 | 13F | Renaissance Technologies Llc | 13.600 | -25,68 | 1.574 | -22,84 | ||||
| 2026-04-07 | 13F | Signaturefd, Llc | 388 | 22,01 | 38 | 2,78 | ||||
| 2026-01-26 | 13F | AE Wealth Management LLC | 82 | 0,00 | 9 | 0,00 | ||||
| 2026-02-05 | 13F | Gr Financial Group, Llc | 3.258 | 28,47 | 377 | 33,69 | ||||
| 2026-02-13 | 13F | Flow Traders U.s. Llc | 18.512 | 408,43 | 2 |