Grundlæggende statistik
| Institutionelle ejere | 161 total, 161 long only, 0 short only, 0 long/short - change of 2,53% MRQ |
| Gennemsnitlig porteføljeallokering | 0.0947 % - change of -36,41% MRQ |
| Institutionelle aktier (lange) | 5.605.188 (ex 13D/G) - change of 0,19MM shares 3,60% MRQ |
| Institutionel værdi (lang) | $ 207.767 USD ($1000) |
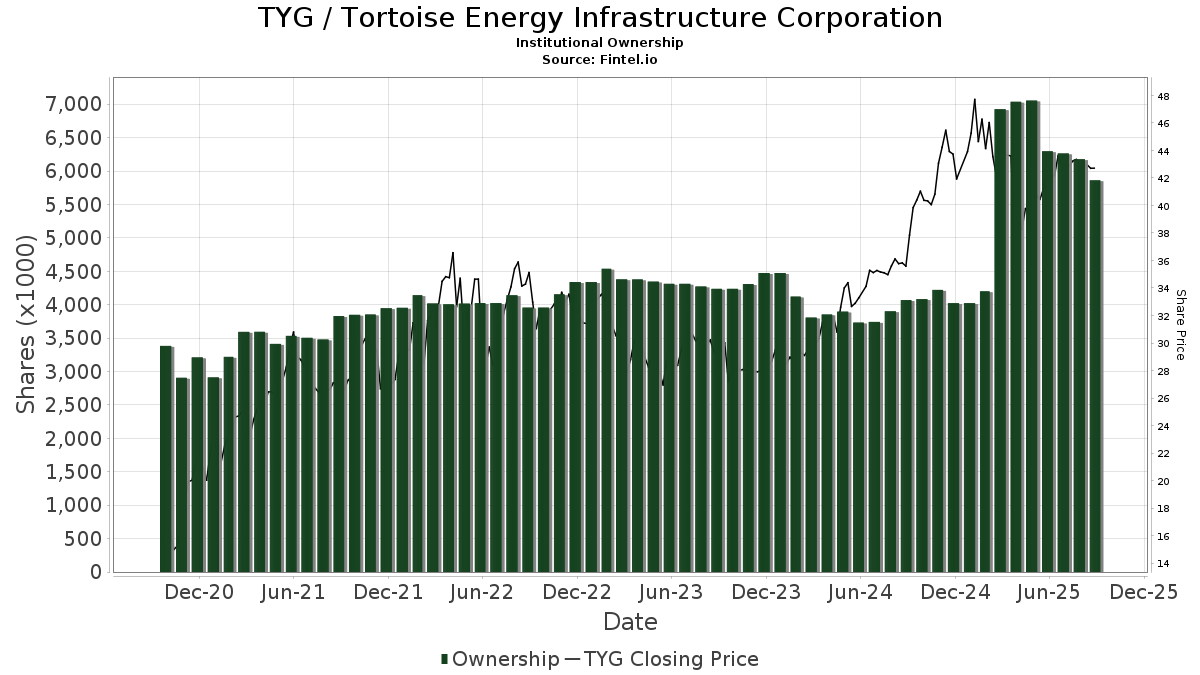
Institutionelt ejerskab og aktionærer
Tortoise Energy Infrastructure Corporation (US:TYG) har 161 institutionelle ejere og aktionærer, der har indsendt 13D/G- eller 13F-formularer til Securities Exchange Commission (SEC). Disse institutioner har i alt 5,605,188 aktier. Største aktionærer omfatter Morgan Stanley, Advisors Asset Management, Inc., Royal Bank Of Canada, Raymond James Financial Inc, Wells Fargo & Company/mn, Bard Associates Inc, Penserra Capital Management LLC, Allspring Global Investments Holdings, LLC, Arete Wealth Advisors, LLC, and Guggenheim Capital Llc .
Tortoise Energy Infrastructure Corporation (NYSE:TYG) institutionel ejerskabsstruktur viser aktuelle positioner i virksomheden efter institutioner og fonde, samt seneste ændringer i positionsstørrelse. Større aktionærer kan omfatte individuelle investorer, investeringsforeninger, hedgefonde eller institutioner. Skema 13D angiver, at investoren besidder (eller besidder) mere end 5 % af virksomheden og har til hensigt (eller har til hensigt at) aktivt at forfølge en ændring i forretningsstrategi. Skema 13G indikerer en passiv investering på over 5%.
The share price as of April 14, 2026 is 48,10 / share. Previously, on April 15, 2025, the share price was 39,16 / share. This represents an increase of 22,83% over that period.
Fondens stemningsscore
Fund Sentiment Score (fka Ownership Accumulation Score) finder de aktier, der bliver mest købt af fonde. Det er resultatet af en sofistikeret, multi-faktor kvantitativ model, der identificerer virksomheder med de højeste niveauer af institutionel akkumulering. Scoringsmodellen bruger en kombination af den samlede stigning i oplyste ejere, ændringerne i porteføljeallokeringer i disse ejere og andre målinger. Tallet går fra 0 til 100, hvor højere tal indikerer et højere niveau af akkumulering for sine jævnaldrende, og 50 er gennemsnittet.
Opdateringsfrekvens: Dagligt
Se Ownership Explorer, som giver en liste over højest rangerende virksomheder.
AI+ Ask Fintel’s AI assistant about Tortoise Energy Infrastructure Corporation.
Select a question to share a public post with an AI-crafted answer.
Thinking of good questions…
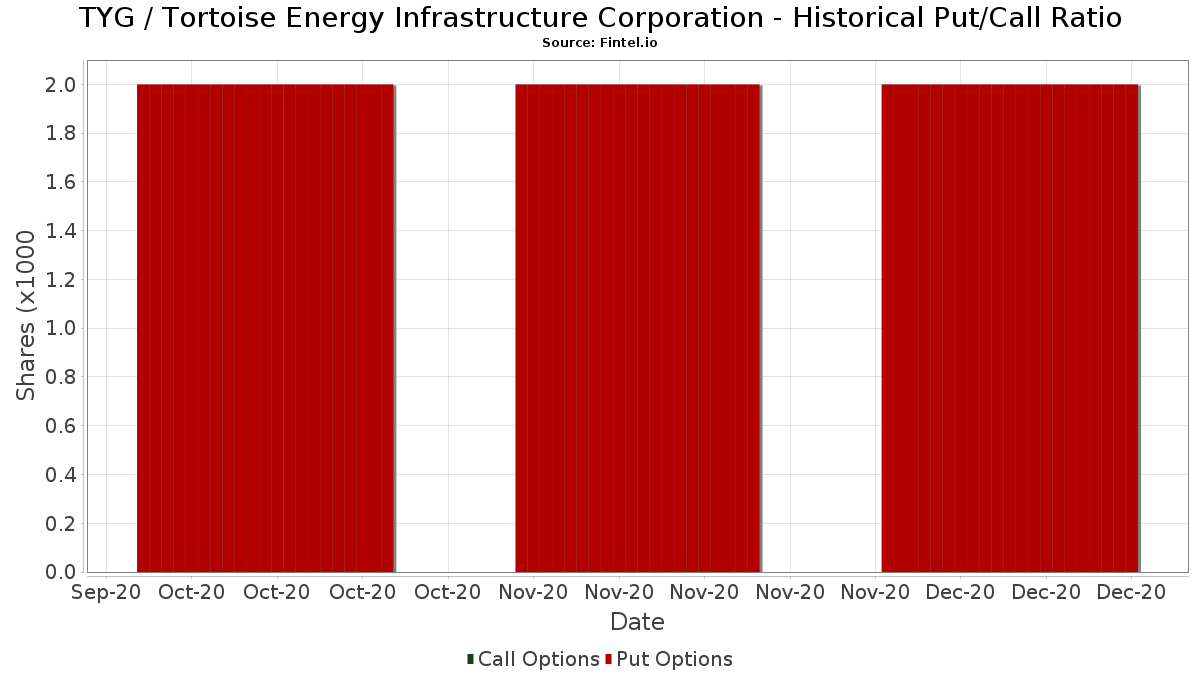
Institutionel Put/Call-forhold
Ud over at indberette standardaktie- og gældsudstedelser skal institutter med mere end 100 mill. aktiver under forvaltning også oplyse deres put- og call-optionsbeholdninger. Da salgsoptioner generelt indikerer negativ stemning, og købsoptioner indikerer positiv stemning, kan vi få en fornemmelse af den overordnede institutionelle stemning ved at plotte forholdet mellem put og kald. Diagrammet til højre viser det historiske put/call-forhold for dette instrument.
Brug af Put/Call Ratio som en indikator for investorernes stemning overvinder en af de vigtigste mangler ved at bruge totalt institutionelt ejerskab, som er, at en betydelig mængde af aktiver under forvaltning investeres passivt for at spore indekser. Passivt forvaltede fonde køber typisk ikke optioner, så indikatoren for put/call-forholdet følger mere nøje følelsen af aktivt forvaltede fonde.
13D/G-arkivering
Vi præsenterer 13D/G ansøgninger separat fra 13F ansøgninger på grund af den forskellige behandling af SEC. 13D/G-ansøgninger kan indgives af grupper af investorer (med én ledende), hvorimod 13F-ansøgninger ikke kan. Dette resulterer i situationer, hvor en investor kan indsende en 13D/G, der rapporterer én værdi for de samlede aktier (der repræsenterer alle de aktier, der ejes af investorgruppen), men derefter indsender en 13F, der rapporterer en anden værdi for de samlede aktier (der udelukkende repræsenterer deres egne) ejendomsret). Det betyder, at aktieejerskab af 13D/G-arkiver og 13F-arkiveringer ofte ikke er direkte sammenlignelige, så vi præsenterer dem separat.
Bemærk: Fra den 16. maj 2021 viser vi ikke længere ejere, der ikke har indsendt en 13D/G inden for det seneste år. Tidligere viste vi den fulde historie af 13D/G-arkiver. Generelt skal enheder, der er forpligtet til at indgive 13D/G-ansøgninger, indgive mindst årligt, før de indsender en afsluttende ansøgning. Dog forlader fonde nogle gange positioner uden at indsende en afsluttende ansøgning (dvs. de afvikler), så visning af den fulde historie resulterede nogle gange i forvirring om det nuværende ejerskab. For at undgå forvirring viser vi nu kun 'aktuelle' ejere - det vil sige - ejere, der har anmeldt inden for det seneste år.
Upgrade to unlock premium data.
| Fil dato | Form | Investor | Forrige Aktier |
Seneste Aktier |
Δ Aktier (Procent) |
Ejendomsret (Procent) |
Δ Ejerskab (Procent) |
|
|---|---|---|---|---|---|---|---|---|
| 2025-08-05 | MORGAN STANLEY | 960,816 | 1,045,172 | 8.78 | 6.10 | -31.46 | ||
| 2025-07-15 | Saba Capital Management, L.P. | 625,915 | 549,502 | -12.21 | 3.19 | -45.09 |
13F og NPORT arkivering
Detaljer om 13F-arkivering er gratis. Detaljer om NP-ansøgninger kræver et premium-medlemskab. Grønne rækker angiver nye positioner. Røde rækker angiver lukkede positioner. Klik på linket ikon for at se den fulde transaktionshistorik.
Opgrader
for at låse premium-data op og eksportere til Excel ![]() .
.
| Fil dato | Kilde | Investor | Type | Gennemsnitlig pris (Øst) |
Aktier | Δ Aktier (%) |
Rapporteret Værdi ($1000) |
Δ Værdi (%) |
Port Alloc (%) |
|
|---|---|---|---|---|---|---|---|---|---|---|
| 2026-01-15 | 13F | Allspring Global Investments Holdings, LLC | 138.490 | -2,03 | 5.664 | -7,01 | ||||
| 2026-02-13 | 13F | Bard Associates Inc | 195.725 | 71,06 | 8.005 | 62,37 | ||||
| 2026-02-13 | 13F | Rhumbline Advisers | 39 | 2 | ||||||
| 2026-04-07 | 13F | Eastern Bank | 5.847 | 0,00 | 291 | 21,76 | ||||
| 2026-02-12 | 13F | Advisors Asset Management, Inc. | 381.612 | 17,90 | 15.608 | 11,90 | ||||
| 2026-02-02 | 13F | Millstone Evans Group, LLC | 0 | -100,00 | 0 | |||||
| 2026-02-17 | 13F | Tower Research Capital LLC (TRC) | 2 | -93,75 | 0 | -100,00 | ||||
| 2026-03-03 | 13F | NWF Advisory Services Inc. | 21.076 | 65,30 | 862 | 57,01 | ||||
| 2026-01-21 | 13F | MBA Advisors LLC | 5.280 | 3,53 | 216 | -1,83 | ||||
| 2026-02-10 | 13F/A | Northwestern Mutual Wealth Management Co | 1.270 | 0,00 | 52 | -5,56 | ||||
| 2026-02-12 | 13F | Investment Research Partners LLC | 20.575 | 842 | ||||||
| 2026-01-22 | 13F | Fiduciary Alliance LLC | 7.240 | -3,93 | 296 | -8,64 | ||||
| 2026-02-13 | 13F | Ariadne Wealth Management, LP | 25.100 | 0,00 | 1.174 | 6,05 | ||||
| 2026-02-13 | 13F | Arete Wealth Advisors, LLC | 133.730 | 2,13 | 5 | 0,00 | ||||
| 2026-04-08 | 13F | Wealth Enhancement Advisory Services, Llc | 46.295 | -72,29 | 2.154 | -68,83 | ||||
| 2026-02-13 | 13F | Wells Fargo & Company/mn | 215.011 | -6,34 | 8.794 | -11,10 | ||||
| 2026-02-12 | 13F | Commonwealth Equity Services, Llc | 20.366 | 27,62 | 833 | |||||
| 2026-02-17 | 13F | Jones Financial Companies Lllp | 19 | -96,96 | 1 | -100,00 | ||||
| 2026-04-14 | 13F | Corecam Pte. Ltd. | 0 | -100,00 | 0 | |||||
| 2026-01-28 | 13F | Absolute Investment Advisers Llc | 7.570 | 316 | ||||||
| 2026-01-26 | 13F | Invested Advisors | 12.655 | 518 | ||||||
| 2026-02-12 | 13F | Steward Partners Investment Advisory, Llc | 36.835 | 1,76 | 1.507 | -3,40 | ||||
| 2025-11-13 | 13F | De Lisle Partners LLP | 0 | -100,00 | 0 | |||||
| 2026-01-16 | 13F | Values Added Financial LLC | 5.716 | 0,00 | 234 | -5,28 | ||||
| 2026-02-09 | 13F | Hartland & Co., LLC | 1.533 | 10,45 | 63 | 5,08 | ||||
| 2026-04-13 | 13F | Hm Payson & Co | 125 | 0,00 | 6 | 20,00 | ||||
| 2026-01-23 | 13F | Inlight Wealth Management, LLC | 123 | 0,00 | 5 | 0,00 | ||||
| 2026-02-12 | 13F | Concorde Asset Management, LLC | 15.092 | 0,07 | 617 | -5,08 | ||||
| 2026-02-17 | 13F | SageView Advisory Group, LLC | 951 | 39 | ||||||
| 2026-02-17 | 13F | Evolve Private Wealth, Llc | 45.988 | 1.881 | ||||||
| 2026-02-05 | 13F | Cambridge Investment Research Advisors, Inc. | 71.066 | 67,66 | 3 | 100,00 | ||||
| 2025-11-14 | 13F | Walleye Capital LLC | 0 | -100,00 | 0 | |||||
| 2026-04-10 | 13F | Abound Wealth Management | 181 | 0,00 | 9 | 14,29 | ||||
| 2026-02-13 | 13F | Mariner, LLC | 56.121 | -2,49 | 2.295 | -7,46 | ||||
| 2026-04-07 | 13F | Farther Finance Advisors, LLC | 671 | 75,20 | 31 | 100,00 | ||||
| 2026-02-02 | 13F | Montag A & Associates Inc | 1.304 | -2,61 | 53 | -7,02 | ||||
| 2026-02-13 | 13F | Parkside Financial Bank & Trust | 1.000 | 42,86 | 41 | 33,33 | ||||
| 2026-01-12 | 13F | DAVENPORT & Co LLC | 8.197 | 2,17 | 335 | -2,90 | ||||
| 2026-04-14 | 13F | Thurston, Springer, Miller, Herd & Titak, Inc. | 2.100 | 0,00 | 105 | 22,35 | ||||
| 2026-02-11 | 13F | Monetary Management Group Inc | 40.626 | -1,23 | 1.662 | -6,26 | ||||
| 2026-01-21 | 13F | Flagship Harbor Advisors, Llc | 152 | 6 | ||||||
| 2026-04-13 | 13F | Mather Group, Llc. | 439 | 22 | ||||||
| 2026-02-13 | 13F | Cohen & Steers, Inc. | 52.782 | 69,37 | 2 | 100,00 | ||||
| 2026-02-17 | 13F | Royal Bank Of Canada | 333.131 | 22,61 | 13.625 | 16,37 | ||||
| 2026-04-07 | 13F | CoreCap Advisors, LLC | 2.323 | 1.937,72 | 116 | 2.775,00 | ||||
| 2026-02-17 | 13F | Raymond James Financial Inc | 326.339 | 2,83 | 13.347 | -2,40 | ||||
| 2026-02-11 | 13F | LPL Financial LLC | 126.953 | 9,29 | 5.192 | 3,74 | ||||
| 2026-02-13 | 13F | Botty Investors LLC | 13.329 | 0,00 | 545 | -5,05 | ||||
| 2026-02-17 | 13F | United Capital Financial Advisers, Llc | 21.400 | 1,90 | 875 | -3,21 | ||||
| 2026-01-15 | 13F | Jaffetilchin Investment Partners, LLC | 9.176 | 24,91 | 375 | 18,67 | ||||
| 2026-04-14 | 13F | West Branch Capital LLC | 306 | 3,03 | 15 | 25,00 | ||||
| 2026-02-17 | 13F | Private Advisor Group, LLC | 52.420 | 306,80 | 2.144 | 286,13 | ||||
| 2026-02-06 | 13F | EverSource Wealth Advisors, LLC | 2 | 0,00 | 0 | |||||
| 2026-01-29 | 13F | Segment Wealth Management, LLC | 15.000 | 0,00 | 614 | -5,11 | ||||
| 2026-02-09 | 13F | Cary Street Partners Financial Llc | 6.270 | -10,04 | 256 | -14,67 | ||||
| 2026-02-06 | 13F | HighTower Advisors, LLC | 18.299 | -0,92 | 748 | -5,91 | ||||
| 2026-02-12 | 13F | Federation des caisses Desjardins du Quebec | 180 | 0,00 | 7 | 0,00 | ||||
| 2026-02-02 | 13F | Benjamin Edwards Inc | 7.180 | -0,95 | 294 | -6,09 | ||||
| 2026-01-12 | 13F | Uhlmann Price Securities, Llc | 17.137 | 18,19 | 701 | 12,18 | ||||
| 2026-02-17 | 13F | MGB Wealth Management, LLC | 26.689 | 1,91 | 1.092 | -3,28 | ||||
| 2026-01-12 | 13F | Roble, Belko & Company, Inc | 35 | 0,00 | 0 | |||||
| 2026-02-12 | 13F | Principal Securities, Inc. | 0 | -100,00 | 0 | |||||
| 2026-02-13 | 13F | Commerce Bank | 33.131 | 60,17 | 1.355 | 52,08 | ||||
| 2026-02-17 | 13F | Zimmer Partners, LP | 50.000 | -38,59 | 2.045 | -41,70 | ||||
| 2026-01-26 | 13F | Private Trust Co Na | 0 | -100,00 | 0 | |||||
| 2026-03-05 | 13F | Gunpowder Capital Management, LLC dba Oliver Wealth Management | 255 | 10 | ||||||
| 2026-02-06 | 13F | Addison Advisors LLC | 63 | 0,00 | 3 | 0,00 | ||||
| 2026-02-13 | 13F | Eagle Bluffs Wealth Management LLC | 0 | -100,00 | 0 | |||||
| 2026-01-20 | 13F | SOA Wealth Advisors, LLC. | 187 | 0,00 | 8 | -12,50 | ||||
| 2026-01-29 | 13F | Kercheville Advisors, LLC | 21.343 | 6,58 | 972 | 12,65 | ||||
| 2026-02-19 | 13F | Invesco Ltd. | 28.826 | -15,88 | 1.179 | -20,19 | ||||
| 2026-02-13 | 13F | OpenArc Corporate Advisory, LLC | 7.619 | 312 | ||||||
| 2026-02-17 | 13F | Cetera Investment Advisers | 17.696 | 27,36 | 724 | 20,90 | ||||
| 2026-02-12 | 13F | Jane Street Group, Llc | 19.904 | 29,51 | 814 | 22,96 | ||||
| 2026-01-16 | 13F | Catalina Capital Group, LLC | 8.275 | 30,69 | 338 | 24,26 | ||||
| 2026-02-11 | 13F | Strategic Advocates LLC | 11.198 | -14,49 | 456 | -19,33 | ||||
| 2026-02-20 | 13F | Sunbelt Securities, Inc. | 238 | 3,03 | 10 | 0,00 | ||||
| 2026-01-09 | 13F | 180 Wealth Advisors, Llc | 46.377 | -1,13 | 1.897 | -6,19 | ||||
| 2025-11-14 | 13F | Skopos Labs, Inc. | 0 | -100,00 | 0 | |||||
| 2026-02-17 | 13F | Advisor Group Holdings, Inc. | 26.540 | 48,53 | 1.086 | 42,20 | ||||
| 2026-02-12 | 13F | American Financial Group Inc | 110.102 | 0,00 | 4.503 | -5,08 | ||||
| 2026-01-30 | 13F | Us Bancorp \de\ | 647 | 26 | ||||||
| 2025-11-14 | 13F | Wetherby Asset Management Inc | 17.220 | 100,00 | 742 | 96,82 | ||||
| 2026-02-06 | 13F | Larson Financial Group LLC | 193 | 0,00 | 8 | -12,50 | ||||
| 2026-02-02 | 13F | WJ Financial Advisors LLC | 27.913 | 16,30 | 1.142 | 10,35 | ||||
| 2025-11-14 | 13F | Bulldog Investors, LLP | 0 | -100,00 | 0 | -100,00 | ||||
| 2025-11-12 | 13F | Transce3nd, LLC | 0 | -100,00 | 0 | |||||
| 2026-02-09 | 13F | Delta Asset Management Llc/tn | 50 | 0,00 | 2 | 0,00 | ||||
| 2026-01-30 | 13F | Sigma Planning Corp | 6.896 | 282 | ||||||
| 2026-01-30 | 13F | Samalin Investment Counsel, LLC | 13.712 | 2,80 | 561 | -2,44 | ||||
| 2026-02-03 | 13F | RFG Advisory, LLC | 8.449 | 346 | ||||||
| 2026-02-06 | 13F | Covestor Ltd | 56 | 0 | ||||||
| 2026-02-12 | 13F | Rossby Financial, LCC | 63 | 0,00 | 3 | 0,00 | ||||
| 2026-02-13 | 13F | Baird Financial Group, Inc. | 4.920 | 201 | ||||||
| 2026-02-02 | 13F | Oppenheimer & Co Inc | 34.054 | 31,77 | 1.393 | 25,07 | ||||
| 2026-02-12 | 13F | CF Capital LLC | 0 | -100,00 | 0 | |||||
| 2026-02-17 | 13F | Alpine Global Management, LLC | 0 | -100,00 | 0 | -100,00 | ||||
| 2026-02-09 | 13F | Key FInancial Inc | 6 | 0,00 | 0 | |||||
| 2026-01-27 | 13F | Financial Management Professionals, Inc. | 38 | 2,70 | 2 | 0,00 | ||||
| 2026-01-23 | 13F | Assetmark, Inc | 67 | 0,00 | 3 | 0,00 | ||||
| 2026-02-13 | 13F | Integrated Wealth Concepts LLC | 0 | -100,00 | 0 | |||||
| 2026-01-29 | 13F | UBS Group AG | 69.068 | 71,85 | 2.825 | 63,14 | ||||
| 2026-02-17 | 13F | Tortoise Capital Advisors, L.l.c. | 6.112 | 250 | ||||||
| 2026-04-02 | 13F | Noble Wealth Management PBC | 918 | 26,62 | 46 | 55,17 | ||||
| 2026-02-11 | 13F | Jpmorgan Chase & Co | 416 | 0,00 | 17 | 0,00 | ||||
| 2026-02-17 | 13F | Guggenheim Capital Llc | 131.916 | 18,99 | 5.395 | 12,94 | ||||
| 2026-02-10 | 13F | Baker Avenue Asset Management, LP | 8.610 | 0,00 | 352 | -5,12 | ||||
| 2026-02-02 | 13F | Manhattan West Asset Management, LLC | 11.730 | 0,00 | 480 | -5,15 | ||||
| 2026-02-11 | 13F | XML Financial, LLC | 5.702 | 233 | ||||||
| 2026-01-14 | 13F | Spire Wealth Management | 849 | 0,24 | 35 | -5,56 | ||||
| 2026-01-23 | 13F | First PREMIER Bank | 151 | 0,00 | 0 | |||||
| 2026-02-11 | 13F | Next Capital Management LLC | 9.770 | 0,00 | 400 | -5,00 | ||||
| 2026-04-09 | 13F | Nelson, Van Denburg & Campbell Wealth Management Group, LLC | 11.581 | 66,54 | 577 | 103,17 | ||||
| 2026-01-21 | 13F | Sound Income Strategies, LLC | 90 | 0,00 | 4 | 33,33 | ||||
| 2026-02-10 | 13F | Private Wealth Asset Management, LLC | 200 | 0,00 | 8 | 0,00 | ||||
| 2026-02-04 | 13F | First Foundation Advisors | 25.952 | 1.061 | ||||||
| 2026-02-13 | 13F | Pin Oak Investment Advisors Inc | 245 | -33,78 | 0 | -100,00 | ||||
| 2026-02-13 | 13F | Thomas J. Herzfeld Advisors, Inc. | 0 | -100,00 | 0 | -100,00 | ||||
| 2026-02-13 | 13F | Umb Bank N A/mo | 325 | 0,00 | 13 | 0,00 | ||||
| 2026-02-10 | 13F | Lido Advisors, LLC | 19.355 | 0,20 | 834 | 0,12 | ||||
| 2026-02-19 | 13F | CI Private Wealth, LLC | 50.394 | 368,39 | 519 | 11,88 | ||||
| 2026-02-12 | 13F | Penserra Capital Management LLC | 158.953 | 10,19 | 7 | 0,00 | ||||
| 2026-02-13 | 13F | Truvestments Capital Llc | 187 | 0,00 | 8 | -12,50 | ||||
| 2026-01-29 | 13F | D.a. Davidson & Co. | 29.290 | 101,26 | 1.198 | 90,91 | ||||
| 2026-01-26 | 13F | Consolidated Portfolio Review Corp | 0 | -100,00 | 0 | |||||
| 2026-02-09 | 13F | Harbour Investments, Inc. | 6.894 | 11,97 | 282 | 6,04 | ||||
| 2026-02-13 | 13F | Citigroup Inc | 271 | 0,00 | 11 | 0,00 | ||||
| 2026-02-13 | 13F | Kestra Advisory Services, LLC | 7.524 | 308 | ||||||
| 2026-02-05 | 13F | 1620 Investment Advisors, Inc. | 18.506 | 0,16 | 757 | -5,03 | ||||
| 2026-02-12 | 13F | Wealthspire Advisors, LLC | 0 | -100,00 | 0 | |||||
| 2026-02-13 | 13F | Stifel Financial Corp | 37.497 | 1,24 | 1.534 | -3,95 | ||||
| 2026-04-06 | 13F | Old Port Advisors | 7.506 | -0,49 | 374 | 21,43 | ||||
| 2026-02-17 | 13F/A | Kovack Advisors, Inc. | 11.690 | 478 | ||||||
| 2026-01-30 | 13F | Camden Capital, LLC | 85.000 | 0,00 | 3.476 | -5,08 | ||||
| 2026-02-13 | 13F | Morgan Stanley | 1.241.397 | 16,35 | 50.773 | 10,44 | ||||
| 2026-02-17 | 13F | Cahill Financial Advisors Inc | 21.119 | 1,55 | 864 | -3,68 | ||||
| 2026-02-10 | 13F | WCG Wealth Advisors LLC | 13.628 | 557 | ||||||
| 2026-02-04 | 13F | Ameritas Advisory Services, LLC | 0 | -100,00 | 0 | |||||
| 2026-02-17 | 13F | Creative Planning | 6.663 | 273 | ||||||
| 2026-01-09 | 13F | Diversified Trust Co | 9.106 | 4,06 | 372 | -1,33 | ||||
| 2026-02-12 | 13F | CIBC Private Wealth Group, LLC | 3.352 | -12,39 | 137 | -16,46 | ||||
| 2026-01-22 | 13F | Evermay Wealth Management Llc | 298 | 0,00 | 12 | 0,00 | ||||
| 2026-02-11 | 13F | Janney Montgomery Scott LLC | 73.379 | 110,95 | 3 | 200,00 | ||||
| 2026-01-06 | 13F | Sanctuary Advisors, LLC | 0 | -100,00 | 0 | |||||
| 2025-11-12 | 13F | BlackRock, Inc. | 0 | -100,00 | 0 | |||||
| 2026-01-23 | 13F | Webster Bank, N. A. | 621 | 0,00 | 25 | -3,85 | ||||
| 2026-01-26 | 13F | Quadrant Private Wealth Management, LLC | 16.610 | 0,00 | 679 | -5,03 | ||||
| 2026-02-18 | 13F | Garton & Associates Financial Advisors LLC | 98 | 4 | ||||||
| 2026-01-14 | 13F | ORG Wealth Partners, LLC | 0 | -100,00 | 0 | |||||
| 2026-04-10 | 13F | Quaker Wealth Management, LLC | 0 | -100,00 | 0 | |||||
| 2026-01-21 | 13F | Hartford Financial Management Inc. | 1.244 | 49,16 | 51 | 42,86 | ||||
| 2026-04-08 | 13F | Holos Integrated Wealth LLC | 443 | 21 | ||||||
| 2026-01-28 | 13F | Cornerstone Advisory, LLC | 8.692 | -3,48 | 355 | -8,51 | ||||
| 2025-11-13 | 13F | Aristides Capital LLC | 0 | -100,00 | 0 | -100,00 | ||||
| 2026-02-11 | 13F | Closed-End Fund Advisors, Inc. | 73.348 | 3.000 | ||||||
| 2026-01-26 | 13F | Whittier Trust Co | 2.000 | 0,00 | 83 | -4,65 | ||||
| 2026-02-17 | 13F | Wiley Bros.-aintree Capital, Llc | 5.493 | 225 | ||||||
| 2026-02-09 | 13F | Blue Bell Private Wealth Management, Llc | 16.280 | 343,11 | 666 | 320,89 | ||||
| 2026-02-17 | 13F | National Asset Management, Inc. | 6.486 | 21,62 | 265 | 15,72 | ||||
| 2026-02-05 | 13F | John G Ullman & Associates Inc | 15.241 | 0,00 | 623 | -5,03 | ||||
| 2026-02-06 | 13F | Pnc Financial Services Group, Inc. | 322 | 0,00 | 13 | 0,00 | ||||
| 2026-02-13 | 13F | MAI Capital Management | 12.287 | 5,03 | 503 | -0,40 | ||||
| 2025-11-12 | 13F | Huntington National Bank | 7 | 0,00 | ||||||
| 2026-01-28 | 13F | Salomon & Ludwin, LLC | 37 | 0,00 | 2 | 0,00 | ||||
| 2026-02-12 | 13F | Sit Investment Associates Inc | 0 | -100,00 | 0 | |||||
| 2026-02-03 | 13F | NewEdge Wealth, LLC | 13.246 | -8,41 | 542 | -13,72 | ||||
| 2026-01-29 | 13F | Calamos Advisors LLC | 14.575 | 32,15 | 596 | 25,47 | ||||
| 2026-02-17 | 13F | Bank Of America Corp /de/ | 92.966 | 35,14 | 3.802 | 28,27 | ||||
| 2026-02-13 | 13F | Wealth Alliance | 11.162 | 457 | ||||||
| 2026-02-13 | 13F | Quarry LP | 7.570 | 310 | ||||||
| 2026-04-02 | 13F | Marex Group plc | 0 | -100,00 | 0 | -100,00 | ||||
| 2026-02-10 | 13F | Moors & Cabot, Inc. | 6.479 | 0,00 | 265 | -5,38 | ||||
| 2026-01-26 | 13F | Abundance Wealth Counselors | 7.081 | 290 | ||||||
| 2026-02-17 | 13F | Advisory Services Network, LLC | 12.263 | 3,29 | 502 | -1,96 | ||||
| 2026-01-30 | 13F | Bogart Wealth, LLC | 44 | 0,00 | 2 | 0,00 | ||||
| 2026-02-17 | 13F | LaSalle St. Investment Advisors, LLC | 15.305 | -18,55 | 1 | |||||
| 2025-11-14 | 13F | WNY Asset Management, LLC | 0 | -100,00 | 0 | |||||
| 2026-01-29 | 13F | Comerica Bank | 1.111 | 27,85 | 45 | 21,62 | ||||
| 2026-01-30 | 13F | Verity Asset Management, Inc. | 12.258 | 11,05 | 501 | 5,47 | ||||
| 2026-02-17 | 13F | Saba Capital Management, L.P. | 0 | -100,00 | 0 | |||||
| 2026-01-26 | 13F | Cwm, Llc | 2.000 | 0,00 | 0 | |||||
| 2026-02-02 | 13F | Wolverine Asset Management Llc | 1.078 | -78,95 | 44 | -80,00 | ||||
| 2026-02-17 | 13F | Laird Norton Trust Company, Llc | 8.610 | 352 | ||||||
| 2026-02-18 | 13F | GWM Advisors LLC | 5.162 | -4,64 | 211 | -9,44 | ||||
| 2026-02-14 | 13F | Rockefeller Capital Management L.P. | 1.892 | 255,64 | 77 | 250,00 | ||||
| 2026-02-04 | 13F | Atlantic Union Bankshares Corp | 243 | 0,00 | 10 | -10,00 | ||||
| 2026-02-13 | 13F | Meixler Investment Management, Ltd. | 96.186 | 3,62 | 3.934 | -1,63 |