Grundlæggende statistik
| Institutionelle ejere | 77 total, 77 long only, 0 short only, 0 long/short - change of 2,67% MRQ |
| Gennemsnitlig porteføljeallokering | 0.7866 % - change of -0,31% MRQ |
| Institutionelle aktier (lange) | 3.838.066 (ex 13D/G) - change of 0,33MM shares 9,51% MRQ |
| Institutionel værdi (lang) | $ 137.458 USD ($1000) |
Institutionelt ejerskab og aktionærer
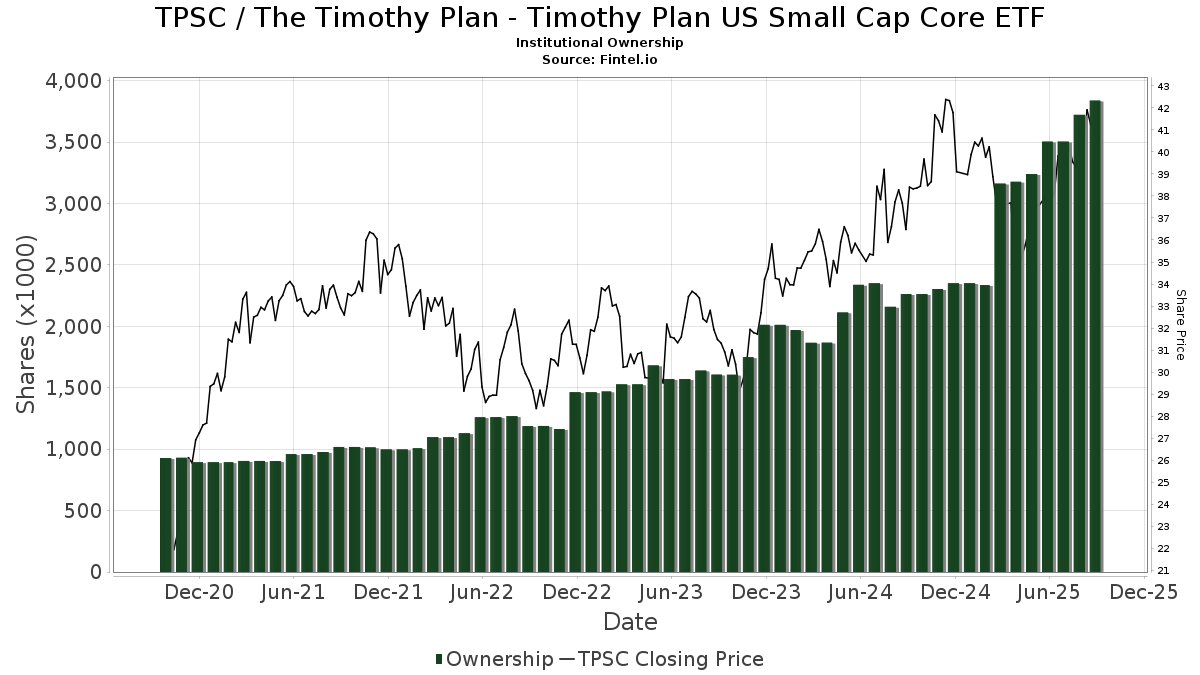
The Timothy Plan - Timothy Plan US Small Cap Core ETF (US:TPSC) har 77 institutionelle ejere og aktionærer, der har indsendt 13D/G- eller 13F-formularer til Securities Exchange Commission (SEC). Disse institutioner har i alt 3,838,066 aktier. Største aktionærer omfatter TPLNX - Timothy Small-Cap Value Fund Class A, LPL Financial LLC, Christian Investment Advisors, Inc., Bare Financial Services, Inc, Creative Financial Designs Inc /adv, Ambassador Advisors, LLC, O'Connor Financial Group LLC, Change Path, LLC, Turning Point Benefit Group, Inc., and Kestra Advisory Services, LLC .
The Timothy Plan - Timothy Plan US Small Cap Core ETF (ARCA:TPSC) institutionel ejerskabsstruktur viser aktuelle positioner i virksomheden efter institutioner og fonde, samt seneste ændringer i positionsstørrelse. Større aktionærer kan omfatte individuelle investorer, investeringsforeninger, hedgefonde eller institutioner. Skema 13D angiver, at investoren besidder (eller besidder) mere end 5 % af virksomheden og har til hensigt (eller har til hensigt at) aktivt at forfølge en ændring i forretningsstrategi. Skema 13G indikerer en passiv investering på over 5%.
The share price as of September 8, 2025 is 41,70 / share. Previously, on September 9, 2024, the share price was 36,76 / share. This represents an increase of 13,43% over that period.
Fondens stemningsscore
Fund Sentiment Score (fka Ownership Accumulation Score) finder de aktier, der bliver mest købt af fonde. Det er resultatet af en sofistikeret, multi-faktor kvantitativ model, der identificerer virksomheder med de højeste niveauer af institutionel akkumulering. Scoringsmodellen bruger en kombination af den samlede stigning i oplyste ejere, ændringerne i porteføljeallokeringer i disse ejere og andre målinger. Tallet går fra 0 til 100, hvor højere tal indikerer et højere niveau af akkumulering for sine jævnaldrende, og 50 er gennemsnittet.
Opdateringsfrekvens: Dagligt
Se Ownership Explorer, som giver en liste over højest rangerende virksomheder.
Institutionel Put/Call-forhold
Ud over at indberette standardaktie- og gældsudstedelser skal institutter med mere end 100 mill. aktiver under forvaltning også oplyse deres put- og call-optionsbeholdninger. Da salgsoptioner generelt indikerer negativ stemning, og købsoptioner indikerer positiv stemning, kan vi få en fornemmelse af den overordnede institutionelle stemning ved at plotte forholdet mellem put og kald. Diagrammet til højre viser det historiske put/call-forhold for dette instrument.
Brug af Put/Call Ratio som en indikator for investorernes stemning overvinder en af de vigtigste mangler ved at bruge totalt institutionelt ejerskab, som er, at en betydelig mængde af aktiver under forvaltning investeres passivt for at spore indekser. Passivt forvaltede fonde køber typisk ikke optioner, så indikatoren for put/call-forholdet følger mere nøje følelsen af aktivt forvaltede fonde.
13F og NPORT arkivering
Detaljer om 13F-arkivering er gratis. Detaljer om NP-ansøgninger kræver et premium-medlemskab. Grønne rækker angiver nye positioner. Røde rækker angiver lukkede positioner. Klik på linket ikon for at se den fulde transaktionshistorik.
Opgrader
for at låse premium-data op og eksportere til Excel ![]() .
.
| Fil dato | Kilde | Investor | Type | Gennemsnitlig pris (Øst) |
Aktier | Δ Aktier (%) |
Rapporteret Værdi ($1000) |
Δ Værdi (%) |
Port Alloc (%) |
|
|---|---|---|---|---|---|---|---|---|---|---|
| 2025-07-31 | 13F | Cambridge Investment Research Advisors, Inc. | 62.492 | -7,20 | 2 | 0,00 | ||||
| 2025-07-15 | 13F | Mather Group, Llc. | 0 | -100,00 | 0 | |||||
| 2025-07-03 | 13F | TrueWealth Advisors, LLC | 16.653 | 1,14 | 644 | 5,75 | ||||
| 2025-07-09 | 13F | Dynamic Advisor Solutions LLC | 0 | -100,00 | 0 | |||||
| 2025-07-14 | 13F | Sowell Financial Services LLC | 48.789 | 1.887 | ||||||
| 2025-08-04 | 13F | Creative Financial Designs Inc /adv | 206.062 | -7,99 | 7.970 | -3,88 | ||||
| 2025-07-24 | 13F | IFP Advisors, Inc | 47.526 | 181,99 | 1.838 | 194,55 | ||||
| 2025-08-14 | 13F | Fmr Llc | 102 | -57,14 | 4 | -62,50 | ||||
| 2025-04-22 | 13F | Synergy Financial Management, LLC | 0 | -100,00 | 0 | |||||
| 2025-07-25 | 13F | Atria Wealth Solutions, Inc. | 10.892 | 15,87 | 437 | 25,29 | ||||
| 2025-08-12 | 13F | OneAscent Financial Services LLC | 118.632 | -43,56 | 5 | -42,86 | ||||
| 2025-05-06 | 13F | Atria Investments Llc | 0 | -100,00 | 0 | -100,00 | ||||
| 2025-07-30 | 13F | Strategic Blueprint, LLC | 16.002 | -20,69 | 619 | -17,27 | ||||
| 2025-08-01 | 13F | Rossby Financial, LCC | 2.101 | 1.411,51 | 81 | 1.925,00 | ||||
| 2025-08-14 | 13F | Schwallier Wealth Management LLC | 6.631 | -4,48 | 257 | -0,39 | ||||
| 2025-04-23 | 13F | Mascagni Wealth Management, Inc. | 0 | -100,00 | 0 | -100,00 | ||||
| 2025-05-14 | 13F | Northwestern Mutual Wealth Management Co | 0 | -100,00 | 0 | |||||
| 2025-08-06 | 13F | OneAscent Wealth Management LLC | 37.709 | 20,25 | 1 | 0,00 | ||||
| 2025-07-14 | 13F | AdvisorNet Financial, Inc | 1.034 | 68,95 | 40 | 77,27 | ||||
| 2025-07-25 | 13F | Midwest Capital Advisors, LLC | 1.870 | 0,05 | 72 | 4,35 | ||||
| 2025-08-14 | 13F | CoreCap Advisors, LLC | 320 | 0,00 | 12 | 9,09 | ||||
| 2025-08-27 | NP | TSGAX - Timothy Strategic Growth Fund Class A | 101.423 | 0,00 | 3.923 | 4,47 | ||||
| 2025-08-06 | 13F | Sound Financial Strategies Group, LLC | 42.392 | -5,28 | 1.640 | -1,09 | ||||
| 2025-08-13 | 13F | Jones Financial Companies Lllp | 17.161 | 42,59 | 664 | 49,89 | ||||
| 2025-05-02 | 13F | Transcendent Capital Group LLC | 0 | -100,00 | 0 | |||||
| 2025-08-27 | NP | TCGAX - Timothy Conservative Growth Fund Class A | 99.105 | -9,17 | 3.833 | -5,12 | ||||
| 2025-07-14 | 13F | Sound Stewardship, LLC | 24.161 | -0,54 | 935 | 3,89 | ||||
| 2025-08-07 | 13F | Efficient Advisors, LLC | 0 | -100,00 | 0 | |||||
| 2025-08-12 | 13F | Winnow Wealth Llc | 0 | -100,00 | 0 | -100,00 | ||||
| 2025-05-06 | 13F | AE Wealth Management LLC | 0 | -100,00 | 0 | -100,00 | ||||
| 2025-08-11 | 13F | Strategic Equity Management | 22.792 | 14,06 | 882 | 19,22 | ||||
| 2025-08-08 | 13F | Cetera Investment Advisers | 35.109 | 15,17 | 1.358 | 20,39 | ||||
| 2025-08-11 | 13F | Mosaic Family Wealth Partners, Llc | 6.345 | 3,02 | 245 | 7,46 | ||||
| 2025-05-16 | 13F | Coppell Advisory Solutions LLC | 0 | -100,00 | 0 | |||||
| 2025-08-11 | 13F | United Capital Financial Advisers, Llc | 17.240 | 36,31 | 667 | 42,31 | ||||
| 2025-08-12 | 13F | Change Path, LLC | 143.059 | 4,72 | 5.534 | 9,39 | ||||
| 2025-08-14 | 13F | Susquehanna International Group, Llp | 20.228 | 15,96 | 782 | 21,24 | ||||
| 2025-08-11 | 13F | HHM Wealth Advisors, LLC | 4.068 | 26,41 | 157 | 31,93 | ||||
| 2025-07-28 | 13F | Harbour Investments, Inc. | 1.447 | -20,89 | 56 | -17,91 | ||||
| 2025-08-13 | 13F | Cerity Partners LLC | 24.755 | 0,00 | 958 | 4,48 | ||||
| 2025-07-11 | 13F | Pioneer Wealth Management Group | 6.974 | 270 | ||||||
| 2025-08-19 | 13F | Advisory Services Network, LLC | 7.184 | -4,56 | 281 | 1,08 | ||||
| 2025-07-10 | 13F | Wealth Enhancement Advisory Services, Llc | 5.366 | -65,34 | 215 | -62,48 | ||||
| 2025-07-10 | 13F | Oliver Lagore Vanvalin Investment Group | 1.145 | -27,81 | 42 | -31,15 | ||||
| 2025-09-04 | 13F/A | Advisor Group Holdings, Inc. | 21.133 | 14,00 | 818 | 19,10 | ||||
| 2025-08-08 | 13F | SageOak Financial, LLC | 19.041 | 52,07 | 737 | 58,96 | ||||
| 2025-08-13 | 13F | Bare Financial Services, Inc | 234.255 | 7,43 | 9.061 | 12,21 | ||||
| 2025-08-15 | 13F | Morgan Stanley | 1 | 0 | ||||||
| 2025-08-07 | 13F | Allworth Financial LP | 15.796 | 67,77 | 611 | 81,31 | ||||
| 2025-08-12 | 13F | J.w. Cole Advisors, Inc. | 20.664 | 0,50 | 799 | 4,99 | ||||
| 2025-07-07 | 13F | Whitaker-Myers Wealth Managers, LTD. | 10.742 | -1,00 | 415 | 3,49 | ||||
| 2025-08-01 | 13F | Envestnet Asset Management Inc | 25.796 | 1,01 | 998 | 5,50 | ||||
| 2025-08-14 | 13F | Comerica Bank | 98 | 12,64 | 4 | 0,00 | ||||
| 2025-07-18 | 13F | Vicus Capital | 16.383 | 8,43 | 634 | 13,24 | ||||
| 2025-07-29 | 13F | Values First Advisors, Inc. | 1.355 | -53,74 | 52 | -51,85 | ||||
| 2025-07-17 | 13F | Kavar Capital Partners Group, Llc | 6.974 | 19,75 | 270 | 25,12 | ||||
| 2025-08-14 | 13F | Raymond James Financial Inc | 5.444 | -3,85 | 211 | 0,48 | ||||
| 2025-07-23 | 13F | Valmark Advisers, Inc. | 63.390 | 10,81 | 2.452 | 15,72 | ||||
| 2025-08-12 | 13F | Nemes Rush Group LLC | 1.240 | 0,00 | 48 | 4,44 | ||||
| 2025-07-24 | 13F | Ronald Blue Trust, Inc. | 1.487 | 30,90 | 58 | 35,71 | ||||
| 2025-08-13 | 13F | EverSource Wealth Advisors, LLC | 69.149 | 10,76 | 2.675 | 15,71 | ||||
| 2025-08-18 | 13F | N.E.W. Advisory Services LLC | 170 | -92,66 | 7 | -92,94 | ||||
| 2025-08-12 | 13F | Proequities, Inc. | 0 | 0 | ||||||
| 2025-07-07 | 13F | O'Connor Financial Group LLC | 153.339 | 2,56 | 6.152 | 11,11 | ||||
| 2025-08-27 | NP | TPLNX - Timothy Small-Cap Value Fund Class A | 580.000 | 0,00 | 22.434 | 4,46 | ||||
| 2025-08-14 | 13F | Citadel Advisors Llc | 42.444 | 8,59 | 1.642 | 13,41 | ||||
| 2025-04-22 | 13F | Jfs Wealth Advisors, Llc | 0 | -100,00 | 0 | |||||
| 2025-08-08 | 13F | Larson Financial Group LLC | 571 | 9,60 | 22 | 15,79 | ||||
| 2025-08-15 | 13F/A | Symphony Financial, Ltd. Co. | 10.630 | 78,90 | 423 | 110,45 | ||||
| 2025-08-06 | 13F | Commonwealth Equity Services, Llc | 11.917 | 3,50 | 0 | |||||
| 2025-08-11 | 13F | Principal Securities, Inc. | 1.281 | -27,38 | 50 | -27,94 | ||||
| 2025-08-14 | 13F | Royal Bank Of Canada | 387 | 15 | ||||||
| 2025-08-06 | 13F | Christian Investment Advisors, Inc. | 274.338 | -16,28 | 10.611 | -16,74 | ||||
| 2025-08-14 | 13F | UBS Group AG | 10.186 | 25,41 | 394 | 31,00 | ||||
| 2025-07-17 | 13F | XY Planning Network, Inc. | 44.373 | 55,94 | 1.716 | 62,96 | ||||
| 2025-08-04 | 13F | Creekmur Asset Management LLC | 163 | 0,00 | 6 | 0,00 | ||||
| 2025-08-15 | 13F | Kestra Advisory Services, LLC | 130.041 | 29,28 | 5.030 | 35,04 | ||||
| 2025-08-13 | 13F | GeoWealth Management, LLC | 408 | 12,09 | 16 | 15,38 | ||||
| 2025-08-14 | 13F | Ambassador Advisors, LLC | 186.107 | 0,13 | 7.199 | 4,59 | ||||
| 2025-08-12 | 13F | LPL Financial LLC | 380.406 | 78,66 | 14.714 | 86,63 | ||||
| 2025-08-18 | 13F | Geneos Wealth Management Inc. | 8.874 | 35,30 | 343 | 41,74 | ||||
| 2025-07-21 | 13F | Ameritas Advisory Services, LLC | 400 | 15 | ||||||
| 2025-07-25 | 13F | Envestnet Portfolio Solutions, Inc. | 8.342 | -27,37 | 323 | -24,24 | ||||
| 2025-07-31 | 13F | Turning Point Benefit Group, Inc. | 134.541 | 1.087,27 | 5.204 | 1.269,47 | ||||
| 2025-07-25 | 13F | Cwm, Llc | 46.911 | 2,45 | 2 | 0,00 | ||||
| 2025-08-14 | 13F | Arete Wealth Advisors, LLC | 12.670 | 45,52 | 0 | |||||
| 2025-08-15 | 13F | First Heartland Consultants, Inc. | 42.431 | 3,03 | 1.641 | 7,68 | ||||
| 2025-08-12 | 13F | Frontier Asset Management, LLC | 50.054 | 12,49 | 1.936 | 17,55 | ||||
| 2025-07-28 | 13F | RFG Advisory, LLC | 18.595 | 25,97 | 719 | 31,68 | ||||
| 2025-07-16 | 13F | Moneywise, Inc. | 18.770 | 10,04 | 726 | 15,06 |