Grundlæggende statistik
| Institutionelle ejere | 148 total, 148 long only, 0 short only, 0 long/short - change of 12,88% MRQ |
| Gennemsnitlig porteføljeallokering | 0.1798 % - change of -5,12% MRQ |
| Institutionelle aktier (lange) | 6.065.021 (ex 13D/G) - change of 1,45MM shares 31,54% MRQ |
| Institutionel værdi (lang) | $ 364.095 USD ($1000) |
Institutionelt ejerskab og aktionærer
The RBB Fund, Inc. - Motley Fool 100 Index ETF (US:TMFC) har 148 institutionelle ejere og aktionærer, der har indsendt 13D/G- eller 13F-formularer til Securities Exchange Commission (SEC). Disse institutioner har i alt 6,065,021 aktier. Største aktionærer omfatter Amplius Wealth Advisors, LLC, LPL Financial LLC, Raymond James Financial Inc, Portfolio Strategies, Inc., Private Advisor Group, LLC, Royal Bank Of Canada, Cambridge Investment Research Advisors, Inc., Wells Fargo & Company/mn, Advisor Group Holdings, Inc., and Two Sigma Investments, Lp .
The RBB Fund, Inc. - Motley Fool 100 Index ETF (BATS:TMFC) institutionel ejerskabsstruktur viser aktuelle positioner i virksomheden efter institutioner og fonde, samt seneste ændringer i positionsstørrelse. Større aktionærer kan omfatte individuelle investorer, investeringsforeninger, hedgefonde eller institutioner. Skema 13D angiver, at investoren besidder (eller besidder) mere end 5 % af virksomheden og har til hensigt (eller har til hensigt at) aktivt at forfølge en ændring i forretningsstrategi. Skema 13G indikerer en passiv investering på over 5%.
The share price as of September 9, 2025 is 68,52 / share. Previously, on September 10, 2024, the share price was 53,39 / share. This represents an increase of 28,34% over that period.

Fondens stemningsscore
Fund Sentiment Score (fka Ownership Accumulation Score) finder de aktier, der bliver mest købt af fonde. Det er resultatet af en sofistikeret, multi-faktor kvantitativ model, der identificerer virksomheder med de højeste niveauer af institutionel akkumulering. Scoringsmodellen bruger en kombination af den samlede stigning i oplyste ejere, ændringerne i porteføljeallokeringer i disse ejere og andre målinger. Tallet går fra 0 til 100, hvor højere tal indikerer et højere niveau af akkumulering for sine jævnaldrende, og 50 er gennemsnittet.
Opdateringsfrekvens: Dagligt
Se Ownership Explorer, som giver en liste over højest rangerende virksomheder.
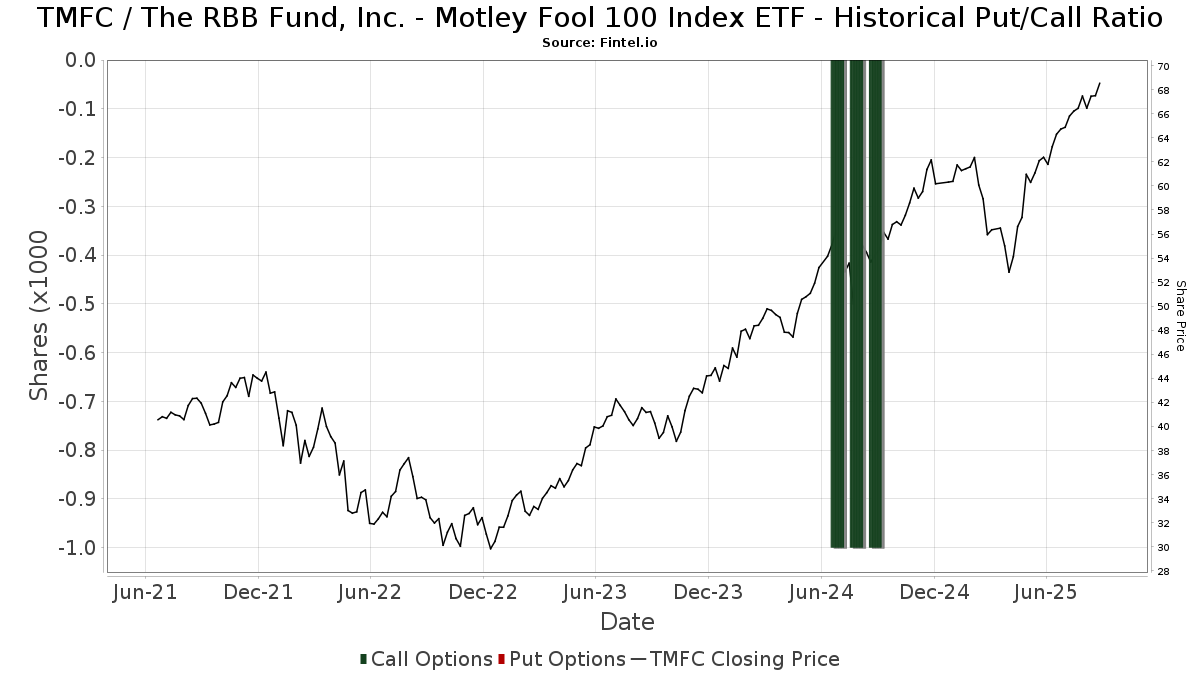
Institutionel Put/Call-forhold
Ud over at indberette standardaktie- og gældsudstedelser skal institutter med mere end 100 mill. aktiver under forvaltning også oplyse deres put- og call-optionsbeholdninger. Da salgsoptioner generelt indikerer negativ stemning, og købsoptioner indikerer positiv stemning, kan vi få en fornemmelse af den overordnede institutionelle stemning ved at plotte forholdet mellem put og kald. Diagrammet til højre viser det historiske put/call-forhold for dette instrument.
Brug af Put/Call Ratio som en indikator for investorernes stemning overvinder en af de vigtigste mangler ved at bruge totalt institutionelt ejerskab, som er, at en betydelig mængde af aktiver under forvaltning investeres passivt for at spore indekser. Passivt forvaltede fonde køber typisk ikke optioner, så indikatoren for put/call-forholdet følger mere nøje følelsen af aktivt forvaltede fonde.
13F og NPORT arkivering
Detaljer om 13F-arkivering er gratis. Detaljer om NP-ansøgninger kræver et premium-medlemskab. Grønne rækker angiver nye positioner. Røde rækker angiver lukkede positioner. Klik på linket ikon for at se den fulde transaktionshistorik.
Opgrader
for at låse premium-data op og eksportere til Excel ![]() .
.
| Fil dato | Kilde | Investor | Type | Gennemsnitlig pris (Øst) |
Aktier | Δ Aktier (%) |
Rapporteret Værdi ($1000) |
Δ Værdi (%) |
Port Alloc (%) |
|
|---|---|---|---|---|---|---|---|---|---|---|
| 2025-08-14 | 13F | Atomi Financial Group, Inc. | 14.461 | 12,21 | 933 | 30,17 | ||||
| 2025-08-14 | 13F | Wells Fargo & Company/mn | 286.630 | 1,42 | 18.491 | 17,63 | ||||
| 2025-07-18 | 13F | Bartlett & Co. Wealth Management Llc | 400 | 0,00 | 26 | 13,64 | ||||
| 2025-08-05 | 13F | Corps Capital Advisors, LLC | 6.698 | 6,61 | 432 | 23,78 | ||||
| 2025-08-12 | 13F | J.w. Cole Advisors, Inc. | 5.041 | 9,90 | 325 | 27,45 | ||||
| 2025-08-11 | 13F | Advisor Resource Council | 0 | -100,00 | 0 | |||||
| 2025-07-30 | 13F | Whittier Trust Co | 15 | 0,00 | 1 | |||||
| 2025-08-12 | 13F | CIBC Private Wealth Group, LLC | 1.000 | 0,00 | 65 | 30,61 | ||||
| 2025-08-14 | 13F | Federation des caisses Desjardins du Quebec | 1.390 | 0,00 | 90 | 15,58 | ||||
| 2025-08-18 | 13F | Tyler-Stone Wealth Management | 3.176 | 205 | ||||||
| 2025-07-23 | 13F | Nbt Bank N A /ny | 500 | 0,00 | 32 | 18,52 | ||||
| 2025-07-16 | 13F | Perigon Wealth Management, LLC | 12.663 | 2,01 | 817 | 18,26 | ||||
| 2025-08-12 | 13F | LPL Financial LLC | 790.191 | 18,88 | 50.975 | 37,89 | ||||
| 2025-08-14 | 13F | Bank Of America Corp /de/ | 50 | 0,00 | 3 | 50,00 | ||||
| 2025-08-13 | 13F | Northwestern Mutual Wealth Management Co | 27.670 | 278,52 | 1.785 | 339,41 | ||||
| 2025-08-18 | 13F | Geneos Wealth Management Inc. | 100 | 0,00 | 6 | 20,00 | ||||
| 2025-08-11 | 13F | Aptus Capital Advisors, LLC | 297 | 0,00 | 19 | 18,75 | ||||
| 2025-08-11 | 13F | Mill Creek Capital Advisors, LLC | 3.653 | 0,00 | 236 | 15,76 | ||||
| 2025-07-29 | 13F | Elevation Capital Advisory, LLC | 47.765 | 9,83 | 3.081 | 27,42 | ||||
| 2025-04-23 | 13F | B.O.S.S. Retirement Advisors, LLC | 0 | -100,00 | 0 | |||||
| 2025-07-30 | 13F | Bogart Wealth, LLC | 8 | 0,00 | 1 | |||||
| 2025-07-30 | 13F | Pittenger & Anderson Inc | 150 | 0,00 | 10 | 12,50 | ||||
| 2025-08-27 | 13F/A | Brinker Capital Investments, LLC | 4.035 | -19,41 | 260 | -6,47 | ||||
| 2025-08-14 | 13F | Two Sigma Investments, Lp | 108.400 | 6.993 | ||||||
| 2025-07-11 | 13F | Farther Finance Advisors, LLC | 403 | 71,49 | 26 | 100,00 | ||||
| 2025-07-25 | 13F | Concurrent Investment Advisors, LLC | 7.700 | 5,18 | 497 | 21,87 | ||||
| 2025-07-16 | 13F | Signaturefd, Llc | 17 | 1 | ||||||
| 2025-08-13 | 13F | RIA Advisory Group LLC | 12.756 | 823 | ||||||
| 2025-08-14 | 13F | Old Mission Capital Llc | 0 | -100,00 | 0 | |||||
| 2025-05-09 | 13F | GeoWealth Management, LLC | 0 | -100,00 | 0 | -100,00 | ||||
| 2025-05-15 | 13F/A | Orion Portfolio Solutions, LLC | 5.007 | 278 | ||||||
| 2025-08-11 | 13F | Private Advisor Group, LLC | 381.122 | 1.219,49 | 24.586 | 1.430,88 | ||||
| 2025-07-22 | 13F | DAVENPORT & Co LLC | 15.875 | 1,28 | 1.024 | 17,57 | ||||
| 2025-08-12 | 13F | Proequities, Inc. | 0 | 0 | ||||||
| 2025-08-12 | 13F | Global Retirement Partners, LLC | 1.350 | 0,00 | 87 | 7,41 | ||||
| 2025-07-10 | 13F | Wealth Enhancement Advisory Services, Llc | 8.641 | 26,18 | 561 | 47,37 | ||||
| 2025-07-31 | 13F | Cambridge Investment Research Advisors, Inc. | 299.710 | 7,70 | 19 | 26,67 | ||||
| 2025-08-13 | 13F | Keystone Financial Group | 10.713 | -2,43 | 691 | 13,28 | ||||
| 2025-08-14 | 13F | Royal Bank Of Canada | 316.323 | 98,69 | 20.406 | 130,42 | ||||
| 2025-07-09 | 13F | Lbmc Investment Advisors, Llc | 3.364 | 217 | ||||||
| 2025-08-12 | 13F | Integrated Advisors Network LLC | 3.842 | 248 | ||||||
| 2025-07-31 | 13F | Wealthfront Advisers Llc | 60.436 | 2,10 | 3.899 | 18,41 | ||||
| 2025-04-21 | 13F | Nelson, Van Denburg & Campbell Wealth Management Group, LLC | 0 | -100,00 | 0 | |||||
| 2025-08-08 | 13F | Gts Securities Llc | 38.952 | 2.513 | ||||||
| 2025-05-28 | NP | TFAFX - Tactical Growth Allocation Fund Class I | 0 | -100,00 | 0 | -100,00 | ||||
| 2025-07-30 | 13F | Cullen/frost Bankers, Inc. | 181 | 0,00 | 12 | 10,00 | ||||
| 2025-07-30 | 13F | D.a. Davidson & Co. | 3.550 | 229 | ||||||
| 2025-08-14 | 13F | IHT Wealth Management, LLC | 86.500 | 1,23 | 5.580 | 17,42 | ||||
| 2025-07-02 | 13F | Howard Financial Services, Ltd. | 4.969 | 0,00 | 321 | 15,94 | ||||
| 2025-08-19 | 13F | Newbridge Financial Services Group, Inc. | 14.633 | 2.826,60 | 944 | 3.392,59 | ||||
| 2025-04-14 | 13F | Lloyd Advisory Services, LLC. | 0 | -100,00 | 0 | |||||
| 2025-07-07 | 13F | Bangor Savings Bank | 127 | 8 | ||||||
| 2025-08-12 | 13F | Archer Investment Corp | 100 | 6 | ||||||
| 2025-08-18 | 13F | N.E.W. Advisory Services LLC | 26 | 0,00 | 2 | 0,00 | ||||
| 2025-08-12 | 13F | Calton & Associates, Inc. | 24.818 | -3,48 | 1.601 | 11,96 | ||||
| 2025-07-07 | 13F | TruWealth Advisors, LLC | 3.302 | 213 | ||||||
| 2025-08-12 | 13F | MAI Capital Management | 265 | 32,50 | 17 | 54,55 | ||||
| 2025-05-01 | 13F | Quest 10 Wealth Builders, Inc. | 0 | -100,00 | 0 | |||||
| 2025-08-13 | 13F | Marshall Wace, Llp | 8.664 | 559 | ||||||
| 2025-08-14 | 13F | Jane Street Group, Llc | 0 | -100,00 | 0 | |||||
| 2025-07-30 | 13F | Avidian Wealth Solutions, LLC | 28.349 | 0,60 | 1.829 | 16,66 | ||||
| 2025-08-05 | 13F | Key FInancial Inc | 15 | 0,00 | 1 | |||||
| 2025-05-05 | 13F | Transce3nd, LLC | 0 | -100,00 | 0 | |||||
| 2025-07-21 | 13F | Ameritas Advisory Services, LLC | 424 | 27 | ||||||
| 2025-08-12 | 13F | Jpmorgan Chase & Co | 250 | 150,00 | 16 | 220,00 | ||||
| 2025-08-07 | 13F | Sound View Wealth Advisors Group, LLC | 17.388 | 8,44 | 1.122 | 25,81 | ||||
| 2025-08-11 | 13F | Pineridge Advisors LLC | 0 | -100,00 | 0 | |||||
| 2025-08-11 | 13F | HighTower Advisors, LLC | 14.021 | 0,16 | 905 | 16,20 | ||||
| 2025-08-08 | 13F | Creative Planning | 20.785 | -0,65 | 1.341 | 15,22 | ||||
| 2025-08-14 | 13F | Planwiser Financial, Llc | 21.918 | -1,92 | 1.457 | 13,57 | ||||
| 2025-07-24 | 13F | Us Bancorp \de\ | 738 | 0,00 | 48 | 14,63 | ||||
| 2025-05-05 | 13F | Lindbrook Capital, Llc | 1.389 | 55,54 | 77 | 45,28 | ||||
| 2025-07-25 | 13F | Almanack Investment Partners, LLC. | 5.665 | 33,20 | 365 | 54,66 | ||||
| 2025-07-11 | 13F | SILVER OAK SECURITIES, Inc | 0 | -100,00 | 0 | |||||
| 2025-08-08 | 13F | Glassman Wealth Services | 5.990 | 0,00 | 386 | 15,92 | ||||
| 2025-06-10 | 13F | Birchbrook, Inc. | 0 | -100,00 | 0 | -100,00 | ||||
| 2025-07-29 | 13F | Koshinski Asset Management, Inc. | 2.366 | 4,28 | 1.365 | 6,31 | ||||
| 2025-08-11 | 13F | TRUE Private Wealth Advisors | 6.561 | 423 | ||||||
| 2025-08-14 | 13F | Stifel Financial Corp | 46.548 | 83,57 | 3.003 | 112,91 | ||||
| 2025-04-22 | 13F | Synergy Financial Management, LLC | 0 | -100,00 | 0 | |||||
| 2025-08-08 | 13F | Wiser Advisor Group LLC | 0 | -100,00 | 0 | |||||
| 2025-04-23 | 13F | Mascagni Wealth Management, Inc. | 0 | -100,00 | 0 | -100,00 | ||||
| 2025-05-16 | 13F/A | Goldman Sachs Group Inc | 0 | -100,00 | 0 | -100,00 | ||||
| 2025-08-06 | 13F | Aspect Partners, LLC | 8 | -27,27 | 1 | |||||
| 2025-07-31 | 13F | Carrera Capital Advisors | 5.592 | 0,00 | 361 | 15,76 | ||||
| 2025-08-12 | 13F | AlphaCore Capital LLC | 4.890 | 315 | ||||||
| 2025-05-02 | 13F | Cable Hill Partners, LLC | 5.825 | -29,82 | 330 | -33,94 | ||||
| 2025-08-11 | 13F | Strategic Wealth Partners, Ltd. | 235 | 15 | ||||||
| 2025-08-14 | 13F | Mml Investors Services, Llc | 16.336 | 4,60 | 1 | |||||
| 2025-08-12 | 13F | Richmond Investment Services, LLC | 24.200 | 6,76 | 1.561 | 23,89 | ||||
| 2025-08-01 | 13F | Envestnet Asset Management Inc | 39.276 | 73,35 | 2.534 | 101,03 | ||||
| 2025-08-13 | 13F | Lido Advisors, LLC | 3.201 | -46,18 | 207 | -37,58 | ||||
| 2025-08-14 | 13F | GWM Advisors LLC | 604 | 179,63 | 39 | 216,67 | ||||
| 2025-07-29 | 13F | Dale Q Rice Investment Management Ltd | 24.690 | -48,77 | 1.602 | -40,26 | ||||
| 2025-08-06 | 13F | AE Wealth Management LLC | 16.030 | 201,26 | 1.034 | 250,51 | ||||
| 2025-07-10 | 13F | Capital Advisory Group Advisory Services, LLC | 61.012 | 17,42 | 3.936 | 36,16 | ||||
| 2025-07-14 | 13F | Signature Securities Group Corporation | 0 | -100,00 | 0 | |||||
| 2025-08-08 | 13F | Avantax Advisory Services, Inc. | 3.702 | -7,50 | 239 | 7,21 | ||||
| 2025-08-05 | 13F | Huntington National Bank | 6 | 0,00 | ||||||
| 2025-08-08 | 13F | Cetera Investment Advisers | 64.953 | 30,25 | 4.190 | 51,10 | ||||
| 2025-07-24 | 13F | IFP Advisors, Inc | 4.254 | 261,73 | 274 | 321,54 | ||||
| 2025-08-12 | 13F | SRS Capital Advisors, Inc. | 6.888 | 0,00 | 444 | 15,93 | ||||
| 2025-08-15 | 13F | Equitable Holdings, Inc. | 15.187 | -3,33 | 980 | 12,14 | ||||
| 2025-07-25 | 13F | Envestnet Portfolio Solutions, Inc. | 14.419 | 91,03 | 930 | 121,96 | ||||
| 2025-08-19 | 13F | Asset Dedication, LLC | 318 | 0,00 | 21 | 17,65 | ||||
| 2025-08-12 | 13F | Steward Partners Investment Advisory, Llc | 578 | 0,00 | 37 | 15,63 | ||||
| 2025-07-15 | 13F | Armis Advisers, LLC | 5.996 | -0,08 | 386 | 13,86 | ||||
| 2025-08-04 | 13F | Amplius Wealth Advisors, LLC | 873.033 | -3,16 | 56.315 | 12,30 | ||||
| 2025-07-25 | 13F | Cwm, Llc | 200 | -44,29 | 0 | |||||
| 2025-08-04 | 13F | Assetmark, Inc | 3 | 0,00 | 0 | |||||
| 2025-08-14 | 13F | Fmr Llc | 18.827 | 2,44 | 1.215 | 18,79 | ||||
| 2025-08-08 | 13F | Flaharty Asset Management, LLC | 0 | -100,00 | 0 | |||||
| 2025-08-14 | 13F | Susquehanna International Group, Llp | 0 | -100,00 | 0 | |||||
| 2025-08-04 | 13F | Spire Wealth Management | 9.511 | 1.429,10 | 614 | 1.702,94 | ||||
| 2025-08-14 | 13F | LaSalle St. Investment Advisors, LLC | 11.671 | 1 | ||||||
| 2025-08-07 | 13F | Parkside Financial Bank & Trust | 1.123 | 72 | ||||||
| 2025-08-11 | 13F | Brown Brothers Harriman & Co | 2.950 | 18,00 | 190 | 36,69 | ||||
| 2025-07-17 | 13F | Sound Income Strategies, LLC | 879 | 57 | ||||||
| 2025-08-08 | 13F | Larson Financial Group LLC | 44.798 | 25,78 | 2.890 | 45,91 | ||||
| 2025-08-12 | 13F | Coldstream Capital Management Inc | 5.825 | 14.462,50 | 376 | 18.650,00 | ||||
| 2025-07-28 | 13F | Frazier Financial Advisors, LLC | 267 | 17 | ||||||
| 2025-08-14 | 13F | Visionary Wealth Advisors | 56.314 | 17,91 | 3.633 | 36,75 | ||||
| 2025-07-22 | 13F | Berger Financial Group, Inc | 4.440 | -14,60 | 286 | -1,04 | ||||
| 2025-07-30 | 13F | Green Square Capital Advisors Llc | 19.080 | 1.231 | ||||||
| 2025-08-13 | 13F | Cerity Partners LLC | 11.345 | -0,02 | 732 | 15,85 | ||||
| 2025-05-15 | 13F | Concorde Asset Management, LLC | 3.761 | 5,59 | 207 | -3,74 | ||||
| 2025-08-15 | 13F | Synergy Financial Group, LTD | 44.107 | 6,21 | 2.845 | 23,21 | ||||
| 2025-08-05 | 13F | American Capital Advisory, LLC | 132 | 0,00 | 8 | 14,29 | ||||
| 2025-08-08 | 13F | Thoroughbred Financial Services, Llc | 13.742 | 1 | ||||||
| 2025-08-08 | 13F | Foundations Investment Advisors, LLC | 3.453 | 223 | ||||||
| 2025-08-06 | 13F | Rps Advisory Solutions Llc | 0 | -100,00 | 0 | |||||
| 2025-08-05 | 13F | GPS Wealth Strategies Group, LLC | 42 | 0,00 | 3 | 0,00 | ||||
| 2025-05-15 | 13F | Warren Averett Asset Management, LLC | 0 | -100,00 | 0 | |||||
| 2025-08-14 | 13F/A | Barclays Plc | 3.387 | 0,00 | 0 | |||||
| 2025-08-06 | 13F | Commonwealth Equity Services, Llc | 80.165 | 17,99 | 5 | 66,67 | ||||
| 2025-08-14 | 13F | Raymond James Financial Inc | 693.971 | 82,83 | 44.768 | 112,06 | ||||
| 2025-07-08 | 13F | Parallel Advisors, LLC | 268 | 0,00 | 17 | 21,43 | ||||
| 2025-08-11 | 13F | Intrepid Financial Planning Group LLC | 14.727 | 2,36 | 950 | 18,75 | ||||
| 2025-07-08 | 13F | Strategic Advocates LLC | 7.139 | 19,24 | 461 | 38,14 | ||||
| 2025-07-15 | 13F | FLP Wealth Management, LLC | 0 | -100,00 | 0 | |||||
| 2025-08-14 | 13F | Mariner, LLC | 4.716 | 17,52 | 304 | 36,32 | ||||
| 2025-08-14 | 13F | Great Valley Advisor Group, Inc. | 10.262 | 662 | ||||||
| 2025-08-07 | 13F | Allworth Financial LP | 500 | 0,00 | 32 | 18,52 | ||||
| 2025-09-04 | 13F/A | Advisor Group Holdings, Inc. | 119.000 | 107,24 | 7.677 | 140,36 | ||||
| 2025-07-10 | 13F | Wedmont Private Capital | 3.114 | 202 | ||||||
| 2025-07-25 | 13F | Atria Wealth Solutions, Inc. | 89.291 | 40,36 | 5.760 | 62,80 | ||||
| 2025-08-04 | 13F | Creative Financial Designs Inc /adv | 599 | 0,00 | 39 | 15,15 | ||||
| 2025-07-24 | 13F | JNBA Financial Advisors | 125 | 8 | ||||||
| 2025-08-14 | 13F | Marathon Capital Management | 4.126 | 1,23 | 266 | 17,70 | ||||
| 2025-08-15 | 13F | First Heartland Consultants, Inc. | 10.571 | 17,07 | 682 | 35,66 | ||||
| 2025-08-11 | 13F | Principal Securities, Inc. | 670 | 109,38 | 43 | 126,32 | ||||
| 2025-07-17 | 13F | Janney Montgomery Scott LLC | 13.371 | 32,82 | 1 | |||||
| 2025-08-14 | 13F | Wiley Bros.-aintree Capital, Llc | 47.281 | 7,43 | 3.050 | 25,05 | ||||
| 2025-08-14 | 13F | UBS Group AG | 0 | -100,00 | 0 | |||||
| 2025-07-16 | 13F | Strategic Investment Solutions, Inc. /IL | 50 | 3 | ||||||
| 2025-07-28 | 13F | Mutual Advisors, LLC | 33.436 | 45,05 | 2.215 | 70,91 | ||||
| 2025-08-06 | 13F | Prospera Financial Services Inc | 10.874 | 1,29 | 701 | 17,42 | ||||
| 2025-08-18 | 13F | Hollencrest Capital Management | 1.500 | 0,00 | 97 | 15,66 | ||||
| 2025-07-28 | 13F | RFG Advisory, LLC | 7.980 | -15,82 | 515 | -2,47 | ||||
| 2025-08-14 | 13F | CoreCap Advisors, LLC | 9.071 | -1,90 | 585 | 13,81 | ||||
| 2025-07-08 | 13F | Goldstone Financial Group, LLC | 3.569 | -2,59 | 232 | 13,79 | ||||
| 2025-07-28 | 13F | Harbour Investments, Inc. | 5.415 | 10,20 | 349 | 27,84 | ||||
| 2025-08-11 | 13F | Lowe Brockenbrough & Co Inc | 5.900 | 0,00 | 381 | 15,85 | ||||
| 2025-08-12 | 13F | Titleist Asset Management, Llc | 17.212 | 0,40 | 1.110 | 16,47 | ||||
| 2025-08-15 | 13F | Captrust Financial Advisors | 5.623 | 0,00 | 363 | 16,03 | ||||
| 2025-08-11 | 13F | Western Wealth Management, LLC | 18.639 | 1.202 | ||||||
| 2025-08-05 | 13F | Bank Of Montreal /can/ | 1.100 | 0,00 | 71 | 14,75 | ||||
| 2025-07-17 | 13F | Walker Asset Management, LLC | 71.432 | 9,52 | 4.608 | 27,05 | ||||
| 2025-07-21 | 13F | Portfolio Strategies, Inc. | 439.867 | 9,50 | 28.368 | 26,97 | ||||
| 2025-08-15 | 13F | Morgan Stanley | 16.347 | 25,28 | 1.055 | 45,38 | ||||
| 2025-07-21 | 13F | Cornell Pochily Investment Advisors, Inc. | 3.887 | 5,88 | 251 | 22,55 | ||||
| 2025-08-14 | 13F | Headinvest, Llc | 5.783 | 0,00 | 373 | 16,20 | ||||
| 2025-08-14 | 13F | Comerica Bank | 90 | 0,00 | 6 | 0,00 | ||||
| 2025-08-14 | 13F | Redwood Financial Network Corp | 60.220 | 0,51 | 3.885 | 16,57 |