Grundlæggende statistik
| Institutionelle ejere | 134 total, 134 long only, 0 short only, 0 long/short - change of 6,35% MRQ |
| Gennemsnitlig porteføljeallokering | 0.5912 % - change of 29,55% MRQ |
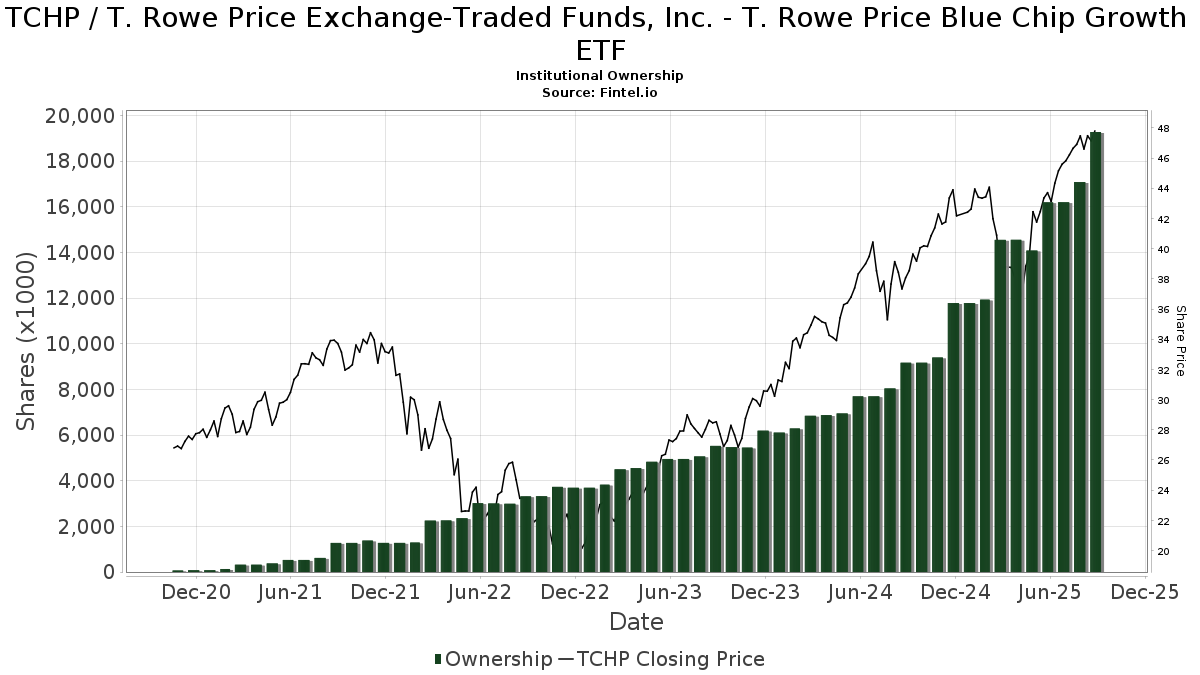
| Institutionelle aktier (lange) | 19.276.564 (ex 13D/G) - change of 3,08MM shares 19,01% MRQ |
| Institutionel værdi (lang) | $ 709.461 USD ($1000) |
Institutionelt ejerskab og aktionærer
T. Rowe Price Exchange-Traded Funds, Inc. - T. Rowe Price Blue Chip Growth ETF (US:TCHP) har 134 institutionelle ejere og aktionærer, der har indsendt 13D/G- eller 13F-formularer til Securities Exchange Commission (SEC). Disse institutioner har i alt 19,276,564 aktier. Største aktionærer omfatter Cetera Investment Advisers, Northwestern Mutual Wealth Management Co, Glenview Trust Co, Bank Of America Corp /de/, PRSGX - Spectrum Growth Fund, Price T Rowe Associates Inc /md/, Trust Co of Kansas, Envestnet Asset Management Inc, Commonwealth Equity Services, Llc, and Jones Financial Companies Lllp .
T. Rowe Price Exchange-Traded Funds, Inc. - T. Rowe Price Blue Chip Growth ETF (ARCA:TCHP) institutionel ejerskabsstruktur viser aktuelle positioner i virksomheden efter institutioner og fonde, samt seneste ændringer i positionsstørrelse. Større aktionærer kan omfatte individuelle investorer, investeringsforeninger, hedgefonde eller institutioner. Skema 13D angiver, at investoren besidder (eller besidder) mere end 5 % af virksomheden og har til hensigt (eller har til hensigt at) aktivt at forfølge en ændring i forretningsstrategi. Skema 13G indikerer en passiv investering på over 5%.
The share price as of September 15, 2025 is 48,45 / share. Previously, on September 16, 2024, the share price was 38,63 / share. This represents an increase of 25,42% over that period.
Fondens stemningsscore
Fund Sentiment Score (fka Ownership Accumulation Score) finder de aktier, der bliver mest købt af fonde. Det er resultatet af en sofistikeret, multi-faktor kvantitativ model, der identificerer virksomheder med de højeste niveauer af institutionel akkumulering. Scoringsmodellen bruger en kombination af den samlede stigning i oplyste ejere, ændringerne i porteføljeallokeringer i disse ejere og andre målinger. Tallet går fra 0 til 100, hvor højere tal indikerer et højere niveau af akkumulering for sine jævnaldrende, og 50 er gennemsnittet.
Opdateringsfrekvens: Dagligt
Se Ownership Explorer, som giver en liste over højest rangerende virksomheder.
Institutionel Put/Call-forhold
Ud over at indberette standardaktie- og gældsudstedelser skal institutter med mere end 100 mill. aktiver under forvaltning også oplyse deres put- og call-optionsbeholdninger. Da salgsoptioner generelt indikerer negativ stemning, og købsoptioner indikerer positiv stemning, kan vi få en fornemmelse af den overordnede institutionelle stemning ved at plotte forholdet mellem put og kald. Diagrammet til højre viser det historiske put/call-forhold for dette instrument.
Brug af Put/Call Ratio som en indikator for investorernes stemning overvinder en af de vigtigste mangler ved at bruge totalt institutionelt ejerskab, som er, at en betydelig mængde af aktiver under forvaltning investeres passivt for at spore indekser. Passivt forvaltede fonde køber typisk ikke optioner, så indikatoren for put/call-forholdet følger mere nøje følelsen af aktivt forvaltede fonde.
13F og NPORT arkivering
Detaljer om 13F-arkivering er gratis. Detaljer om NP-ansøgninger kræver et premium-medlemskab. Grønne rækker angiver nye positioner. Røde rækker angiver lukkede positioner. Klik på linket ikon for at se den fulde transaktionshistorik.
Opgrader
for at låse premium-data op og eksportere til Excel ![]() .
.
| Fil dato | Kilde | Investor | Type | Gennemsnitlig pris (Øst) |
Aktier | Δ Aktier (%) |
Rapporteret Værdi ($1000) |
Δ Værdi (%) |
Port Alloc (%) |
|
|---|---|---|---|---|---|---|---|---|---|---|
| 2025-08-13 | 13F | Jones Financial Companies Lllp | 689.919 | 38,09 | 31.074 | 63,33 | ||||
| 2025-08-11 | 13F | Landaas & Co /wi /adv | 17.617 | 60,64 | 799 | 91,15 | ||||
| 2025-07-28 | 13F | Mitchell Mcleod Pugh & Williams Inc | 20.362 | 3,00 | 923 | 22,58 | ||||
| 2025-07-29 | 13F | Stratos Wealth Advisors, LLC | 17.994 | -27,28 | 816 | -13,38 | ||||
| 2025-08-14 | 13F | Destination Wealth Management | 0 | -100,00 | 0 | |||||
| 2025-08-14 | 13F | Wells Fargo & Company/mn | 1.849 | 84 | ||||||
| 2025-05-09 | 13F | GeoWealth Management, LLC | 0 | -100,00 | 0 | -100,00 | ||||
| 2025-08-08 | 13F | Cetera Investment Advisers | 3.282.913 | 108,91 | 148.880 | 148,73 | ||||
| 2025-08-14 | 13F | Fmr Llc | 1.100 | 50 | ||||||
| 2025-08-13 | 13F | Legacy Capital Wealth Partners, LLC | 25.661 | 9,60 | 1.164 | 30,53 | ||||
| 2025-08-14 | 13F | Glenview Trust Co | 1.759.213 | 4,68 | 79.780 | 24,64 | ||||
| 2025-08-14 | 13F | GWM Advisors LLC | 34.013 | -32,44 | 1.542 | -19,56 | ||||
| 2025-07-08 | 13F | Goldstone Financial Group, LLC | 13.736 | -0,95 | 627 | 18,56 | ||||
| 2025-07-29 | 13F | Elevation Capital Advisory, LLC | 288.685 | 254,21 | 13.092 | 321,75 | ||||
| 2025-07-17 | 13F | Janney Montgomery Scott LLC | 286.763 | 18,24 | 13 | 44,44 | ||||
| 2025-05-12 | 13F | Jpmorgan Chase & Co | 0 | -100,00 | 0 | |||||
| 2025-08-07 | 13F | Traynor Capital Management, Inc. | 0 | -100,00 | 0 | |||||
| 2025-08-14 | 13F | Raymond James Financial Inc | 353.837 | -1,54 | 16.047 | 17,23 | ||||
| 2025-08-11 | 13F | Private Advisor Group, LLC | 11.209 | -11,91 | 508 | 4,96 | ||||
| 2025-08-12 | 13F | MAI Capital Management | 13.986 | 41,20 | 634 | 68,17 | ||||
| 2025-05-15 | 13F | National Wealth Management Group, LLC | 226.539 | 5,77 | 8.629 | -4,34 | ||||
| 2025-04-25 | 13F | BankPlus Wealth Management LLC | 0 | -100,00 | 0 | |||||
| 2025-07-15 | 13F | Verum Partners LLC | 7.399 | 0,00 | 336 | 19,22 | ||||
| 2025-08-26 | NP | PRSGX - Spectrum Growth Fund This fund is a listed as child fund of Price T Rowe Associates Inc /md/ and if that institution has disclosed ownership in this security, then these positions will not be double counted when calculating total shares and total value | 1.250.001 | 0,00 | 56.688 | 19,06 | ||||
| 2025-07-23 | 13F | Citizens National Bank Trust Department | 12.536 | -5,46 | 569 | 12,48 | ||||
| 2025-08-06 | 13F | Souders Financial Advisors | 302.768 | 6,14 | 13.731 | 26,37 | ||||
| 2025-08-08 | 13F | Maple Capital Management, Inc. | 40.895 | 3,37 | 1.855 | 23,11 | ||||
| 2025-08-12 | 13F | Heritage Trust Co | 49.454 | 33,74 | 2.243 | 59,23 | ||||
| 2025-07-25 | 13F | Cwm, Llc | 93.359 | 25,12 | 4 | 100,00 | ||||
| 2025-08-11 | 13F | John & Kathleen Schreiber Foundation | 111.349 | 0,00 | 5.050 | 19,05 | ||||
| 2025-08-12 | 13F | Bedel Financial Consulting, Inc. | 31.295 | 3,43 | 1.419 | 18,74 | ||||
| 2025-07-02 | 13F | Central Pacific Bank - Trust Division | 168 | 0,00 | 8 | 16,67 | ||||
| 2025-07-10 | 13F | Wealth Enhancement Advisory Services, Llc | 61.952 | 1,47 | 2.826 | 21,55 | ||||
| 2025-07-21 | 13F | DHJJ Financial Advisors, Ltd. | 85 | 0,00 | 4 | 0,00 | ||||
| 2025-07-25 | 13F | Cascade Investment Advisors, Inc. | 6.193 | 7,33 | 281 | 27,85 | ||||
| 2025-08-04 | 13F | NBZ Investment Advisors LLC | 60.764 | 6,94 | 2.756 | 27,31 | ||||
| 2025-08-07 | 13F | Kestra Private Wealth Services, Llc | 7.476 | 1,41 | 339 | 21,07 | ||||
| 2025-07-23 | 13F | Armstrong, Fleming & Moore, Inc | 437.876 | 19.858 | ||||||
| 2025-08-08 | 13F | Capital Investment Advisory Services, LLC | 1.288 | 77,66 | 58 | 114,81 | ||||
| 2025-07-29 | 13F | Fundamentun, Llc | 0 | -100,00 | 0 | |||||
| 2025-08-07 | 13F/A | Ellerson Group Inc /adv | 22.632 | 2,49 | 1.026 | 22,00 | ||||
| 2025-07-31 | 13F | Glass Jacobson Investment Advisors llc | 1.222 | 0,00 | 55 | 7,84 | ||||
| 2025-08-01 | 13F | Equita Financial Network, Inc. | 6.093 | -10,67 | 276 | 6,56 | ||||
| 2025-07-30 | 13F | Atlantic Edge Private Wealth Management, LLC | 652 | 0,00 | 30 | 20,83 | ||||
| 2025-08-19 | 13F | Cape Investment Advisory, Inc. | 248 | 0,00 | 11 | 22,22 | ||||
| 2025-07-11 | 13F | Pinnacle Bancorp, Inc. | 56 | 0,00 | 3 | 0,00 | ||||
| 2025-08-05 | 13F | Sigma Planning Corp | 18.167 | -69,04 | 824 | -63,16 | ||||
| 2025-07-24 | 13F | Capital Advisors, Ltd. LLC | 73.072 | -0,25 | 3 | 50,00 | ||||
| 2025-08-13 | 13F | Marshall Wace, Llp | 19.701 | 893 | ||||||
| 2025-08-18 | 13F | Hershey Financial Advisers, LLC | 9.414 | -24,49 | 427 | -18,86 | ||||
| 2025-07-24 | 13F | Bey-Douglas LLC | 6.849 | 15,85 | 311 | 37,78 | ||||
| 2025-07-25 | 13F | Apollon Wealth Management, LLC | 4.828 | 219 | ||||||
| 2025-07-16 | 13F | Swisher Financial Concepts, Inc. | 18.133 | -6,95 | 822 | 10,78 | ||||
| 2025-08-14 | 13F | Great Valley Advisor Group, Inc. | 6.356 | -19,65 | 288 | -4,32 | ||||
| 2025-08-14 | 13F | Advisor OS, LLC | 181.924 | -19,57 | 8.250 | -4,24 | ||||
| 2025-07-14 | 13F | Lighthouse Wealth Management Inc. | 28.213 | 3,58 | 1.279 | 23,34 | ||||
| 2025-07-11 | 13F | SILVER OAK SECURITIES, Inc | 35.551 | 259,36 | 1.612 | 328,72 | ||||
| 2025-08-12 | 13F | LPL Financial LLC | 40.556 | 21,00 | 1.839 | 44,12 | ||||
| 2025-08-08 | 13F | Comprehensive Financial Planning, Inc./PA | 43.421 | 1,46 | 1.969 | 20,80 | ||||
| 2025-04-30 | 13F | POM Investment Strategies, LLC | 0 | -100,00 | 0 | |||||
| 2025-08-14 | 13F | Cascades Capital Asset Management, LLC | 5.573 | -18,58 | 253 | -3,08 | ||||
| 2025-05-15 | 13F | Gotham Asset Management, LLC | 0 | -100,00 | 0 | -100,00 | ||||
| 2025-08-13 | 13F | Ted Buchan & Co | 30.439 | -2,94 | 1.380 | 15,58 | ||||
| 2025-07-30 | 13F | Cornerstone Advisory, LLC | 5.264 | 239 | ||||||
| 2025-08-06 | 13F | Prospera Financial Services Inc | 7.152 | -89,55 | 324 | -87,56 | ||||
| 2025-09-04 | 13F/A | Advisor Group Holdings, Inc. | 23.418 | -51,70 | 1.062 | -42,52 | ||||
| 2025-07-14 | 13F | Harbor Group, Inc. | 442.912 | 10,17 | 20.086 | 31,17 | ||||
| 2025-08-13 | 13F | Capital Analysts, Inc. | 55.996 | 2,04 | 3 | 0,00 | ||||
| 2025-08-14 | 13F | Royal Bank Of Canada | 56.211 | -13,89 | 2.549 | 2,49 | ||||
| 2025-07-28 | 13F | Harbour Investments, Inc. | 35.177 | 1,36 | 1.595 | 20,74 | ||||
| 2025-08-14 | 13F | First Foundation Advisors | 86.476 | -0,19 | 3.922 | 18,82 | ||||
| 2025-08-18 | 13F/A | National Bank Of Canada /fi/ | 2.155 | 13,12 | 97 | 35,21 | ||||
| 2025-04-25 | 13F | MidAtlantic Capital Management, Inc. | 0 | -100,00 | 0 | |||||
| 2025-08-18 | 13F | Geneos Wealth Management Inc. | 898 | 29,39 | 41 | 53,85 | ||||
| 2025-08-04 | 13F | REDW Wealth LLC | 10.084 | 7,31 | 457 | 28,01 | ||||
| 2025-05-06 | 13F | PFG Advisors | 0 | -100,00 | 0 | -100,00 | ||||
| 2025-08-06 | 13F | Mark Sheptoff Financial Planning, Llc | 200 | 0,00 | 9 | 28,57 | ||||
| 2025-08-14 | 13F | Comerica Bank | 1.000 | 0,00 | 45 | 18,42 | ||||
| 2025-07-09 | 13F | Sapient Capital Llc | 5.723 | 0,00 | 260 | 19,35 | ||||
| 2025-07-21 | 13F | Keystone Financial Group, Inc. | 0 | -100,00 | 0 | |||||
| 2025-08-13 | 13F | Per Stirling Capital Management, LLC. | 8.133 | 0,00 | 369 | 19,09 | ||||
| 2025-08-14 | 13F | Goldman Sachs Group Inc | 7.929 | 360 | ||||||
| 2025-07-24 | 13F | IFP Advisors, Inc | 25.120 | 0,00 | 1.139 | 19,14 | ||||
| 2025-07-25 | 13F | Concord Wealth Partners | 65 | 3 | ||||||
| 2025-07-24 | 13F | Forefront Analytics, LLC | 76.981 | 3.490 | ||||||
| 2025-08-13 | 13F | Dana Investment Advisors, Inc. | 9.916 | 0,00 | 450 | 19,10 | ||||
| 2025-08-11 | 13F | TD Waterhouse Canada Inc. | 4.561 | 192,18 | 202 | 242,37 | ||||
| 2025-08-12 | 13F | Calton & Associates, Inc. | 5.198 | 236 | ||||||
| 2025-08-15 | 13F | Morgan Stanley | 602 | -46,35 | 27 | -35,71 | ||||
| 2025-08-08 | 13F | Sittner & Nelson, Llc | 23.049 | 21,84 | 1.045 | 45,14 | ||||
| 2025-08-11 | 13F | Principal Securities, Inc. | 9.598 | -64,21 | 435 | -61,47 | ||||
| 2025-08-13 | 13F | Northwestern Mutual Wealth Management Co | 1.959.197 | 28,54 | 88.850 | 53,04 | ||||
| 2025-07-23 | 13F | Roundview Capital LLC | 28.740 | 78,11 | 1.303 | 112,21 | ||||
| 2025-08-13 | 13F | M Holdings Securities, Inc. | 10.249 | 0 | ||||||
| 2025-08-08 | 13F | Avantax Advisory Services, Inc. | 4.775 | 217 | ||||||
| 2025-08-12 | 13F | CIBC Private Wealth Group, LLC | 200 | 0,00 | 9 | 50,00 | ||||
| 2025-08-14 | 13F | Empire Life Investments Inc. | 68.100 | 3.092 | ||||||
| 2025-08-14 | 13F | Two Sigma Investments, Lp | 233.900 | 73,00 | 10.607 | 106,00 | ||||
| 2025-08-14 | 13F | Diversify Wealth Management, Llc | 8.985 | 0,00 | 427 | 22,70 | ||||
| 2025-07-24 | 13F | Robertson Stephens Wealth Management, LLC | 13.232 | -86,26 | 600 | -83,64 | ||||
| 2025-08-04 | 13F | Saxony Capital Management, LLC | 5.100 | -12,07 | 231 | 5,00 | ||||
| 2025-07-21 | 13F | Ameritas Advisory Services, LLC | 23.733 | 301,91 | 1.076 | 337,40 | ||||
| 2025-08-14 | 13F | Bank Of America Corp /de/ | 1.585.204 | -5,72 | 71.889 | 12,25 | ||||
| 2025-08-01 | 13F | Envestnet Asset Management Inc | 793.857 | -1,13 | 36.001 | 17,72 | ||||
| 2025-08-13 | 13F/A | Matrix Asset Advisors Inc/ny | 64.641 | 4,05 | 2.931 | 23,88 | ||||
| 2025-07-16 | 13F | Signaturefd, Llc | 1.775 | 0,00 | 80 | 19,40 | ||||
| 2025-08-14 | 13F | Mml Investors Services, Llc | 52.264 | 46,41 | 2 | 100,00 | ||||
| 2025-08-12 | 13F | DiMeo Schneider & Associates, L.L.C. | 19.200 | 871 | ||||||
| 2025-08-13 | 13F | Maia Wealth LLC | 42.251 | 40,40 | 1.916 | 70,31 | ||||
| 2025-08-11 | 13F | Tidemark, LLC | 173 | 0,00 | 8 | 16,67 | ||||
| 2025-08-14 | 13F | Stifel Financial Corp | 95.569 | 2,79 | 4.334 | 22,39 | ||||
| 2025-07-22 | 13F | DAVENPORT & Co LLC | 15.997 | 6,90 | 725 | 27,19 | ||||
| 2025-08-06 | 13F | Commonwealth Equity Services, Llc | 737.938 | 12,00 | 33 | 32,00 | ||||
| 2025-08-14 | 13F | Susquehanna International Group, Llp | 35.518 | -42,45 | 1.611 | -31,49 | ||||
| 2025-08-29 | 13F | Centaurus Financial, Inc. | 0 | -100,00 | 0 | |||||
| 2025-07-16 | 13F | Essex Financial Services, Inc. | 36.809 | 38,93 | 1.669 | 65,41 | ||||
| 2025-07-17 | 13F | Mokosak Advisory Group, LLC | 5.384 | 0,00 | 244 | 19,02 | ||||
| 2025-07-07 | 13F | Trust Co | 1.465 | 0,00 | 66 | 20,00 | ||||
| 2025-08-14 | 13F | Wiley Bros.-aintree Capital, Llc | 18.761 | 851 | ||||||
| 2025-08-08 | 13F | Creative Planning | 73.347 | -53,27 | 3.326 | -44,36 | ||||
| 2025-07-11 | 13F | CMH Wealth Management LLC | 157.427 | -5,81 | 7.139 | 12,14 | ||||
| 2025-07-14 | 13F | Toth Financial Advisory Corp | 14 | 0,00 | 1 | |||||
| 2025-08-05 | 13F | Carolinas Wealth Consulting Llc | 0 | -100,00 | 0 | |||||
| 2025-08-07 | 13F | Allworth Financial LP | 393 | 0,00 | 18 | 13,33 | ||||
| 2025-08-12 | 13F | SRS Capital Advisors, Inc. | 605 | 65,30 | 27 | 107,69 | ||||
| 2025-07-22 | 13F | Wealthcare Advisory Partners LLC | 6.205 | 2,14 | 281 | 21,65 | ||||
| 2025-08-04 | 13F | WNY Asset Management, LLC | 14.683 | -47,86 | 666 | -37,97 | ||||
| 2025-08-08 | 13F | Croban | 76.981 | -3,88 | 3.490 | 14,43 | ||||
| 2025-07-16 | 13F | Stephenson National Bank & Trust | 4.062 | 4,07 | 184 | 24,32 | ||||
| 2025-08-14 | 13F | Benjamin Edwards Inc | 119.614 | 18,72 | 5.424 | 41,36 | ||||
| 2025-08-04 | 13F | Linscomb & Williams, Inc. | 249.386 | 0,32 | 11.310 | 19,44 | ||||
| 2025-08-13 | 13F | Certior Financial Group, Llc | 5.879 | 10,22 | 267 | 31,03 | ||||
| 2025-08-11 | 13F | Aptus Capital Advisors, LLC | 347 | 0,00 | 16 | 15,38 | ||||
| 2025-07-30 | 13F | D.a. Davidson & Co. | 212.216 | -0,74 | 9.624 | 18,18 | ||||
| 2025-08-12 | 13F | Proequities, Inc. | 0 | 0 | ||||||
| 2025-08-12 | 13F | J.w. Cole Advisors, Inc. | 6.333 | 0,00 | 287 | 19,09 | ||||
| 2025-08-12 | 13F | Global Retirement Partners, LLC | 345 | 0,00 | 16 | 7,14 | ||||
| 2025-05-15 | 13F | Citadel Advisors Llc | 0 | -100,00 | 0 | |||||
| 2025-08-11 | 13F | HighTower Advisors, LLC | 10.637 | -0,34 | 482 | 18,72 | ||||
| 2025-08-14 | 13F | Price T Rowe Associates Inc /md/ | 1.250.001 | 0,00 | 57 | 19,15 | ||||
| 2025-08-13 | 13F | Russell Investments Group, Ltd. | 272 | -84,47 | 12 | -81,82 | ||||
| 2025-07-16 | 13F | Spirepoint Private Client, Llc | 0 | -100,00 | 0 | |||||
| 2025-07-18 | 13F | Truist Financial Corp | 80.580 | -0,55 | 3.654 | 18,41 | ||||
| 2025-08-15 | 13F | Kestra Advisory Services, LLC | 42.760 | 23,12 | 1.939 | 46,67 | ||||
| 2025-08-08 | 13F | Mjp Associates Inc /adv | 184.102 | -18,61 | 8.349 | -3,09 | ||||
| 2025-08-07 | 13F | Summit Asset Management, LLC | 56.047 | -3,61 | 2.542 | 14,77 | ||||
| 2025-07-09 | 13F | Massmutual Trust Co Fsb/adv | 65 | 0,00 | 3 | 0,00 | ||||
| 2025-08-11 | 13F | Hopwood Financial Services, Inc. | 99.249 | 4,50 | 4.501 | 24,41 | ||||
| 2025-07-31 | 13F | Cambridge Investment Research Advisors, Inc. | 99.201 | 2,97 | 4 | 33,33 | ||||
| 2025-07-21 | 13F | Trust Co of Kansas | 935.625 | 12,25 | 42 | 35,48 |