Grundlæggende statistik
| Institutionelle ejere | 104 total, 104 long only, 0 short only, 0 long/short - change of 5,00% MRQ |
| Gennemsnitlig porteføljeallokering | 0.2053 % - change of 21,82% MRQ |
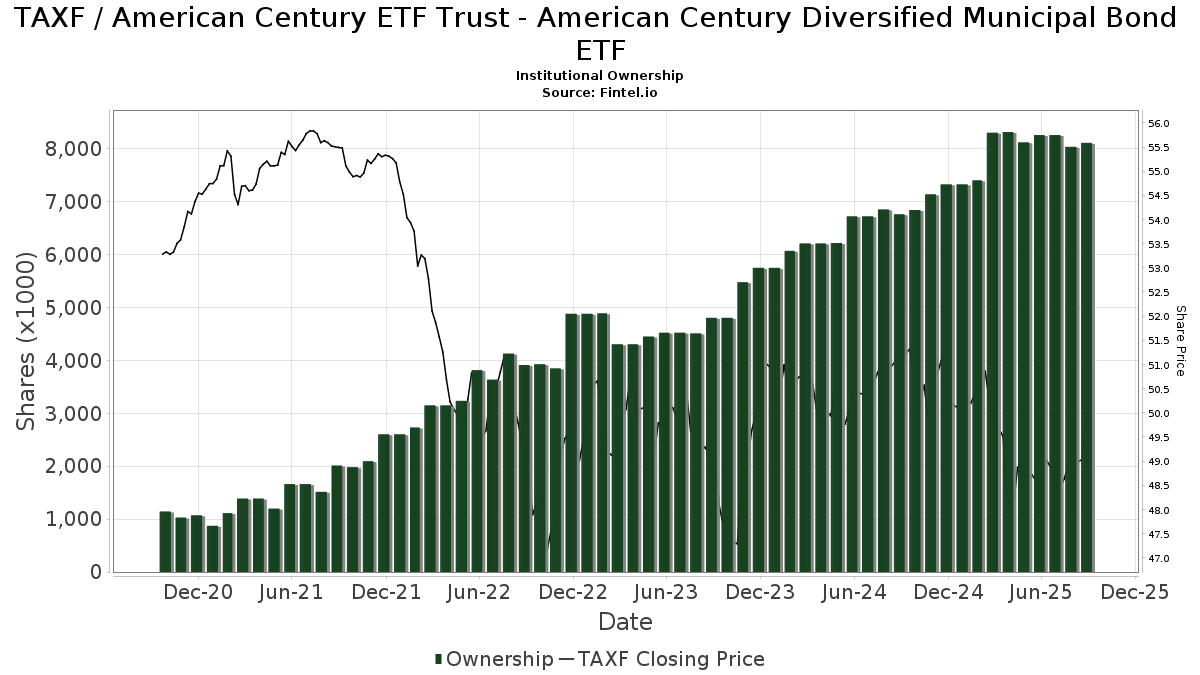
| Institutionelle aktier (lange) | 8.748.276 (ex 13D/G) - change of 0,79MM shares 9,89% MRQ |
| Institutionel værdi (lang) | $ 341.250 USD ($1000) |
Institutionelt ejerskab og aktionærer
American Century ETF Trust - American Century Diversified Municipal Bond ETF (US:TAXF) har 104 institutionelle ejere og aktionærer, der har indsendt 13D/G- eller 13F-formularer til Securities Exchange Commission (SEC). Disse institutioner har i alt 8,748,276 aktier. Største aktionærer omfatter Envestnet Asset Management Inc, Cwm, Llc, LPL Financial LLC, Morgan Stanley, Goldstein Advisors, LLC, CX Institutional, Raymond James Financial Inc, Private Advisor Group, LLC, Condor Capital Management, and Ameriprise Financial Inc .
American Century ETF Trust - American Century Diversified Municipal Bond ETF (ARCA:TAXF) institutionel ejerskabsstruktur viser aktuelle positioner i virksomheden efter institutioner og fonde, samt seneste ændringer i positionsstørrelse. Større aktionærer kan omfatte individuelle investorer, investeringsforeninger, hedgefonde eller institutioner. Skema 13D angiver, at investoren besidder (eller besidder) mere end 5 % af virksomheden og har til hensigt (eller har til hensigt at) aktivt at forfølge en ændring i forretningsstrategi. Skema 13G indikerer en passiv investering på over 5%.
The share price as of May 1, 2026 is 50,46 / share. Previously, on May 2, 2025, the share price was 48,65 / share. This represents an increase of 3,71% over that period.
Fondens stemningsscore
Fund Sentiment Score (fka Ownership Accumulation Score) finder de aktier, der bliver mest købt af fonde. Det er resultatet af en sofistikeret, multi-faktor kvantitativ model, der identificerer virksomheder med de højeste niveauer af institutionel akkumulering. Scoringsmodellen bruger en kombination af den samlede stigning i oplyste ejere, ændringerne i porteføljeallokeringer i disse ejere og andre målinger. Tallet går fra 0 til 100, hvor højere tal indikerer et højere niveau af akkumulering for sine jævnaldrende, og 50 er gennemsnittet.
Opdateringsfrekvens: Dagligt
Se Ownership Explorer, som giver en liste over højest rangerende virksomheder.
AI+ Ask Fintel’s AI assistant about American Century ETF Trust - American Century Diversified Municipal Bond ETF.
Select a question to share a public post with an AI-crafted answer.
Thinking of good questions…
Institutionel Put/Call-forhold
Ud over at indberette standardaktie- og gældsudstedelser skal institutter med mere end 100 mill. aktiver under forvaltning også oplyse deres put- og call-optionsbeholdninger. Da salgsoptioner generelt indikerer negativ stemning, og købsoptioner indikerer positiv stemning, kan vi få en fornemmelse af den overordnede institutionelle stemning ved at plotte forholdet mellem put og kald. Diagrammet til højre viser det historiske put/call-forhold for dette instrument.
Brug af Put/Call Ratio som en indikator for investorernes stemning overvinder en af de vigtigste mangler ved at bruge totalt institutionelt ejerskab, som er, at en betydelig mængde af aktiver under forvaltning investeres passivt for at spore indekser. Passivt forvaltede fonde køber typisk ikke optioner, så indikatoren for put/call-forholdet følger mere nøje følelsen af aktivt forvaltede fonde.
13F og NPORT arkivering
Detaljer om 13F-arkivering er gratis. Detaljer om NP-ansøgninger kræver et premium-medlemskab. Grønne rækker angiver nye positioner. Røde rækker angiver lukkede positioner. Klik på linket ikon for at se den fulde transaktionshistorik.
Opgrader
for at låse premium-data op og eksportere til Excel ![]() .
.
| Fil dato | Kilde | Investor | Type | Gennemsnitlig pris (Øst) |
Aktier | Δ Aktier (%) |
Rapporteret Værdi ($1000) |
Δ Værdi (%) |
Port Alloc (%) |
|
|---|---|---|---|---|---|---|---|---|---|---|
| 2026-05-01 | 13F/A | Lodestone Wealth Management LLC | 9.197 | -1,99 | 460 | -2,54 | ||||
| 2026-02-13 | 13F | Mml Investors Services, Llc | 10.206 | 1,94 | 514 | 2,39 | ||||
| 2026-02-17 | 13F | Equitable Holdings, Inc. | 20.235 | 76,72 | 1.019 | 77,22 | ||||
| 2026-02-03 | 13F | Crossmark Global Holdings, Inc. | 0 | -100,00 | 0 | |||||
| 2026-04-07 | 13F | Signaturefd, Llc | 12 | 0,00 | 1 | |||||
| 2026-05-01 | 13F | Legacy Financial Strategies, LLC | 7.086 | 0,00 | 355 | -0,56 | ||||
| 2026-01-29 | 13F | UBS Group AG | 52 | 3 | ||||||
| 2026-02-10 | 13F | Frederick Financial Consultants, LLC | 9.976 | -11,40 | 503 | -11,15 | ||||
| 2026-02-17 | 13F | Cetera Investment Advisers | 10.484 | 0,22 | 528 | 0,57 | ||||
| 2026-02-13 | 13F | Lifeworks Advisors, LLC | 8.059 | 0,00 | 406 | 0,50 | ||||
| 2026-04-21 | 13F | Unique Wealth, Llc | 5.886 | 295 | ||||||
| 2026-01-26 | 13F | Cwm, Llc | 1.389.743 | 3,83 | 70 | 4,48 | ||||
| 2026-01-21 | 13F | Prime Capital Investment Advisors, LLC | 32.090 | -6,76 | 1.617 | -6,48 | ||||
| 2026-04-08 | 13F | Dynamic Advisor Solutions LLC | 124.663 | -1,89 | 6.239 | -2,53 | ||||
| 2026-02-13 | 13F | Resources Investment Advisors, LLC. | 55.263 | -8,34 | 2.784 | -8,06 | ||||
| 2025-11-14 | 13F | Strategic Wealth Partners, Ltd. | 12.493 | 628 | ||||||
| 2026-04-07 | 13F | Farther Finance Advisors, LLC | 2.831 | -3,51 | 142 | -3,40 | ||||
| 2026-02-12 | 13F | Commonwealth Equity Services, Llc | 100.529 | 3,01 | 5.065 | 126.500,00 | ||||
| 2026-02-13 | 13F | Pine Valley Investments Ltd Liability Co | 34.102 | -2,72 | 1.718 | -2,39 | ||||
| 2026-02-17 | 13F | Advisor Group Holdings, Inc. | 34.898 | 16,52 | 1.758 | 18,62 | ||||
| 2026-02-12 | 13F | BlackRock, Inc. | 1 | 0,00 | 0 | |||||
| 2026-02-06 | 13F | Larson Financial Group LLC | 1 | 0,00 | 0 | |||||
| 2026-02-17 | 13F | Raymond James Financial Inc | 214.163 | 23,32 | 10.790 | 23,70 | ||||
| 2026-04-10 | 13F | Pure Financial Advisors, Inc. | 4.100 | 0,00 | 205 | -0,49 | ||||
| 2026-02-17 | 13F | Advisory Services Network, LLC | 0 | -100,00 | 0 | |||||
| 2026-04-22 | 13F | Investment Advisory Group, LLC | 4.500 | 0,00 | 225 | -0,44 | ||||
| 2026-04-15 | 13F | marrick wealth, LLC | 13.188 | 7,37 | 660 | 6,80 | ||||
| 2026-02-17 | 13F | Pinnacle Financial Partners, Inc. | 8.037 | 405 | ||||||
| 2026-04-22 | 13F | Janney Montgomery Scott LLC | 6.140 | 0,00 | 0 | |||||
| 2026-05-01 | 13F | Fifth Third Bancorp | 16.433 | 822 | ||||||
| 2026-02-06 | 13F | Midwestern Financial, LLC /IA | 25.203 | 0,51 | 1.270 | 0,79 | ||||
| 2026-02-17 | 13F | Prosperity Consulting Group, LLC | 14.517 | 0,00 | 731 | 0,27 | ||||
| 2026-04-17 | 13F | Stewardship Advisors, LLC | 8.024 | 0,00 | 402 | -0,74 | ||||
| 2025-11-07 | 13F | Synovus Financial Corp | 9.670 | 0,18 | 486 | 2,75 | ||||
| 2026-04-21 | 13F | OneAscent Financial Services LLC | 38.913 | 6,13 | 1.948 | 5,41 | ||||
| 2026-02-11 | 13F | LPL Financial LLC | 649.182 | 4,66 | 32.706 | 4,97 | ||||
| 2026-02-11 | 13F | Arrowroot Family Office, LLC | 6.200 | 12,73 | 312 | 13,04 | ||||
| 2026-01-29 | 13F | Aprio Wealth Management, LLC | 18.234 | 919 | ||||||
| 2026-04-27 | 13F | Altus Wealth Group LLC | 10.247 | 5,51 | 513 | 4,70 | ||||
| 2026-01-23 | 13F | Assetmark, Inc | 975 | 11,94 | 49 | 13,95 | ||||
| 2026-02-11 | 13F | Capital Analysts, Inc. | 0 | -100,00 | 0 | |||||
| 2026-02-17 | 13F | Ameriprise Financial Inc | 147.814 | 166,76 | 7.447 | 168,03 | ||||
| 2026-01-20 | 13F | Savvy Advisors, Inc. | 19.743 | 23,52 | 995 | 23,94 | ||||
| 2026-01-23 | 13F | Westside Investment Management, Inc. | 16.800 | 2,44 | 846 | 2,79 | ||||
| 2026-02-10 | 13F | Henderson Brothers Financial Partners, LLC | 85.214 | 4.293 | ||||||
| 2026-04-30 | 13F | Kestra Advisory Services, LLC | 92.776 | -22,85 | 4.643 | -23,36 | ||||
| 2026-04-24 | 13F | ERn Financial, LLC | 16.768 | 5,46 | 839 | 4,74 | ||||
| 2026-04-07 | 13F | U.S. Capital Wealth Advisors, LLC | 114.131 | 5,12 | 5.712 | 4,44 | ||||
| 2026-02-10 | 13F | Foundations Investment Advisors, LLC | 18.835 | 75,98 | 949 | 76,54 | ||||
| 2026-02-18 | 13F | GWM Advisors LLC | 55.178 | 7,76 | 2.780 | 8,09 | ||||
| 2026-04-30 | 13F | Cambridge Investment Research Advisors, Inc. | 71.064 | 0,88 | 4 | 0,00 | ||||
| 2026-02-11 | 13F | Gwn Securities Inc. | 43.201 | 24,01 | 2.176 | 24,41 | ||||
| 2026-04-22 | 13F | Caldwell Trust Co | 770 | 0,00 | 39 | 0,00 | ||||
| 2026-02-19 | 13F | Atomi Financial Group, Inc. | 4.133 | -17,59 | 208 | -17,13 | ||||
| 2026-02-13 | 13F | C M Bidwell & Associates Ltd | 5.315 | 2,15 | 268 | 2,30 | ||||
| 2026-02-13 | 13F | Mariner, LLC | 41.204 | 27,67 | 2.076 | 28,01 | ||||
| 2026-02-18 | 13F | Financial Advisory Service, Inc. | 88.133 | 20,87 | 4.440 | 21,25 | ||||
| 2025-11-14 | 13F | Old Mission Capital Llc | 0 | -100,00 | 0 | |||||
| 2026-02-04 | 13F | Shade Tree Advisors LLC | 4.238 | 214 | ||||||
| 2026-02-13 | 13F | Flow Traders U.s. Llc | 91.444 | 449,35 | 5 | |||||
| 2025-11-10 | 13F | Sigma Planning Corp | 0 | -100,00 | 0 | |||||
| 2026-04-29 | 13F | Landmark Wealth Management, LLC | 51.941 | 23,11 | 2.600 | 22,31 | ||||
| 2026-02-13 | 13F | Stifel Financial Corp | 5.802 | -4,29 | 292 | -3,95 | ||||
| 2026-02-13 | 13F | Morgan Stanley | 422.323 | 16,70 | 21.277 | 17,04 | ||||
| 2026-02-17 | 13F | Northern Trust Corp | 0 | -100,00 | 0 | |||||
| 2026-04-13 | 13F | Mather Group, Llc. | 50.101 | 1,86 | 2.508 | 1,21 | ||||
| 2026-02-17 | 13F | IHT Wealth Management, LLC | 63.114 | -1,40 | 3.180 | -1,12 | ||||
| 2026-02-17 | 13F | Royal Bank Of Canada | 37.027 | 22,41 | 1.865 | 22,78 | ||||
| 2026-02-05 | 13F | Atria Investments Llc | 5.285 | 0,00 | 266 | 0,38 | ||||
| 2026-02-17 | 13F | Susquehanna International Group, Llp | 4.410 | 222 | ||||||
| 2026-02-06 | 13F | Global Retirement Partners, LLC | 423 | 0,00 | 21 | 0,00 | ||||
| 2025-11-13 | 13F | Certified Advisory Corp | 0 | -100,00 | 0 | -100,00 | ||||
| 2026-04-30 | 13F | Private Trust Co Na | 5.498 | -8,27 | 275 | -8,64 | ||||
| 2026-02-11 | 13F | CNB Bank | 18.932 | 6,79 | 954 | 7,08 | ||||
| 2026-04-10 | 13F | GEM Asset Management, LLC | 72.033 | 6,32 | 3.605 | 5,01 | ||||
| 2026-02-13 | 13F | McAdam, LLC | 4.028 | -2,68 | 203 | -2,42 | ||||
| 2026-04-27 | 13F | PFG Investments, LLC | 4.157 | 0,70 | 208 | 0,48 | ||||
| 2026-02-06 | 13F | Fortis Group Advisors, LLC | 0 | -100,00 | 0 | |||||
| 2026-04-15 | 13F | Merit Financial Group, LLC | 8.971 | -5,69 | 449 | -6,26 | ||||
| 2026-01-27 | 13F | PFG Advisors | 23.763 | 2,89 | 1.197 | 3,19 | ||||
| 2026-02-06 | 13F | Condor Capital Management | 168.085 | 1,00 | 8.468 | 1,30 | ||||
| 2026-02-24 | 13F | Barnes Wealth Management Group, Inc | 4.383 | 5,61 | 221 | 5,77 | ||||
| 2026-02-09 | 13F | Regimen Wealth, Llc | 12.645 | 1,26 | 637 | 1,59 | ||||
| 2026-02-13 | 13F | Integrated Wealth Concepts LLC | 0 | -100,00 | 0 | |||||
| 2026-04-08 | 13F | Melone Private Wealth, LLC | 24.494 | 50,27 | 1.226 | 49,21 | ||||
| 2026-02-06 | 13F | HighTower Advisors, LLC | 53.802 | 4,98 | 2.711 | 5,28 | ||||
| 2026-01-28 | 13F | Geneos Wealth Management Inc. | 1.450 | 0,00 | 73 | 1,39 | ||||
| 2026-02-10 | 13F | Palatine Hill Wealth Management, LLC | 9.354 | 471 | ||||||
| 2026-02-17 | 13F | Jones Financial Companies Lllp | 6.898 | 120,45 | 348 | 122,44 | ||||
| 2026-02-12 | 13F | Gerber Kawasaki Wealth & Investment Management | 14.040 | -4,14 | 707 | -3,81 | ||||
| 2026-01-26 | 13F | Equity Wealth Partners, LLC | 16.875 | 6,41 | 850 | 6,78 | ||||
| 2026-02-13 | 13F | Wells Fargo & Company/mn | 0 | -100,00 | 0 | -100,00 | ||||
| 2026-02-12 | 13F | Jane Street Group, Llc | 14.157 | -55,34 | 713 | -55,21 | ||||
| 2026-02-17 | 13F | SageView Advisory Group, LLC | 13.326 | -12,51 | 671 | -12,29 | ||||
| 2026-04-08 | 13F | Bill Few Associates, Inc. | 5.040 | 252 | ||||||
| 2026-02-12 | 13F | Brinker Capital Investments, LLC | 13.436 | -45,81 | 677 | -45,70 | ||||
| 2026-04-10 | 13F | Finward Bancorp | 5.379 | 0,00 | 269 | -0,74 | ||||
| 2026-04-06 | 13F | CX Institutional | 407.485 | 1,78 | 20 | 0,00 | ||||
| 2026-02-06 | 13F | Pnc Financial Services Group, Inc. | 21.943 | 15,88 | 1.105 | 16,19 | ||||
| 2026-01-29 | 13F | Comerica Bank | 17.328 | -4,42 | 873 | -4,18 | ||||
| 2026-02-11 | 13F | Jpmorgan Chase & Co | 30.348 | 556,74 | 1.529 | 558,62 | ||||
| 2026-02-17 | 13F | Captrust Financial Advisors | 11.240 | -14,15 | 566 | -13,85 | ||||
| 2026-02-10 | 13F | Envestnet Asset Management Inc | 2.194.673 | 2,80 | 110.568 | 3,11 | ||||
| 2025-11-25 | 13F | Arq Wealth Advisors, Llc | 0 | -100,00 | 0 | |||||
| 2026-02-03 | 13F | Financial Partners Group, Inc | 0 | -100,00 | 0 | |||||
| 2025-11-13 | 13F | O'shaughnessy Asset Management, Llc | 0 | -100,00 | 0 | |||||
| 2025-11-20 | 13F | First Affirmative Financial Network | 19.392 | 39,47 | 974 | 43,24 | ||||
| 2026-04-28 | 13F | Goldstein Advisors, LLC | 420.940 | 2,14 | 21.068 | 1,47 | ||||
| 2026-04-24 | 13F | Private Advisor Group, LLC | 192.683 | -1,62 | 9.644 | -2,26 | ||||
| 2026-02-13 | 13F | Visionary Wealth Advisors | 69.798 | -0,74 | 3.516 | -0,45 | ||||
| 2026-02-02 | 13F | Mutual Advisors, LLC | 34.739 | 0,36 | 1.750 | -0,17 | ||||
| 2026-04-08 | 13F | First Heartland Consultants, Inc. | 50.920 | 2.549 | ||||||
| 2026-04-13 | 13F | IFP Advisors, Inc | 138.718 | 9,76 | 6.943 | 9,03 | ||||
| 2026-02-17 | 13F | Mercer Global Advisors Inc /adv | 63.532 | 1,87 | 3.201 | 2,17 | ||||
| 2026-01-26 | 13F | Pursuit Wealth Management LLC | 81.546 | 4.108 | ||||||
| 2026-02-17 | 13F | Core Wealth Advisors, Inc. | 18.626 | 0,00 | 938 | 0,32 | ||||
| 2026-02-09 | 13F | Harbour Investments, Inc. | 899 | 0,00 | 45 | 0,00 |