Grundlæggende statistik
| Institutionelle ejere | 125 total, 125 long only, 0 short only, 0 long/short - change of 4,17% MRQ |
| Gennemsnitlig porteføljeallokering | 0.1111 % - change of -35,16% MRQ |
| Institutionelle aktier (lange) | 5.423.197 (ex 13D/G) - change of 0,06MM shares 1,17% MRQ |
| Institutionel værdi (lang) | $ 284.675 USD ($1000) |
Institutionelt ejerskab og aktionærer
PIMCO ETF Trust - PIMCO 1-5 Year U.S. TIPS Index Exchange-Traded Fund (US:STPZ) har 125 institutionelle ejere og aktionærer, der har indsendt 13D/G- eller 13F-formularer til Securities Exchange Commission (SEC). Disse institutioner har i alt 5,423,197 aktier. Største aktionærer omfatter Bank Of America Corp /de/, Morgan Stanley, Ameritas Advisory Services, LLC, Eagle Strategies LLC, Bank Of Nova Scotia, Bleakley Financial Group, LLC, Wells Fargo & Company/mn, Tiaa Trust, National Association, LPL Financial LLC, and Goldman Sachs Group Inc .
PIMCO ETF Trust - PIMCO 1-5 Year U.S. TIPS Index Exchange-Traded Fund (ARCA:STPZ) institutionel ejerskabsstruktur viser aktuelle positioner i virksomheden efter institutioner og fonde, samt seneste ændringer i positionsstørrelse. Større aktionærer kan omfatte individuelle investorer, investeringsforeninger, hedgefonde eller institutioner. Skema 13D angiver, at investoren besidder (eller besidder) mere end 5 % af virksomheden og har til hensigt (eller har til hensigt at) aktivt at forfølge en ændring i forretningsstrategi. Skema 13G indikerer en passiv investering på over 5%.
The share price as of April 30, 2026 is 54,54 / share. Previously, on May 2, 2025, the share price was 53,58 / share. This represents an increase of 1,79% over that period.

Fondens stemningsscore
Fund Sentiment Score (fka Ownership Accumulation Score) finder de aktier, der bliver mest købt af fonde. Det er resultatet af en sofistikeret, multi-faktor kvantitativ model, der identificerer virksomheder med de højeste niveauer af institutionel akkumulering. Scoringsmodellen bruger en kombination af den samlede stigning i oplyste ejere, ændringerne i porteføljeallokeringer i disse ejere og andre målinger. Tallet går fra 0 til 100, hvor højere tal indikerer et højere niveau af akkumulering for sine jævnaldrende, og 50 er gennemsnittet.
Opdateringsfrekvens: Dagligt
Se Ownership Explorer, som giver en liste over højest rangerende virksomheder.
AI+ Ask Fintel’s AI assistant about PIMCO ETF Trust - PIMCO 1-5 Year U.S. TIPS Index Exchange-Traded Fund.
Select a question to share a public post with an AI-crafted answer.
Thinking of good questions…
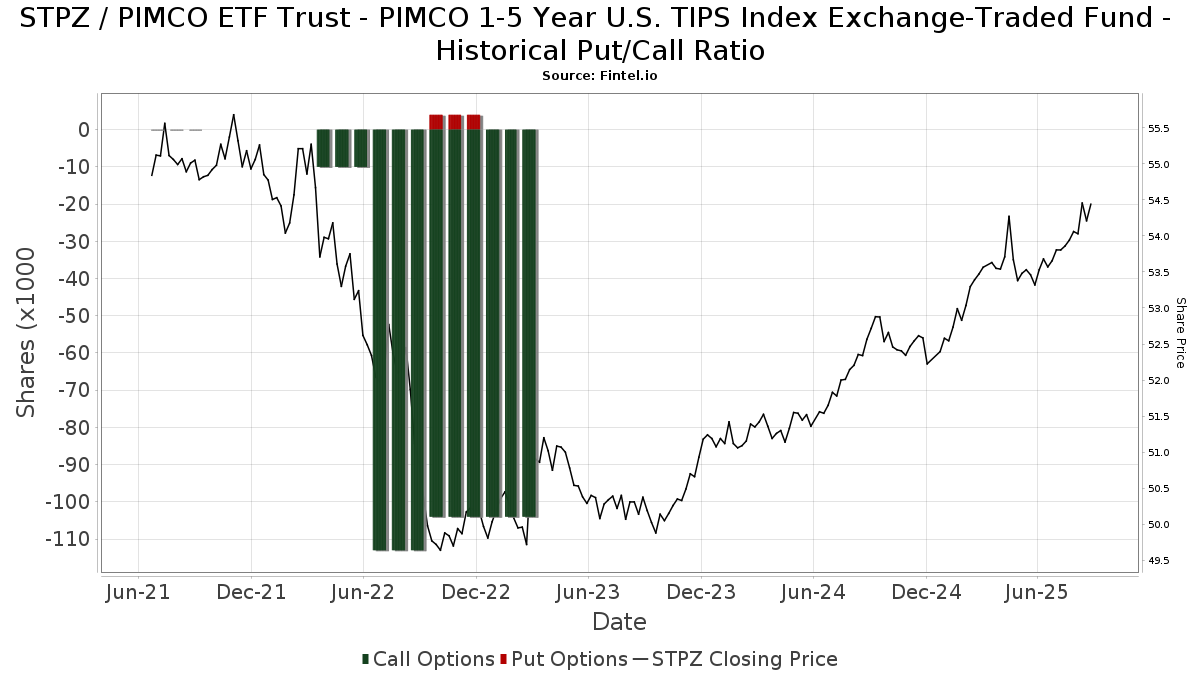
Institutionel Put/Call-forhold
Ud over at indberette standardaktie- og gældsudstedelser skal institutter med mere end 100 mill. aktiver under forvaltning også oplyse deres put- og call-optionsbeholdninger. Da salgsoptioner generelt indikerer negativ stemning, og købsoptioner indikerer positiv stemning, kan vi få en fornemmelse af den overordnede institutionelle stemning ved at plotte forholdet mellem put og kald. Diagrammet til højre viser det historiske put/call-forhold for dette instrument.
Brug af Put/Call Ratio som en indikator for investorernes stemning overvinder en af de vigtigste mangler ved at bruge totalt institutionelt ejerskab, som er, at en betydelig mængde af aktiver under forvaltning investeres passivt for at spore indekser. Passivt forvaltede fonde køber typisk ikke optioner, så indikatoren for put/call-forholdet følger mere nøje følelsen af aktivt forvaltede fonde.
13F og NPORT arkivering
Detaljer om 13F-arkivering er gratis. Detaljer om NP-ansøgninger kræver et premium-medlemskab. Grønne rækker angiver nye positioner. Røde rækker angiver lukkede positioner. Klik på linket ikon for at se den fulde transaktionshistorik.
Opgrader
for at låse premium-data op og eksportere til Excel ![]() .
.
| Fil dato | Kilde | Investor | Type | Gennemsnitlig pris (Øst) |
Aktier | Δ Aktier (%) |
Rapporteret Værdi ($1000) |
Δ Værdi (%) |
Port Alloc (%) |
|
|---|---|---|---|---|---|---|---|---|---|---|
| 2026-01-08 | 13F | Signet Financial Management, Llc | 4.286 | -5,30 | 230 | -6,53 | ||||
| 2026-02-09 | 13F | Hartland & Co., LLC | 288 | 14 | ||||||
| 2026-01-16 | 13F | CogentBlue Wealth Advisors, LLC | 0 | -100,00 | 0 | |||||
| 2026-01-29 | 13F | Comerica Bank | 2.513 | -0,51 | 135 | -1,47 | ||||
| 2026-02-04 | 13F | Midwest Trust Co | 4.100 | 220 | ||||||
| 2026-04-07 | 13F | Farther Finance Advisors, LLC | 32 | 0,00 | 2 | 0,00 | ||||
| 2026-02-17 | 13F | Dimension Capital Management Llc | 7.483 | 0,00 | 402 | -0,99 | ||||
| 2026-02-04 | 13F | Dogwood Wealth Management LLC | 1.097 | 0,00 | 59 | -1,69 | ||||
| 2026-02-13 | 13F | Hudson Portfolio Management LLC | 34.211 | 7,97 | 1.836 | 6,93 | ||||
| 2026-02-13 | 13F | Wells Fargo & Company/mn | 250.533 | 0,01 | 13.444 | -0,94 | ||||
| 2026-01-20 | 13F | Ascent Group, LLC | 16.477 | 884 | ||||||
| 2026-02-17 | 13F | Creative Planning | 16.986 | 911 | ||||||
| 2026-04-15 | 13F | Atwood & Palmer Inc | 800 | 0,00 | 43 | 2,38 | ||||
| 2026-04-28 | 13F | Golden State Equity Partners | 405 | 22 | ||||||
| 2026-02-13 | 13F | Pinnacle Wealth Planning Services, Inc. | 886 | 48 | ||||||
| 2026-04-20 | 13F | Eagle Strategies LLC | 275.311 | 3,38 | 14.896 | 4,24 | ||||
| 2026-02-09 | 13F | Bleakley Financial Group, LLC | 254.517 | -2,26 | 13.657 | -3,19 | ||||
| 2026-02-10 | 13F | One Capital Management, LLC | 0 | -100,00 | 0 | |||||
| 2026-02-02 | 13F | Breakwater Investment Management | 8.219 | 0,00 | 441 | -0,90 | ||||
| 2026-02-17 | 13F | Lantern Wealth Advisors, LLC | 42.885 | 31,91 | 2.301 | 30,66 | ||||
| 2026-02-17 | 13F | Perennial Investment Advisors, LLC | 0 | -100,00 | 0 | |||||
| 2026-01-26 | 13F | AE Wealth Management LLC | 583 | 0,87 | 31 | 0,00 | ||||
| 2026-02-17 | 13F | Advisory Services Network, LLC | 14.094 | 0,72 | 756 | -0,26 | ||||
| 2026-04-10 | 13F | Abound Wealth Management | 284 | 15 | ||||||
| 2026-02-13 | 13F | Sofos Investments, Inc. | 65 | 0,00 | 3 | 0,00 | ||||
| 2026-03-04 | 13F | Rehmann Capital Advisory Group | 19.499 | 0,00 | 1.046 | -0,95 | ||||
| 2026-04-08 | 13F | Miracle Mile Advisors, LLC | 5.600 | -71,74 | 303 | -71,59 | ||||
| 2026-02-10 | 13F/A | Northwestern Mutual Wealth Management Co | 200 | 11 | ||||||
| 2026-02-12 | 13F | Great Valley Advisor Group, Inc. | 127.875 | 8,74 | 6.862 | 7,69 | ||||
| 2026-04-29 | 13F | Montag A & Associates Inc | 9.385 | 0,00 | 508 | 0,40 | ||||
| 2026-04-30 | 13F | Cambridge Investment Research Advisors, Inc. | 0 | -100,00 | 0 | |||||
| 2026-02-17 | 13F | Advisor Group Holdings, Inc. | 129.948 | 0,30 | 6.984 | -0,64 | ||||
| 2026-02-20 | 13F | Kovitz Investment Group Partners, LLC | 0 | -100,00 | 0 | |||||
| 2026-02-06 | 13F | Tortoise Investment Management, LLC | 0 | -100,00 | 0 | |||||
| 2026-02-18 | 13F | Beacon Pointe Advisors, LLC | 56.468 | -22,22 | 3.030 | -22,96 | ||||
| 2025-12-29 | 13F | Cape Investment Advisory, Inc. | 0 | -100,00 | 0 | |||||
| 2026-02-13 | 13F | Archetype Wealth Partners | 4.275 | 0,02 | 0 | |||||
| 2026-02-12 | 13F | Federation des caisses Desjardins du Quebec | 323 | 0,00 | 17 | 0,00 | ||||
| 2026-04-22 | 13F | Pinnacle Bancorp, Inc. | 380 | 0,00 | 21 | 0,00 | ||||
| 2026-02-17 | 13F | Cetera Investment Advisers | 7.854 | 58,96 | 421 | 57,68 | ||||
| 2026-04-29 | 13F | KERR FINANCIAL PLANNING Corp | 456 | -49,67 | 25 | -50,00 | ||||
| 2026-04-24 | 13F | Courage Miller Partners, LLC | 10.084 | 0,00 | 546 | 0,74 | ||||
| 2026-01-20 | 13F | Semitam Bonam Llc | 0 | -100,00 | 0 | |||||
| 2026-04-27 | 13F | Western Reserve Capital Management, LLC | 4.118 | 0,00 | 223 | 0,91 | ||||
| 2026-02-17 | 13F | NorthRock Partners, LLC | 7.844 | 421 | ||||||
| 2026-02-13 | 13F | Gould Asset Management Llc /ca/ | 10.110 | -1,84 | 543 | -2,87 | ||||
| 2026-04-20 | 13F | Breakwater Capital Group | 6.078 | 14,92 | 329 | 15,90 | ||||
| 2026-02-17 | 13F | Private Advisor Group, LLC | 0 | -100,00 | 0 | |||||
| 2026-02-02 | 13F | Cornerstone Planning Group LLC | 421 | -0,47 | 23 | -43,59 | ||||
| 2026-02-06 | 13F | Global Retirement Partners, LLC | 1.029 | -14,18 | 55 | -14,06 | ||||
| 2026-02-10 | 13F | Envestnet Asset Management Inc | 88.014 | 1,70 | 4.723 | 0,73 | ||||
| 2026-04-22 | 13F | Princeton Global Asset Management LLC | 312 | 0,00 | 17 | 0,00 | ||||
| 2026-02-03 | 13F | McIlrath & Eck, LLC | 89 | 0,00 | 5 | 0,00 | ||||
| 2026-02-13 | 13F | Bank Of Nova Scotia | 274.896 | -23,54 | 14.750 | -24,27 | ||||
| 2026-04-14 | 13F | HMV Wealth Advisors, LLC | 10.655 | 0,00 | 577 | 0,88 | ||||
| 2026-04-21 | 13F | Delap Wealth Advisory, Llc | 4.280 | 0,00 | 232 | 0,87 | ||||
| 2026-02-17 | 13F | Vertex Planning Partners, LLC | 8.225 | -2,88 | 441 | -3,71 | ||||
| 2026-02-17 | 13F | Raymond James Financial Inc | 27.947 | 268,01 | 1.500 | 264,72 | ||||
| 2026-02-17 | 13F | Mercer Global Advisors Inc /adv | 5.802 | 3,59 | 311 | 2,64 | ||||
| 2026-02-12 | 13F | Wealthspire Advisors, LLC | 0 | -100,00 | 0 | |||||
| 2026-02-13 | 13F | Fiduciary Trust Co | 17.638 | 0,00 | 946 | -0,94 | ||||
| 2026-02-06 | 13F | Lutz Financial Services LLC | 78.868 | -7,88 | 4.232 | -8,75 | ||||
| 2026-01-23 | 13F | Natural Investments, Llc | 0 | -100,00 | 0 | |||||
| 2026-04-15 | 13F | Marathon Strategic Advisors, LLC | 4.964 | -0,60 | 269 | 0,37 | ||||
| 2026-02-17 | 13F | Royal Bank Of Canada | 133.509 | 1,08 | 7.163 | 0,08 | ||||
| 2026-02-17 | 13F | Captrust Financial Advisors | 44.593 | -8,12 | 2.393 | -9,01 | ||||
| 2025-11-10 | 13F | EverSource Wealth Advisors, LLC | 0 | -100,00 | 0 | -100,00 | ||||
| 2026-04-27 | 13F | Td Private Client Wealth Llc | 15.531 | -14,80 | 840 | -14,11 | ||||
| 2026-02-02 | 13F | Fifth Third Bancorp | 207 | 0,00 | 11 | 0,00 | ||||
| 2025-11-10 | 13F | Efficient Advisors, LLC | 0 | -100,00 | 0 | |||||
| 2026-01-23 | 13F | Assetmark, Inc | 13 | 0,00 | 1 | |||||
| 2026-02-10 | 13F | Cherry Tree Wealth Management, LLC | 13.279 | 14,07 | 713 | 13,02 | ||||
| 2026-02-11 | 13F | Tiaa Trust, National Association | 220.523 | -5,50 | 11.833 | -6,40 | ||||
| 2026-02-13 | 13F | Morgan Stanley | 513.365 | -11,02 | 27.547 | -11,87 | ||||
| 2026-01-30 | 13F | Canandaigua National Bank & Trust Co | 4.150 | 0,00 | 223 | -0,89 | ||||
| 2026-02-04 | 13F | Ameritas Advisory Services, LLC | 364.904 | 19.581 | ||||||
| 2026-04-28 | 13F | Indiana Trust & Investment Management CO | 64 | 3 | ||||||
| 2026-02-17 | 13F | Ameriprise Financial Inc | 64.130 | 2,45 | 3.441 | 1,47 | ||||
| 2025-11-14 | 13F | Hrt Financial Lp | 0 | -100,00 | 0 | |||||
| 2026-04-28 | 13F | Arbor Investment Advisors, LLC | 96.423 | 2,00 | 5.217 | 2,86 | ||||
| 2026-04-16 | 13F | Diversified Trust Co | 6.000 | -5,21 | 325 | -4,42 | ||||
| 2026-02-17 | 13F | Susquehanna International Group, Llp | 27.607 | 114,76 | 1.481 | 112,79 | ||||
| 2025-12-02 | 13F | IFP Advisors, Inc | 0 | -100,00 | 0 | |||||
| 2026-04-15 | 13F | Belleair Asset Management, LLC | 28.000 | -10,49 | 1.515 | -9,77 | ||||
| 2025-11-12 | 13F | Ameriflex Group, Inc. | 0 | -100,00 | 0 | |||||
| 2026-04-22 | 13F | Essential Planning, LLC. | 19.698 | -5,19 | 1.066 | -4,40 | ||||
| 2025-11-14 | 13F | Wood Tarver Financial Group, LLC | 0 | -100,00 | 0 | |||||
| 2026-01-29 | 13F | D.a. Davidson & Co. | 63.400 | 11,31 | 3.402 | 10,28 | ||||
| 2026-02-12 | 13F | Commonwealth Equity Services, Llc | 30.280 | 51,58 | 1.625 | 162.300,00 | ||||
| 2026-02-13 | 13F | Ausdal Financial Partners, Inc. | 11.480 | -5,46 | 616 | -6,24 | ||||
| 2026-04-20 | 13F | KFA Private Wealth Group, LLC | 8.580 | 464 | ||||||
| 2026-02-18 | 13F | GWM Advisors LLC | 0 | -100,00 | 0 | |||||
| 2026-01-26 | 13F | Consolidated Portfolio Review Corp | 0 | -100,00 | 0 | |||||
| 2026-04-16 | 13F | Fiduciary Advisors, Inc. | 202 | 0,00 | 11 | 0,00 | ||||
| 2026-01-28 | 13F | Alesco Advisors Llc | 16.710 | -0,02 | 897 | -0,99 | ||||
| 2026-01-22 | 13F | Harwood Advisory Group, LLC | 82 | 0,00 | 4 | 0,00 | ||||
| 2026-02-13 | 13F | Flow Traders U.s. Llc | 91.777 | 373,69 | 5 | 300,00 | ||||
| 2026-04-30 | 13F | Kestra Advisory Services, LLC | 8.247 | 25,77 | 446 | 27,07 | ||||
| 2025-11-05 | 13F | Burt Wealth Advisors | 15.052 | 0,00 | 815 | 0,74 | ||||
| 2026-01-29 | 13F | UBS Group AG | 41.412 | 2,07 | 2.222 | 1,09 | ||||
| 2026-04-08 | 13F | Canandaigua National Corp | 4.150 | 225 | ||||||
| 2026-02-17 | 13F | Tower Research Capital LLC (TRC) | 9.746 | 523 | ||||||
| 2026-02-12 | 13F | Steward Partners Investment Advisory, Llc | 16.370 | 0,00 | 878 | -0,90 | ||||
| 2026-04-22 | 13F | Jim Saulnier & Associates, Llc | 8.291 | -3,84 | 449 | -3,03 | ||||
| 2026-04-21 | 13F | Cambient Family Office, Llc | 3.721 | 0,00 | 201 | 0,50 | ||||
| 2026-01-29 | 13F | Concurrent Investment Advisors, LLC | 41.369 | 2,34 | 2.220 | 1,32 | ||||
| 2026-02-05 | 13F | Allworth Financial LP | 9.664 | -7,00 | 519 | -7,83 | ||||
| 2026-02-11 | 13F | Cerity Partners LLC | 4.554 | 244 | ||||||
| 2025-11-14 | 13F | Strategic Wealth Partners, Ltd. | 362 | 0,00 | 20 | 0,00 | ||||
| 2026-04-08 | 13F | Evanson Asset Management, LLC | 6.306 | 0,00 | 341 | 0,89 | ||||
| 2026-02-06 | 13F | Pnc Financial Services Group, Inc. | 5.335 | -13,67 | 286 | -14,37 | ||||
| 2026-02-09 | 13F | Harbour Investments, Inc. | 76 | 0,00 | 4 | 0,00 | ||||
| 2026-02-17 | 13F | Citadel Advisors Llc | 37.319 | 2.003 | ||||||
| 2026-02-17 | 13F | Fmr Llc | 3 | -40,00 | 0 | |||||
| 2026-04-27 | 13F | Iron Financial, LLC | 5.507 | 0,16 | 298 | 0,68 | ||||
| 2025-11-04 | 13F | Garrison Bradford & Associates Inc | 0 | -100,00 | 0 | |||||
| 2026-04-20 | 13F | Apella Capital, LLC | 3.953 | -0,90 | 215 | 0,00 | ||||
| 2026-02-11 | 13F | LPL Financial LLC | 202.586 | -12,34 | 10.871 | -13,18 | ||||
| 2026-02-17 | 13F | Blair William & Co/il | 645 | 0,00 | 35 | 0,00 | ||||
| 2026-02-17 | 13F | IHT Wealth Management, LLC | 63.298 | -43,88 | 3.397 | -44,42 | ||||
| 2026-04-27 | 13F | Truist Financial Corp | 35.021 | -4,26 | 1.895 | -3,47 | ||||
| 2026-02-13 | 13F | MAI Capital Management | 1.963 | -1,95 | 105 | -2,78 | ||||
| 2026-04-21 | 13F | Maseco Llp | 793 | -28,88 | 43 | -28,81 | ||||
| 2026-04-27 | 13F | Kelman-Lazarov, Inc. | 130.364 | -3,48 | 7.054 | -2,68 | ||||
| 2026-02-10 | 13F | WCG Wealth Advisors LLC | 11.400 | 612 | ||||||
| 2026-02-13 | 13F | Colony Group, LLC | 68.120 | 114,33 | 3.655 | 112,38 | ||||
| 2026-01-12 | 13F | KWB Wealth | 0 | -100,00 | 0 | |||||
| 2026-02-03 | 13F | Detalus Advisors, LLC | 0 | -100,00 | 0 | |||||
| 2026-01-26 | 13F | Cwm, Llc | 2.379 | -3,17 | 0 | |||||
| 2026-02-10 | 13F | Goldman Sachs Group Inc | 156.514 | 60,27 | 8.399 | 58,75 | ||||
| 2025-11-13 | 13F | Herold Advisors, Inc. | 0 | -100,00 | 0 | |||||
| 2026-02-17 | 13F | Jones Financial Companies Lllp | 6.579 | 34,79 | 353 | 33,71 | ||||
| 2026-02-12 | 13F | Jane Street Group, Llc | 92.897 | 134,29 | 4.985 | 132,03 | ||||
| 2026-02-17 | 13F | Pinnacle Financial Partners, Inc. | 5.150 | 276 | ||||||
| 2026-02-13 | 13F | Stifel Financial Corp | 89.326 | 5,92 | 4.793 | 4,93 | ||||
| 2026-04-08 | 13F | Pines Wealth Management, LLC | 5.134 | 0,00 | 278 | 0,73 | ||||
| 2026-01-28 | 13F | Geneos Wealth Management Inc. | 1.685 | -34,77 | 90 | -35,25 | ||||
| 2026-02-06 | 13F | HighTower Advisors, LLC | 4.542 | 0,00 | 244 | -1,22 | ||||
| 2026-02-06 | 13F | 3EDGE Asset Management, LP | 0 | -100,00 | 0 | |||||
| 2026-02-13 | 13F | Destination Wealth Management | 19.825 | -31,78 | 1.064 | -32,47 | ||||
| 2026-02-13 | 13F | Mml Investors Services, Llc | 12.666 | 16,42 | 680 | 15,28 | ||||
| 2026-02-17 | 13F | Bank Of America Corp /de/ | 550.845 | 9,00 | 29.558 | 7,96 | ||||
| 2026-02-11 | 13F | Jpmorgan Chase & Co | 26.640 | 1.248,18 | 1.430 | 1.235,51 | ||||
| 2025-11-07 | 13F | Synovus Financial Corp | 5.150 | 0,00 | 279 | 0,72 | ||||
| 2026-02-13 | 13F | Motiv8 Investments LLC | 22.200 | 1,76 | 1 | -99,92 | ||||
| 2026-02-14 | 13F | Rockefeller Capital Management L.P. | 11.687 | 3,44 | 627 | 2,45 | ||||
| 2026-02-12 | 13F | Summit Financial, LLC | 20.073 | -7,37 | 1.081 | -8,01 | ||||
| 2026-02-12 | 13F | Gallagher Capital Advisors, LLC | 13.939 | 597 | ||||||
| 2026-02-11 | 13F | Buckingham Strategic Partners | 0 | -100,00 | 0 | |||||
| 2026-04-17 | 13F | Mezzasalma Advisors, LLC | 6.140 | 6,34 | 332 | 7,44 |