Grundlæggende statistik
| Institutionelle ejere | 112 total, 108 long only, 0 short only, 4 long/short - change of 0,00% MRQ |
| Gennemsnitlig porteføljeallokering | 0.0202 % - change of -21,07% MRQ |
| Institutionelle aktier (lange) | 17.382.945 (ex 13D/G) - change of 1,08MM shares 6,61% MRQ |
| Institutionel værdi (lang) | $ 75.419 USD ($1000) |
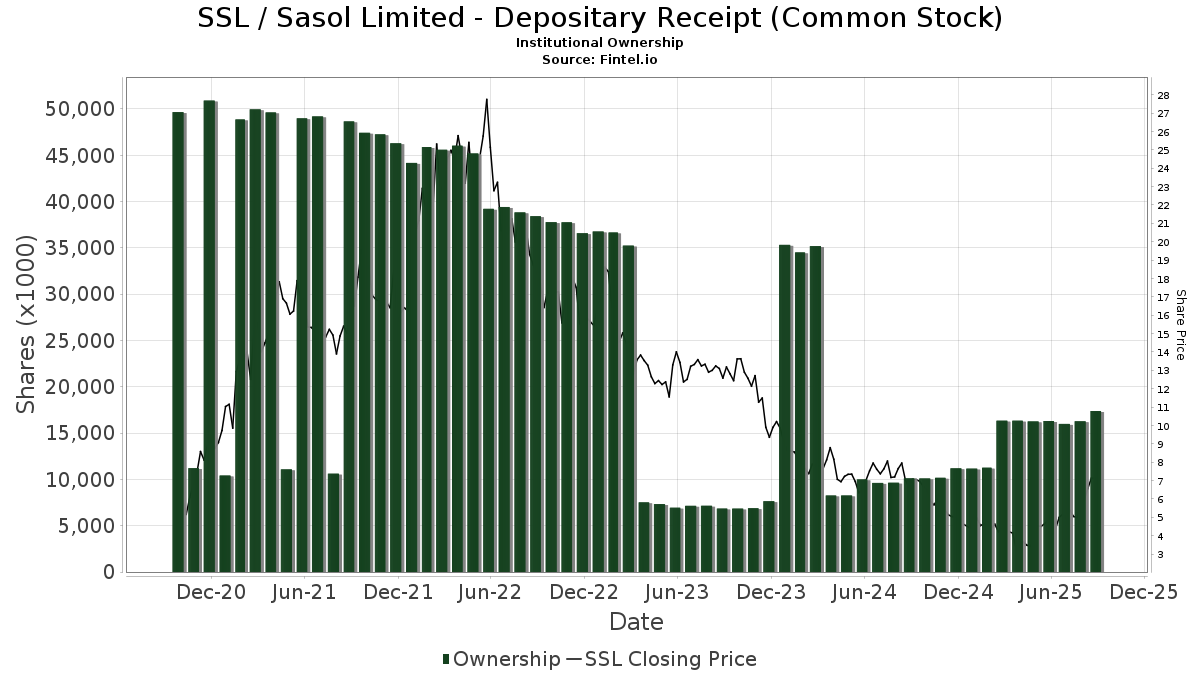
Institutionelt ejerskab og aktionærer
Sasol Limited - Depositary Receipt (Common Stock) (US:SSL) har 112 institutionelle ejere og aktionærer, der har indsendt 13D/G- eller 13F-formularer til Securities Exchange Commission (SEC). Disse institutioner har i alt 17,382,945 aktier. Største aktionærer omfatter Morgan Stanley, BlackRock, Inc., Two Sigma Investments, Lp, Two Sigma Advisers, Lp, American Century Companies Inc, Goldman Sachs Group Inc, Connor, Clark & Lunn Investment Management Ltd., AVEM - Avantis Emerging Markets Equity ETF, Dimensional Fund Advisors Lp, and UBS Group AG .
Sasol Limited - Depositary Receipt (Common Stock) (NYSE:SSL) institutionel ejerskabsstruktur viser aktuelle positioner i virksomheden efter institutioner og fonde, samt seneste ændringer i positionsstørrelse. Større aktionærer kan omfatte individuelle investorer, investeringsforeninger, hedgefonde eller institutioner. Skema 13D angiver, at investoren besidder (eller besidder) mere end 5 % af virksomheden og har til hensigt (eller har til hensigt at) aktivt at forfølge en ændring i forretningsstrategi. Skema 13G indikerer en passiv investering på over 5%.
The share price as of September 9, 2025 is 6,89 / share. Previously, on September 10, 2024, the share price was 6,80 / share. This represents an increase of 1,32% over that period.
Fondens stemningsscore
Fund Sentiment Score (fka Ownership Accumulation Score) finder de aktier, der bliver mest købt af fonde. Det er resultatet af en sofistikeret, multi-faktor kvantitativ model, der identificerer virksomheder med de højeste niveauer af institutionel akkumulering. Scoringsmodellen bruger en kombination af den samlede stigning i oplyste ejere, ændringerne i porteføljeallokeringer i disse ejere og andre målinger. Tallet går fra 0 til 100, hvor højere tal indikerer et højere niveau af akkumulering for sine jævnaldrende, og 50 er gennemsnittet.
Opdateringsfrekvens: Dagligt
Se Ownership Explorer, som giver en liste over højest rangerende virksomheder.
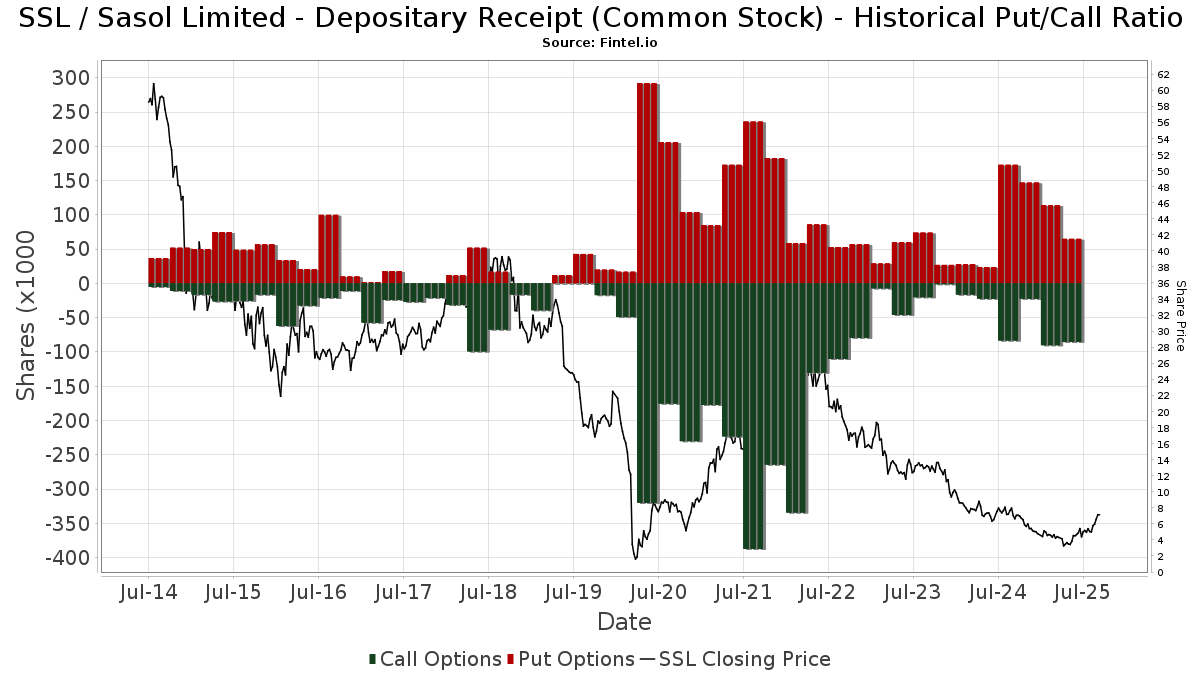
Institutionel Put/Call-forhold
Ud over at indberette standardaktie- og gældsudstedelser skal institutter med mere end 100 mill. aktiver under forvaltning også oplyse deres put- og call-optionsbeholdninger. Da salgsoptioner generelt indikerer negativ stemning, og købsoptioner indikerer positiv stemning, kan vi få en fornemmelse af den overordnede institutionelle stemning ved at plotte forholdet mellem put og kald. Diagrammet til højre viser det historiske put/call-forhold for dette instrument.
Brug af Put/Call Ratio som en indikator for investorernes stemning overvinder en af de vigtigste mangler ved at bruge totalt institutionelt ejerskab, som er, at en betydelig mængde af aktiver under forvaltning investeres passivt for at spore indekser. Passivt forvaltede fonde køber typisk ikke optioner, så indikatoren for put/call-forholdet følger mere nøje følelsen af aktivt forvaltede fonde.
13F og NPORT arkivering
Detaljer om 13F-arkivering er gratis. Detaljer om NP-ansøgninger kræver et premium-medlemskab. Grønne rækker angiver nye positioner. Røde rækker angiver lukkede positioner. Klik på linket ikon for at se den fulde transaktionshistorik.
Opgrader
for at låse premium-data op og eksportere til Excel ![]() .
.
| Fil dato | Kilde | Investor | Type | Gennemsnitlig pris (Øst) |
Aktier | Δ Aktier (%) |
Rapporteret Værdi ($1000) |
Δ Værdi (%) |
Port Alloc (%) |
|
|---|---|---|---|---|---|---|---|---|---|---|
| 2025-07-28 | NP | AVEEX - Avantis Emerging Markets Equity Fund Institutional Class This fund is a listed as child fund of American Century Companies Inc and if that institution has disclosed ownership in this security, then these positions will not be double counted when calculating total shares and total value | 26.634 | 0,00 | 118 | 1,72 | ||||
| 2025-06-26 | NP | DFA INVESTMENT DIMENSIONS GROUP INC - World ex U.S. Core Equity Portfolio Institutional Class Shares | 20.702 | 0,00 | 72 | -25,77 | ||||
| 2025-08-06 | 13F | Savant Capital, LLC | 36.116 | 160 | ||||||
| 2025-08-14 | 13F | Raymond James Financial Inc | 9.484 | -20,33 | 42 | -18,00 | ||||
| 2025-07-08 | 13F | Parallel Advisors, LLC | 17.169 | 119,86 | 76 | 127,27 | ||||
| 2025-08-08 | 13F | Abc Arbitrage Sa | 188.436 | 833 | ||||||
| 2025-08-14 | 13F | Evergreen Capital Management Llc | 23.166 | 102 | ||||||
| 2025-05-05 | 13F | Lindbrook Capital, Llc | 3.168 | -55,96 | 13 | -59,37 | ||||
| 2025-08-14 | 13F | UBS Group AG | 631.731 | -14,31 | 2.792 | -10,46 | ||||
| 2025-08-12 | 13F | XTX Topco Ltd | 0 | -100,00 | 0 | |||||
| 2025-08-13 | 13F | Guggenheim Capital Llc | 19.861 | -5,68 | 88 | -2,25 | ||||
| 2025-04-30 | 13F | Nisa Investment Advisors, Llc | 0 | -100,00 | 0 | |||||
| 2025-08-14 | 13F | Royal Bank Of Canada | 15.936 | -8,13 | 71 | -2,74 | ||||
| 2025-05-15 | 13F | Pinnacle Wealth Planning Services, Inc. | 0 | -100,00 | 0 | |||||
| 2025-08-12 | 13F | Jpmorgan Chase & Co | 59.395 | 7.081,98 | 263 | 8.633,33 | ||||
| 2025-07-25 | 13F | Cwm, Llc | 1.727 | -69,44 | 0 | |||||
| 2025-08-14 | 13F | Two Sigma Securities, Llc | 0 | -100,00 | 0 | |||||
| 2025-07-28 | NP | AVEM - Avantis Emerging Markets Equity ETF This fund is a listed as child fund of American Century Companies Inc and if that institution has disclosed ownership in this security, then these positions will not be double counted when calculating total shares and total value | 735.074 | 26,23 | 3.264 | 28,26 | ||||
| 2025-08-14 | 13F | Bnp Paribas Arbitrage, Sa | 221.995 | 210,48 | 981 | 224,83 | ||||
| 2025-08-08 | 13F | SG Americas Securities, LLC | 76.763 | 0 | ||||||
| 2025-05-08 | 13F | Essential Planning, LLC. | 0 | -100,00 | 0 | |||||
| 2025-08-12 | 13F | Pacer Advisors, Inc. | 142.633 | 128,96 | 635 | 144,79 | ||||
| 2025-08-14 | 13F | Bank Of America Corp /de/ | 537.250 | 206,17 | 2.375 | 219,95 | ||||
| 2025-08-15 | 13F | CI Private Wealth, LLC | 20.740 | -31,20 | 92 | -28,35 | ||||
| 2025-07-14 | 13F | UMA Financial Services, Inc. | 211 | 37,91 | 1 | |||||
| 2025-08-12 | 13F | American Century Companies Inc | 890.502 | 25,48 | 3.936 | 31,16 | ||||
| 2025-08-12 | 13F | Dimensional Fund Advisors Lp | 724.589 | -26,13 | 3.203 | -22,79 | ||||
| 2025-08-13 | 13F | Jump Financial, LLC | 388.598 | 211,33 | 1.718 | 225,81 | ||||
| 2025-08-14 | 13F | Sunbelt Securities, Inc. | 99 | 0,00 | 0 | |||||
| 2025-07-22 | 13F | Net Worth Advisory Group | 21.611 | 5,12 | 96 | 10,47 | ||||
| 2025-04-24 | 13F | PDS Planning, Inc | 0 | -100,00 | 0 | |||||
| 2025-08-12 | 13F | Skopos Labs, Inc. | 2.184 | 0,00 | 9 | 0,00 | ||||
| 2025-08-13 | 13F | Cerity Partners LLC | 43.002 | -25,03 | 190 | -21,49 | ||||
| 2025-05-15 | 13F | Point72 Hong Kong Ltd | 0 | -100,00 | 0 | -100,00 | ||||
| 2025-08-14 | 13F | Group One Trading, L.p. | 9.426 | -47,47 | 42 | -45,33 | ||||
| 2025-08-07 | 13F | Allworth Financial LP | 3.213 | 205,71 | 14 | 366,67 | ||||
| 2025-08-14 | 13F | Mariner, LLC | 206.154 | 236,03 | 911 | 251,74 | ||||
| 2025-08-14 | 13F | Group One Trading, L.p. | Put | 7.200 | -61,08 | 32 | -60,26 | |||
| 2025-08-14 | 13F | Sei Investments Co | 0 | -100,00 | 0 | |||||
| 2025-08-14 | 13F | Group One Trading, L.p. | Call | 10.200 | 920,00 | 45 | 1.025,00 | |||
| 2025-08-15 | 13F | Morgan Stanley | 3.089.253 | 39,02 | 13.655 | 45,27 | ||||
| 2025-08-15 | 13F | Tower Research Capital LLC (TRC) | 5.566 | -46,96 | 25 | -45,45 | ||||
| 2025-08-12 | 13F | Aigen Investment Management, Lp | 0 | -100,00 | 0 | |||||
| 2025-06-26 | NP | Dfa Investment Trust Co - The Emerging Markets Series This fund is a listed as child fund of Dimensional Fund Advisors Lp and if that institution has disclosed ownership in this security, then these positions will not be double counted when calculating total shares and total value | 305.779 | -19,24 | 1.064 | -40,19 | ||||
| 2025-08-11 | 13F | Bell Investment Advisors, Inc | 70 | 0,00 | 0 | |||||
| 2025-07-21 | 13F | Qrg Capital Management, Inc. | 22.781 | 11,33 | 101 | 16,28 | ||||
| 2025-08-08 | 13F | Creative Planning | 246.324 | 157,03 | 1.089 | 168,64 | ||||
| 2025-08-14 | 13F | GWM Advisors LLC | 18.814 | 47,57 | 83 | 56,60 | ||||
| 2025-08-14 | 13F | Point72 Asset Management, L.P. | 512.500 | 23,44 | 2.265 | 28,99 | ||||
| 2025-08-14 | 13F | Wells Fargo & Company/mn | 10.533 | 37,61 | 47 | 43,75 | ||||
| 2025-08-13 | 13F | Walleye Capital LLC | 0 | -100,00 | 0 | -100,00 | ||||
| 2025-07-28 | NP | AVXC - Avantis Emerging Markets ex-China Equity ETF | 6.939 | 37,43 | 31 | 36,36 | ||||
| 2025-08-08 | 13F | SBI Securities Co., Ltd. | 12.852 | 2,87 | 57 | 7,69 | ||||
| 2025-08-14 | 13F | Millennium Management Llc | 32.510 | -97,76 | 144 | -97,67 | ||||
| 2025-05-06 | 13F | Advisors Preferred, LLC | 0 | -100,00 | 0 | |||||
| 2025-07-08 | 13F | Northwest & Ethical Investments L.P. | 0 | -100,00 | 0 | |||||
| 2025-08-13 | 13F | First Trust Advisors Lp | 14.155 | -5,15 | 63 | -1,59 | ||||
| 2025-08-07 | 13F | Connor, Clark & Lunn Investment Management Ltd. | 767.312 | 11,93 | 3.392 | 16,97 | ||||
| 2025-08-14 | 13F | Quartz Partners, LLC | 14.504 | 8,01 | 64 | 14,29 | ||||
| 2025-08-14 | 13F | Aqr Capital Management Llc | 22.987 | 102 | ||||||
| 2025-07-24 | 13F | Ronald Blue Trust, Inc. | 13.245 | -23,12 | 59 | -19,44 | ||||
| 2025-05-15 | 13F | Verition Fund Management LLC | 0 | -100,00 | 0 | -100,00 | ||||
| 2025-05-15 | 13F | Jain Global LLC | 0 | -100,00 | 0 | |||||
| 2025-08-14 | 13F | Susquehanna International Group, Llp | Put | 36.200 | -41,33 | 160 | -38,46 | |||
| 2025-08-14 | 13F | Susquehanna International Group, Llp | 11.756 | -93,96 | 52 | -93,80 | ||||
| 2025-08-12 | 13F | Coldstream Capital Management Inc | 0 | -100,00 | 0 | |||||
| 2025-08-12 | 13F | Pathstone Holdings, LLC | 31.049 | -3,90 | 137 | 0,74 | ||||
| 2025-08-14 | 13F | Susquehanna International Group, Llp | Call | 25.100 | 42,61 | 111 | 48,65 | |||
| 2025-08-12 | 13F | Proequities, Inc. | Put | 0 | 0 | |||||
| 2025-08-13 | 13F | Quadrant Capital Group Llc | 152.631 | 264,80 | 675 | 282,95 | ||||
| 2025-06-30 | NP | CAFRX - Africa Fund | 4.000 | 0,00 | 14 | -27,78 | ||||
| 2025-08-12 | 13F | Proequities, Inc. | Call | 0 | 0 | |||||
| 2025-05-05 | 13F | Creekmur Asset Management LLC | 0 | -100,00 | 0 | |||||
| 2025-08-11 | 13F | Private Advisor Group, LLC | 41.939 | 75,82 | 185 | 85,00 | ||||
| 2025-08-12 | 13F | Proequities, Inc. | 0 | 0 | ||||||
| 2025-08-08 | 13F | Gts Securities Llc | 29.088 | 129 | ||||||
| 2025-07-24 | 13F | Us Bancorp \de\ | 23.635 | 14,71 | 104 | 19,54 | ||||
| 2025-07-25 | 13F | JustInvest LLC | 34.523 | -25,37 | 153 | -22,05 | ||||
| 2025-08-12 | 13F | BlackRock, Inc. | 2.011.911 | 55,03 | 8.893 | 62,00 | ||||
| 2025-08-12 | 13F | Trexquant Investment LP | 0 | -100,00 | 0 | |||||
| 2025-07-30 | NP | APIE - ActivePassive International Equity ETF | 54.732 | 64,07 | 243 | 67,59 | ||||
| 2025-07-16 | 13F | Signaturefd, Llc | 26.790 | 137,54 | 118 | 151,06 | ||||
| 2025-08-12 | 13F | LPL Financial LLC | 129.340 | 121,80 | 572 | 132,11 | ||||
| 2025-08-13 | 13F | Centiva Capital, LP | 0 | -100,00 | 0 | |||||
| 2025-08-13 | 13F | Northern Trust Corp | 162.406 | 0,95 | 718 | 5,44 | ||||
| 2025-08-14 | 13F | Van Eck Associates Corp | 1.176 | -28,34 | 0 | |||||
| 2025-07-14 | 13F | GAMMA Investing LLC | 4.155 | 231,08 | 18 | 260,00 | ||||
| 2025-08-21 | NP | AFK - VanEck Vectors Africa Index ETF | 28.350 | -1,12 | 125 | 3,31 | ||||
| 2025-08-13 | 13F | Barclays Plc | 0 | -100,00 | 0 | |||||
| 2025-08-11 | 13F | Principal Securities, Inc. | 167 | 221,15 | 1 | |||||
| 2025-07-24 | 13F | Jfs Wealth Advisors, Llc | 271 | 1 | ||||||
| 2025-08-14 | 13F | D. E. Shaw & Co., Inc. | 202.856 | -54,32 | 897 | -52,29 | ||||
| 2025-08-14 | 13F | Ariadne Wealth Management, LP | 11.772 | 68 | ||||||
| 2025-07-28 | NP | AVES - Avantis Emerging Markets Value ETF This fund is a listed as child fund of American Century Companies Inc and if that institution has disclosed ownership in this security, then these positions will not be double counted when calculating total shares and total value | 83.985 | 14,17 | 373 | 15,89 | ||||
| 2025-08-14 | 13F | Goldman Sachs Group Inc | 862.405 | 575,68 | 3.812 | 607,05 | ||||
| 2025-08-14 | 13F | Jane Street Group, Llc | 281.722 | 82,11 | 1.245 | 90,37 | ||||
| 2025-05-02 | 13F | Pzena Investment Management Llc | 0 | -100,00 | 0 | |||||
| 2025-05-14 | 13F | EntryPoint Capital, LLC | 0 | -100,00 | 0 | |||||
| 2025-08-12 | 13F | Rhumbline Advisers | 6.235 | -9,57 | 28 | -6,90 | ||||
| 2025-05-15 | 13F | Engineers Gate Manager LP | 0 | -100,00 | 0 | |||||
| 2025-07-18 | 13F | Generali Investments CEE, investicni spolecnost, a.s. | 367.196 | 0,00 | 1.623 | 4,51 | ||||
| 2025-07-25 | 13F | Sequoia Financial Advisors, LLC | 13.875 | 8,47 | 61 | 12,96 | ||||
| 2025-08-14 | 13F | Banco BTG Pactual S.A. | 20.000 | 88 | ||||||
| 2025-08-14 | 13F | Two Sigma Investments, Lp | 1.004.589 | -33,71 | 4.440 | -30,73 | ||||
| 2025-08-14 | 13F | Wetherby Asset Management Inc | 31.130 | -0,16 | 138 | -3,52 | ||||
| 2025-08-11 | 13F | Brown Brothers Harriman & Co | 435 | 2 | ||||||
| 2025-08-14 | 13F | Vident Advisory, LLC | 59.417 | -17,00 | 263 | -13,25 | ||||
| 2025-08-13 | 13F | Renaissance Technologies Llc | 393.800 | -8,84 | 1.741 | -4,76 | ||||
| 2025-08-14 | 13F | Ieq Capital, Llc | 13.580 | 60 | ||||||
| 2025-08-06 | 13F | True Wealth Design, LLC | 43 | -15,69 | 0 | |||||
| 2025-07-15 | 13F | Public Employees Retirement System Of Ohio | 95.728 | 15,87 | 423 | 21,20 | ||||
| 2025-07-09 | 13F | Sivia Capital Partners, LLC | 11.699 | 52 | ||||||
| 2025-08-11 | 13F | Citigroup Inc | 122.476 | 138,37 | 541 | 149,31 | ||||
| 2025-05-13 | 13F | HighTower Advisors, LLC | 0 | -100,00 | 0 | |||||
| 2025-07-30 | 13F | FNY Investment Advisers, LLC | 203.310 | 1 | ||||||
| 2025-05-12 | 13F | Greenwich Wealth Management LLC | 0 | -100,00 | 0 | |||||
| 2025-08-04 | 13F | Hantz Financial Services, Inc. | 0 | -100,00 | 0 | |||||
| 2025-08-08 | 13F | Pnc Financial Services Group, Inc. | 11.518 | 0,18 | 51 | 4,17 | ||||
| 2025-08-14 | 13F | Cubist Systematic Strategies, LLC | 285.377 | 39,36 | 1.261 | 45,61 | ||||
| 2025-08-12 | 13F | Virtu Financial LLC | 27.237 | 46,78 | 0 | |||||
| 2025-08-14 | 13F | Fmr Llc | 17.956 | -57,54 | 79 | -55,62 | ||||
| 2025-06-26 | NP | DFCEX - Emerging Markets Core Equity Portfolio - Institutional Class This fund is a listed as child fund of Dimensional Fund Advisors Lp and if that institution has disclosed ownership in this security, then these positions will not be double counted when calculating total shares and total value | 508.321 | 0,00 | 1.769 | -25,99 | ||||
| 2025-07-11 | 13F | Farther Finance Advisors, LLC | 691 | 230,62 | 3 | |||||
| 2025-07-25 | 13F | Apollon Wealth Management, LLC | 0 | -100,00 | 0 | |||||
| 2025-06-02 | 13F/A | Deutsche Bank Ag\ | 0 | -100,00 | 0 | |||||
| 2025-08-13 | 13F | FORA Capital, LLC | 0 | -100,00 | 0 | |||||
| 2025-08-14 | 13F | Schonfeld Strategic Advisors LLC | 0 | -100,00 | 0 | |||||
| 2025-07-14 | 13F | Abound Wealth Management | 26 | 0,00 | 0 | |||||
| 2025-08-05 | 13F | Simplex Trading, Llc | Call | 16.600 | -57,44 | 0 | ||||
| 2025-08-14 | 13F | Banque Transatlantique SA | 0 | -100,00 | 0 | |||||
| 2025-09-04 | 13F/A | Advisor Group Holdings, Inc. | 4.839 | -14,03 | 21 | -8,70 | ||||
| 2025-07-31 | 13F | Caitong International Asset Management Co., Ltd | 997 | 100,20 | 4 | 100,00 | ||||
| 2025-08-04 | 13F | Assetmark, Inc | 101 | 0 | ||||||
| 2025-08-07 | 13F | Sierra Ocean, Llc | 1.230 | 86,08 | 5 | 150,00 | ||||
| 2025-08-05 | 13F | Simplex Trading, Llc | Put | 100 | -99,39 | 0 | ||||
| 2025-08-05 | 13F | Simplex Trading, Llc | 2.676 | -76,74 | 0 | |||||
| 2025-08-15 | 13F | WealthCollab, LLC | 0 | -100,00 | 0 | |||||
| 2025-08-07 | 13F | Parkside Financial Bank & Trust | 406 | 2 | ||||||
| 2025-08-13 | 13F | EverSource Wealth Advisors, LLC | 8.960 | 347,33 | 40 | 387,50 | ||||
| 2025-07-28 | NP | VCGEX - Emerging Economies Fund | 20.550 | -79,64 | 91 | -80,00 | ||||
| 2025-07-15 | 13F | Ballentine Partners, LLC | 19.572 | 47,28 | 87 | 53,57 | ||||
| 2025-08-14 | 13F | Citadel Advisors Llc | 85.777 | -51,42 | 379 | -49,20 | ||||
| 2025-05-30 | NP | FRDM - Freedom 100 Emerging Markets ETF | 0 | -100,00 | 0 | -100,00 | ||||
| 2025-08-14 | 13F | Citadel Advisors Llc | Put | 22.000 | 24,29 | 97 | 31,08 | |||
| 2025-08-14 | 13F | Integrated Wealth Concepts LLC | 60.514 | 267 | ||||||
| 2025-04-23 | 13F | Legacy Advisors, LLC | 0 | -100,00 | 0 | |||||
| 2025-08-12 | 13F | MAI Capital Management | 2.652 | 12 | ||||||
| 2025-08-14 | 13F | Citadel Advisors Llc | Call | 33.200 | 1,84 | 147 | 6,57 | |||
| 2025-08-14 | 13F | Stifel Financial Corp | 264.506 | 1.169 | ||||||
| 2025-05-14 | 13F | Ameriprise Financial Inc | 0 | -100,00 | 0 | -100,00 | ||||
| 2025-08-14 | 13F | Barometer Capital Management Inc. | 51.821 | 5,93 | 229 | 11,17 | ||||
| 2025-08-14 | 13F | Two Sigma Advisers, Lp | 932.800 | -25,12 | 4.123 | -21,77 | ||||
| 2025-07-21 | 13F | Ameriflex Group, Inc. | 400 | -82,61 | 2 | -88,89 | ||||
| 2025-08-14 | 13F | Federation des caisses Desjardins du Quebec | 700 | -22,22 | 3 | 0,00 | ||||
| 2025-08-14 | 13F | Balyasny Asset Management Llc | 28.262 | -51,21 | 125 | -49,39 | ||||
| 2025-08-13 | 13F | Northwestern Mutual Wealth Management Co | 1.172 | 5 | ||||||
| 2025-08-19 | 13F | Asset Dedication, LLC | 0 | -100,00 | 0 | |||||
| 2025-08-12 | 13F | O'shaughnessy Asset Management, Llc | 0 | -100,00 | 0 | |||||
| 2025-07-28 | NP | NSI - National Security Emerging Markets Index ETF | 16.514 | 38,49 | 73 | 40,38 | ||||
| 2025-07-24 | 13F | IFP Advisors, Inc | 0 | -100,00 | 0 |
Other Listings
| DE:SAO | 6,15 € |