Grundlæggende statistik
| Institutionelle aktier (lange) | 59.632.622 - 111,56% (ex 13D/G) - change of -18,64MM shares -23,54% MRQ |
| Institutionel værdi (lang) | $ 785.611 USD ($1000) |
Institutionelt ejerskab og aktionærer
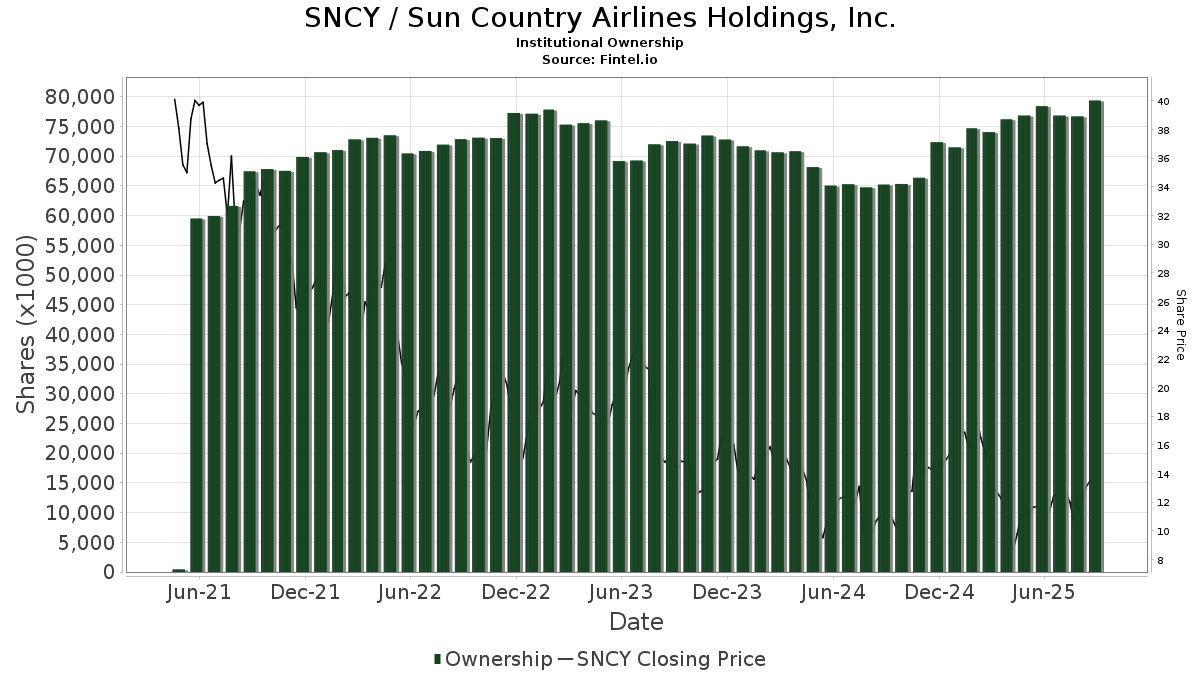
Sun Country Airlines Holdings, Inc. (US:SNCY) har 206 institutionelle ejere og aktionærer, der har indsendt 13D/G- eller 13F-formularer til Securities Exchange Commission (SEC). Disse institutioner har i alt 59,632,622 aktier. Største aktionærer omfatter BlackRock, Inc., Vanguard Group Inc, Frontier Capital Management Co Llc, Dimensional Fund Advisors Lp, Citadel Advisors Llc, Ameriprise Financial Inc, American Century Companies Inc, State Street Corp, Par Capital Management Inc, and U S Global Investors Inc .
Sun Country Airlines Holdings, Inc. (NasdaqGS:SNCY) institutionel ejerskabsstruktur viser aktuelle positioner i virksomheden efter institutioner og fonde, samt seneste ændringer i positionsstørrelse. Større aktionærer kan omfatte individuelle investorer, investeringsforeninger, hedgefonde eller institutioner. Skema 13D angiver, at investoren besidder (eller besidder) mere end 5 % af virksomheden og har til hensigt (eller har til hensigt at) aktivt at forfølge en ændring i forretningsstrategi. Skema 13G indikerer en passiv investering på over 5%.
The share price as of March 26, 2026 is 17,04 / share. Previously, on March 27, 2025, the share price was 13,37 / share. This represents an increase of 27,45% over that period.
Fondens stemningsscore
Fund Sentiment Score (fka Ownership Accumulation Score) finder de aktier, der bliver mest købt af fonde. Det er resultatet af en sofistikeret, multi-faktor kvantitativ model, der identificerer virksomheder med de højeste niveauer af institutionel akkumulering. Scoringsmodellen bruger en kombination af den samlede stigning i oplyste ejere, ændringerne i porteføljeallokeringer i disse ejere og andre målinger. Tallet går fra 0 til 100, hvor højere tal indikerer et højere niveau af akkumulering for sine jævnaldrende, og 50 er gennemsnittet.
Opdateringsfrekvens: Dagligt
Se Ownership Explorer, som giver en liste over højest rangerende virksomheder.
AI+ Ask Fintel’s AI assistant about Sun Country Airlines Holdings, Inc..
Select a question to share a public post with an AI-crafted answer.
Thinking of good questions…
Institutionel Put/Call-forhold
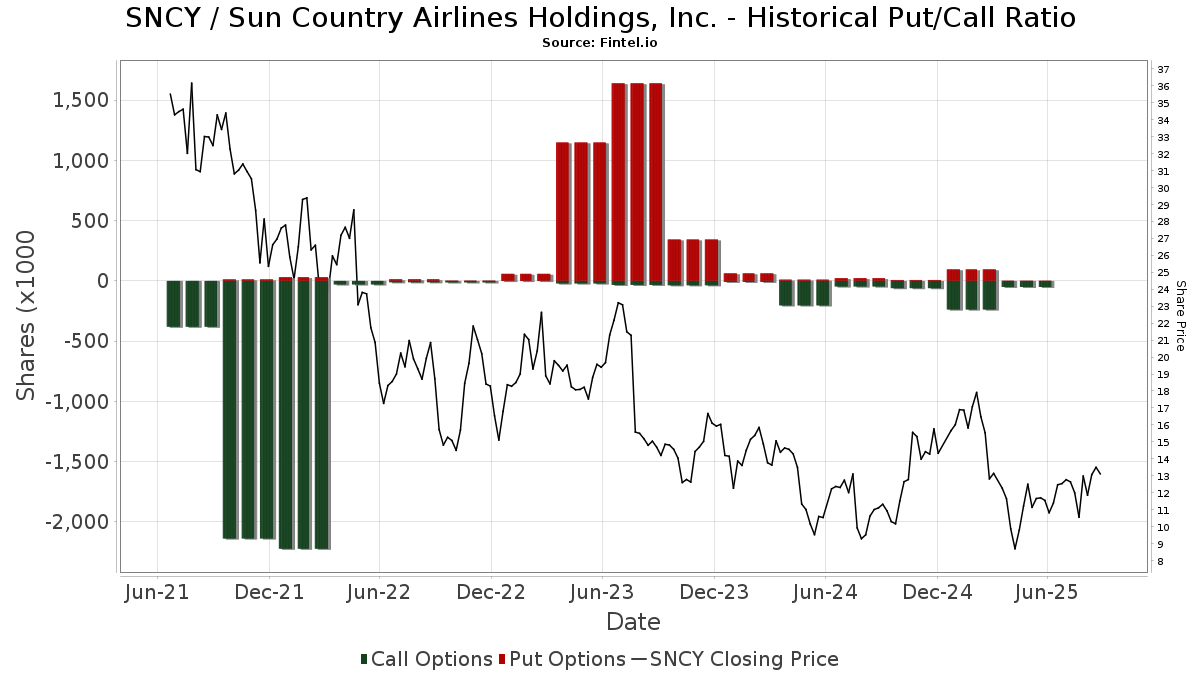
Ud over at indberette standardaktie- og gældsudstedelser skal institutter med mere end 100 mill. aktiver under forvaltning også oplyse deres put- og call-optionsbeholdninger. Da salgsoptioner generelt indikerer negativ stemning, og købsoptioner indikerer positiv stemning, kan vi få en fornemmelse af den overordnede institutionelle stemning ved at plotte forholdet mellem put og kald. Diagrammet til højre viser det historiske put/call-forhold for dette instrument.
Brug af Put/Call Ratio som en indikator for investorernes stemning overvinder en af de vigtigste mangler ved at bruge totalt institutionelt ejerskab, som er, at en betydelig mængde af aktiver under forvaltning investeres passivt for at spore indekser. Passivt forvaltede fonde køber typisk ikke optioner, så indikatoren for put/call-forholdet følger mere nøje følelsen af aktivt forvaltede fonde.
13D/G-arkivering
Vi præsenterer 13D/G ansøgninger separat fra 13F ansøgninger på grund af den forskellige behandling af SEC. 13D/G-ansøgninger kan indgives af grupper af investorer (med én ledende), hvorimod 13F-ansøgninger ikke kan. Dette resulterer i situationer, hvor en investor kan indsende en 13D/G, der rapporterer én værdi for de samlede aktier (der repræsenterer alle de aktier, der ejes af investorgruppen), men derefter indsender en 13F, der rapporterer en anden værdi for de samlede aktier (der udelukkende repræsenterer deres egne) ejendomsret). Det betyder, at aktieejerskab af 13D/G-arkiver og 13F-arkiveringer ofte ikke er direkte sammenlignelige, så vi præsenterer dem separat.
Bemærk: Fra den 16. maj 2021 viser vi ikke længere ejere, der ikke har indsendt en 13D/G inden for det seneste år. Tidligere viste vi den fulde historie af 13D/G-arkiver. Generelt skal enheder, der er forpligtet til at indgive 13D/G-ansøgninger, indgive mindst årligt, før de indsender en afsluttende ansøgning. Dog forlader fonde nogle gange positioner uden at indsende en afsluttende ansøgning (dvs. de afvikler), så visning af den fulde historie resulterede nogle gange i forvirring om det nuværende ejerskab. For at undgå forvirring viser vi nu kun 'aktuelle' ejere - det vil sige - ejere, der har anmeldt inden for det seneste år.
Upgrade to unlock premium data.
| Fil dato | Form | Investor | Forrige Aktier |
Seneste Aktier |
Δ Aktier (Procent) |
Ejendomsret (Procent) |
Δ Ejerskab (Procent) |
|
|---|---|---|---|---|---|---|---|---|
| 2026-02-17 | CITADEL ADVISORS LLC | 3,196,914 | 2,685,993 | -15.98 | 5.10 | -16.39 | ||
| 2026-02-17 | AMERIPRISE FINANCIAL INC | 2,637,036 | 2,621,812 | -0.58 | 5.00 | 2.04 | ||
| 2026-01-21 | DIMENSIONAL FUND ADVISORS LP | 2,685,524 | 5.10 | |||||
| 2025-10-17 | BlackRock, Inc. | 5,912,034 | 7,414,746 | 25.42 | 13.90 | 25.23 | ||
| 2025-08-14 | FRONTIER CAPITAL MANAGEMENT CO LLC | 3,533,617 | 6.64 | |||||
| 2025-08-14 | Zimmer Partners, LP | 2,773,031 | 2,225,900 | -19.73 | 4.20 | -19.23 | ||
| 2025-05-15 | MACQUARIE GROUP LTD | 3,062,024 | 2,549,308 | -16.74 | 4.87 | -16.03 |
13F og NPORT arkivering
Detaljer om 13F-arkivering er gratis. Detaljer om NP-ansøgninger kræver et premium-medlemskab. Grønne rækker angiver nye positioner. Røde rækker angiver lukkede positioner. Klik på linket ikon for at se den fulde transaktionshistorik.
Opgrader
for at låse premium-data op og eksportere til Excel ![]() .
.
| Fil dato | Kilde | Investor | Type | Gennemsnitlig pris (Øst) |
Aktier | Δ Aktier (%) |
Rapporteret Værdi ($1000) |
Δ Værdi (%) |
Port Alloc (%) |
|
|---|---|---|---|---|---|---|---|---|---|---|
| 2026-02-17 | 13F | MIRAE ASSET GLOBAL ETFS HOLDINGS Ltd. | 23.764 | -1,16 | 342 | 20,49 | ||||
| 2026-02-06 | 13F | Larson Financial Group LLC | 216 | 300,00 | 3 | |||||
| 2026-02-13 | 13F | Thomist Capital Management, LP | 555.935 | 1.864,43 | 8.002 | 2.267,16 | ||||
| 2026-02-18 | 13F | GWM Advisors LLC | 0 | -100,00 | 0 | |||||
| 2026-02-17 | 13F | Susquehanna Fundamental Investments, Llc | 26.206 | 377 | ||||||
| 2025-11-14 | 13F | Centiva Capital, LP | 0 | -100,00 | 0 | |||||
| 2025-09-29 | NP | SUNAMERICA SERIES TRUST - SA Small Cap Index Portfolio Class 1 | 5.817 | 29,55 | 67 | 52,27 | ||||
| 2026-02-05 | 13F | Allworth Financial LP | 668 | 56,81 | 10 | 80,00 | ||||
| 2026-02-02 | 13F | Fifth Third Bancorp | 422 | 9,04 | 6 | 50,00 | ||||
| 2026-02-18 | 13F | EP Wealth Advisors, Inc. | 11.993 | -10,25 | 173 | 9,55 | ||||
| 2026-02-09 | 13F | Hartland & Co., LLC | 0 | -100,00 | 0 | |||||
| 2026-02-10 | 13F | Globeflex Capital L P | 7.500 | 0,00 | 108 | 21,59 | ||||
| 2026-02-17 | 13F | Empyrean Capital Partners, LP | 640.000 | -12,57 | 9.210 | 6,52 | ||||
| 2026-02-04 | 13F | Bailard, Inc. | 30.100 | 433 | ||||||
| 2026-02-13 | 13F | Victory Capital Management Inc | 322.507 | -0,47 | 4.641 | 21,28 | ||||
| 2026-02-17 | 13F | Gotham Asset Management, LLC | 128.571 | -35,81 | 1.850 | -21,78 | ||||
| 2026-02-20 | 13F | Sunbelt Securities, Inc. | 138 | 0,00 | 2 | 0,00 | ||||
| 2026-02-13 | 13F | Prudential Financial Inc | 177.676 | -6,25 | 2.557 | 14,21 | ||||
| 2026-02-17 | 13F | J. Goldman & Co LP | 75.435 | 1.086 | ||||||
| 2026-02-17 | 13F | Algert Global Llc | 320.553 | 38,01 | 5 | 100,00 | ||||
| 2026-02-09 | 13F | Atlantic Trust, LLC | 0 | -100,00 | 0 | |||||
| 2026-02-17 | 13F | Canada Pension Plan Investment Board | 20.500 | 295 | ||||||
| 2026-01-09 | 13F | Assenagon Asset Management S.A. | 66.311 | -56,40 | 954 | -46,88 | ||||
| 2026-01-22 | 13F | Brookwood Investment Group LLC | 11.707 | 168 | ||||||
| 2026-02-13 | 13F | Charles Schwab Investment Management Inc | 819.740 | 5,71 | 11.796 | 28,82 | ||||
| 2026-02-13 | 13F | Wells Fargo & Company/mn | 60.062 | 34,23 | 864 | 63,64 | ||||
| 2025-11-06 | 13F | ProShare Advisors LLC | 0 | -100,00 | 0 | |||||
| 2026-01-23 | 13F | State of Alaska, Department of Revenue | 48.413 | 61,27 | 1 | |||||
| 2026-01-15 | 13F | Nisa Investment Advisors, Llc | 4.891 | 2,02 | 70 | 25,00 | ||||
| 2026-02-13 | 13F | First Trust Advisors Lp | 188.310 | 9,03 | 2.710 | 32,86 | ||||
| 2026-02-11 | 13F | O'shaughnessy Asset Management, Llc | 273.066 | 29,80 | 3.929 | 58,17 | ||||
| 2026-02-17 | 13F | Qube Research & Technologies Ltd | 174.295 | -72,17 | 2.508 | -66,09 | ||||
| 2026-02-11 | 13F | Empowered Funds, LLC | 182.010 | -30,56 | 2.619 | -15,38 | ||||
| 2026-02-13 | 13F | Arrowstreet Capital, Limited Partnership | 1.212.639 | -3,83 | 17.450 | 17,18 | ||||
| 2026-02-04 | 13F | Oregon Public Employees Retirement Fund | 12.104 | 0,75 | 174 | 23,40 | ||||
| 2026-02-11 | 13F | Primecap Management Co/ca/ | 142.915 | -0,14 | 2.057 | 21,66 | ||||
| 2026-02-17 | 13F | Zimmer Partners, LP | 1.051.408 | -49,84 | 15.130 | -38,88 | ||||
| 2025-11-14 | 13F | Cubist Systematic Strategies, LLC | 0 | -100,00 | 0 | -100,00 | ||||
| 2026-02-03 | 13F | SummerHaven Investment Management, LLC | 63.294 | 0,00 | 911 | 21,82 | ||||
| 2026-02-11 | 13F | Gilpin Wealth Management, Llc | 4 | 0 | ||||||
| 2026-02-17 | 13F | Apollo Management Holdings, L.P. | 0 | -100,00 | 0 | |||||
| 2026-02-05 | 13F | Td Private Client Wealth Llc | 52 | 0,00 | 1 | |||||
| 2025-11-13 | 13F | Dynamic Technology Lab Private Ltd | 0 | -100,00 | 0 | |||||
| 2026-02-11 | 13F | Illinois Municipal Retirement Fund | 26.741 | 27,44 | 385 | 55,47 | ||||
| 2026-02-03 | 13F | Farmers & Merchants Investments Inc | 25 | 0,00 | 0 | |||||
| 2026-02-17 | 13F | Balyasny Asset Management Llc | 43.300 | -39,21 | 623 | -25,92 | ||||
| 2025-09-29 | NP | PRFZ - Invesco FTSE RAFI US 1500 Small-Mid ETF This fund is a listed as child fund of Invesco Ltd. and if that institution has disclosed ownership in this security, then these positions will not be double counted when calculating total shares and total value | 68.419 | 58,02 | 793 | 86,79 | ||||
| 2025-11-14 | 13F | Petrus Trust Company, LTA | 0 | -100,00 | 0 | |||||
| 2026-01-20 | 13F | Harbor Capital Advisors, Inc. | 358 | -1,65 | 0 | |||||
| 2026-02-17 | 13F | Engineers Gate Manager LP | 0 | -100,00 | 0 | |||||
| 2026-02-17 | 13F | Citadel Advisors Llc | Put | 39.600 | 186,96 | 570 | 251,23 | |||
| 2026-02-17 | 13F | Citadel Advisors Llc | Call | 44.000 | -42,71 | 633 | -30,21 | |||
| 2026-01-23 | 13F | Assetmark, Inc | 233 | 0,00 | 3 | 50,00 | ||||
| 2026-02-09 | 13F | Geode Capital Management, Llc | 1.265.704 | 1,18 | 18.218 | 23,29 | ||||
| 2026-02-06 | 13F | Lsv Asset Management | 1.150.278 | -0,85 | 17 | 23,08 | ||||
| 2026-02-17 | 13F | Sherbrooke Park Advisers Llc | 0 | -100,00 | 0 | |||||
| 2026-01-29 | 13F | Teachers Retirement System Of The State Of Kentucky | 10.059 | 0,00 | 0 | |||||
| 2026-02-05 | 13F | Dana Investment Advisors, Inc. | 685.504 | -0,13 | 9.864 | 21,69 | ||||
| 2025-10-20 | 13F | Merit Financial Group, LLC | 0 | -100,00 | 0 | |||||
| 2026-02-13 | 13F | Boston Partners | 173.138 | -10,78 | 2.491 | 8,73 | ||||
| 2026-02-10 | 13F | Quantbot Technologies LP | 0 | -100,00 | 0 | |||||
| 2026-02-12 | 13F | Wealthspire Advisors, LLC | 0 | -100,00 | 0 | |||||
| 2026-01-28 | 13F | Universal- Beteiligungs- und Servicegesellschaft mbH | 188.000 | 0,00 | 2.705 | 21,85 | ||||
| 2026-02-17 | 13F | Tower Research Capital LLC (TRC) | 5.284 | 4,41 | 76 | 28,81 | ||||
| 2026-02-05 | 13F | Amalgamated Bank | 15.272 | 1,29 | 0 | |||||
| 2026-02-17 | 13F | Lighthouse Investment Partners, LLC | 0 | -100,00 | 0 | |||||
| 2026-02-13 | 13F | Public Sector Pension Investment Board | 0 | -100,00 | 0 | |||||
| 2026-02-12 | 13F | Campbell & CO Investment Adviser LLC | 0 | -100,00 | 0 | |||||
| 2026-02-06 | 13F | Pnc Financial Services Group, Inc. | 2.420 | -2,18 | 35 | 17,24 | ||||
| 2026-02-09 | 13F | Royce & Associates Lp | 118.141 | 28,83 | 1.700 | 57,12 | ||||
| 2026-02-17 | 13F | Citadel Advisors Llc | 2.641.992 | -8,48 | 38.018 | 11,51 | ||||
| 2026-02-17 | 13F | Aqr Capital Management Llc | 430.243 | -17,27 | 6.191 | 0,80 | ||||
| 2026-02-11 | 13F | Franklin Resources Inc | 121.498 | -3,62 | 1.748 | 17,47 | ||||
| 2026-02-13 | 13F | Barclays Plc | 81.128 | -40,14 | 1.167 | -27,06 | ||||
| 2026-01-23 | 13F | Farther Finance Advisors, LLC | 2.650 | 14,13 | 38 | 40,74 | ||||
| 2025-09-29 | NP | CRSSX - CATHOLIC RESPONSIBLE INVESTMENTS SMALL-CAP FUND Institutional Shares | 16.799 | 2,17 | 195 | 20,50 | ||||
| 2026-01-16 | 13F | Louisiana State Employees Retirement System | 24.100 | -1,63 | 347 | 19,72 | ||||
| 2026-02-10 | 13F | Savant Capital, LLC | 0 | -100,00 | 0 | |||||
| 2026-02-17 | 13F | Hancock Whitney Corp | 40.173 | -3,99 | 578 | 17,00 | ||||
| 2026-02-03 | 13F | Privium Fund Management (UK) Ltd | 33.024 | 475 | ||||||
| 2026-02-02 | 13F | Principal Financial Group Inc | 401.854 | 14,67 | 5.783 | 39,73 | ||||
| 2026-02-06 | 13F | IFP Advisors, Inc | 6 | -95,62 | 0 | -100,00 | ||||
| 2026-02-17 | 13F | Par Capital Management Inc | Put | 18.000 | 259 | |||||
| 2026-02-17 | 13F | Aquatic Capital Management LLC | 0 | -100,00 | 0 | |||||
| 2026-02-17 | 13F | Par Capital Management Inc | 2.000.000 | -3,24 | 28.780 | 17,90 | ||||
| 2026-02-17 | 13F | Fmr Llc | 283.621 | -6,95 | 4.081 | 13,39 | ||||
| 2026-02-13 | 13F | Umb Bank N A/mo | 313 | 126,81 | 5 | 300,00 | ||||
| 2026-02-13 | 13F | Bridgewater Associates, LP | 713.667 | -17,16 | 10.270 | 0,93 | ||||
| 2026-02-17 | 13F | Optiver Holding B.V. | 202 | -66,56 | 3 | -71,43 | ||||
| 2026-02-17 | 13F | Mercer Global Advisors Inc /adv | 14.399 | 207 | ||||||
| 2025-11-14 | 13F | Mount Yale Investment Advisors, LLC | 0 | -100,00 | 0 | -100,00 | ||||
| 2026-02-13 | 13F | Hudson Bay Capital Management LP | 0 | -100,00 | 0 | |||||
| 2026-02-17 | 13F | Hotchkis & Wiley Capital Management Llc | 293.149 | 1,35 | 4.218 | 23,48 | ||||
| 2026-02-17 | 13F | Russell Investments Group, Ltd. | 382.368 | 17,44 | 5.502 | 43,09 | ||||
| 2026-03-16 | 13F/A | Rockefeller Capital Management L.P. | 3.532 | -6,73 | 51 | 13,64 | ||||
| 2026-02-11 | 13F | Deutsche Bank Ag\ | 35.219 | 17,24 | 507 | 42,94 | ||||
| 2026-02-17 | 13F | Raymond James Financial Inc | 46.840 | 26,94 | 674 | 54,94 | ||||
| 2025-09-29 | NP | CFSLX - Column Small Cap Fund | 5.857 | 0,00 | 78 | 14,93 | ||||
| 2026-02-17 | 13F | Aster Capital Management (DIFC) Ltd | 385 | 6 | ||||||
| 2026-02-10 | 13F | Intech Investment Management Llc | 14.730 | -15,71 | 212 | 2,43 | ||||
| 2026-02-13 | 13F | Manufacturers Life Insurance Company, The | 0 | -100,00 | 0 | |||||
| 2026-02-12 | 13F | Ankerstar Wealth, LLC | 10 | 0 | ||||||
| 2026-01-05 | 13F | GAMMA Investing LLC | 5.109 | 7,88 | 74 | 32,73 | ||||
| 2025-11-07 | 13F | Gsa Capital Partners Llp | 0 | -100,00 | 0 | |||||
| 2026-02-11 | 13F | Winton Capital Group Ltd | 99.195 | -6,26 | 1.427 | 14,25 | ||||
| 2026-02-02 | 13F | Strs Ohio | 0 | -100,00 | 0 | |||||
| 2025-11-14 | 13F | Jain Global LLC | 0 | -100,00 | 0 | |||||
| 2026-02-17 | 13F | Guggenheim Capital Llc | 22.151 | 319 | ||||||
| 2025-11-12 | 13F | Group One Trading, L.p. | 0 | -100,00 | 0 | |||||
| 2025-11-14 | 13F | Brevan Howard Capital Management LP | 0 | -100,00 | 0 | |||||
| 2026-02-09 | 13F | Quest Partners LLC | 3.222 | 14,05 | 46 | 39,39 | ||||
| 2026-02-17 | 13F | SummitTX Capital, L.P. | 875.650 | 180,64 | 12.601 | 242,02 | ||||
| 2026-02-17 | 13F | California State Teachers Retirement System | 3.151 | -1,41 | 45 | 21,62 | ||||
| 2026-02-17 | 13F | Royal Bank Of Canada | 2.912 | -97,69 | 42 | -97,18 | ||||
| 2025-09-29 | NP | RZV - Invesco S&P SmallCap 600 Pure Value ETF This fund is a listed as child fund of Invesco Ltd. and if that institution has disclosed ownership in this security, then these positions will not be double counted when calculating total shares and total value | 63.018 | -4,00 | 730 | 13,53 | ||||
| 2025-11-06 | 13F | Versor Investments LP | 0 | -100,00 | 0 | |||||
| 2026-02-06 | 13F | HighTower Advisors, LLC | 12.755 | -0,23 | 184 | 22,00 | ||||
| 2026-02-17 | 13F | Bank Of America Corp /de/ | 294.124 | -19,35 | 4.232 | -1,72 | ||||
| 2025-11-12 | 13F | Simplex Trading, Llc | 0 | -100,00 | 0 | |||||
| 2026-01-29 | 13F | Vanguard Group Inc | 4.565.031 | -5,25 | 65.691 | 15,45 | ||||
| 2026-02-05 | 13F | Thrivent Financial For Lutherans | 36.223 | -5,83 | 1 | |||||
| 2025-11-14 | 13F | ISAM Funds (UK) Ltd | 0 | -100,00 | 0 | |||||
| 2025-09-29 | NP | MSSCX - AMG Frontier Small Cap Growth Fund Class I | 85.057 | -16,09 | 986 | -0,81 | ||||
| 2026-02-09 | 13F | Huntington National Bank | 0 | -100,00 | 0 | |||||
| 2026-02-03 | 13F | SBI Securities Co., Ltd. | 0 | -100,00 | 0 | |||||
| 2026-02-12 | 13F | Quadrant Capital Group Llc | 869 | 18,55 | 13 | 50,00 | ||||
| 2025-09-29 | NP | CALF - Pacer US Small Cap Cash Cows 100 ETF | 388.298 | -13,17 | 4.500 | 2,69 | ||||
| 2026-02-13 | 13F | Verition Fund Management LLC | 63.526 | -2,18 | 914 | 19,32 | ||||
| 2026-02-17 | 13F | Price T Rowe Associates Inc /md/ | 1.587.181 | 32,30 | 23 | 57,14 | ||||
| 2025-09-29 | NP | TPOR - Direxion Daily Transportation Bull 3X Shares | 764 | 50,39 | 9 | 100,00 | ||||
| 2026-01-29 | 13F | Comerica Bank | 211.136 | -24,03 | 3.038 | -7,43 | ||||
| 2026-02-17 | 13F | Watershed Asset Management, L.L.C. | 30.237 | 435 | ||||||
| 2026-02-09 | 13F | Prospera Financial Services Inc | 27.325 | -5,30 | 393 | 15,59 | ||||
| 2026-01-30 | 13F | New York State Teachers Retirement System | 17.977 | 0,46 | 0 | |||||
| 2026-02-10 | 13F | Commonwealth Of Pennsylvania Public School Empls Retrmt Sys | 13.050 | -3,89 | 188 | 16,88 | ||||
| 2026-02-10 | 13F | Acadian Asset Management Llc | 3.141 | -97,85 | 0 | -100,00 | ||||
| 2026-01-20 | 13F | Signaturefd, Llc | 225 | 4,17 | 3 | 50,00 | ||||
| 2026-02-12 | 13F | CIBC Private Wealth Group, LLC | 16.460 | 0,07 | 237 | 21,65 | ||||
| 2026-02-17 | 13F | Advisor Group Holdings, Inc. | 995 | 45,89 | 14 | 75,00 | ||||
| 2026-02-12 | 13F | State Board Of Administration Of Florida Retirement System | 10.760 | 0,00 | 155 | 21,26 | ||||
| 2026-02-13 | 13F | Blueshift Asset Management, LLC | 0 | -100,00 | 0 | |||||
| 2026-02-17 | 13F | Millennium Management Llc | 0 | -100,00 | 0 | |||||
| 2026-02-10 | 13F | Bank of New York Mellon Corp | 1.155.679 | -6,37 | 16.630 | 14,08 | ||||
| 2026-02-10 | 13F | Goldman Sachs Group Inc | 1.178.305 | 59,39 | 16.956 | 94,22 | ||||
| 2026-02-18 | 13F | State of Tennessee, Treasury Department | 19.571 | -23,81 | 343 | 13,20 | ||||
| 2025-11-14 | 13F | Point72 (DIFC) Ltd | 0 | -100,00 | 0 | -100,00 | ||||
| 2026-02-17 | 13F | Bridgeway Capital Management Inc | 471.810 | -27,40 | 6.789 | -11,54 | ||||
| 2026-02-06 | 13F | EverSource Wealth Advisors, LLC | 1.261 | -2,85 | 18 | 20,00 | ||||
| 2026-02-17 | 13F | Tcw Group Inc | 558.825 | 8.041 | ||||||
| 2026-02-13 | 13F | MAI Capital Management | 95 | 0,00 | 1 | 0,00 | ||||
| 2026-02-17 | 13F | Frontier Capital Management Co Llc | 3.287.513 | -1,29 | 47.307 | 20,28 | ||||
| 2026-02-13 | 13F | Martingale Asset Management L P | 90.649 | 4,86 | 1.304 | 27,84 | ||||
| 2026-02-12 | 13F | MetLife Investment Management, LLC | 31.359 | 0,00 | 451 | 21,89 | ||||
| 2025-10-29 | 13F | Maryland State Retirement & Pension System | 0 | -100,00 | 0 | |||||
| 2026-01-08 | 13F | Versant Capital Management, Inc | 4.164 | 12,91 | 60 | 37,21 | ||||
| 2026-01-28 | 13F | Financial Perspectives, Inc | 10 | 0,00 | 0 | |||||
| 2026-01-08 | 13F | True Wealth Design, LLC | 109 | -16,15 | 2 | 0,00 | ||||
| 2026-01-14 | 13F | Baron Wealth Management LLC | 13.117 | 189 | ||||||
| 2026-02-05 | 13F | Bessemer Group Inc | 216.854 | 102.674,41 | 3 | |||||
| 2026-01-28 | 13F | DekaBank Deutsche Girozentrale | 4.451 | 0,00 | 0 | |||||
| 2025-11-07 | 13F | Readystate Asset Management Lp | 0 | -100,00 | 0 | |||||
| 2026-02-18 | 13F | Mackenzie Financial Corp | 14.217 | 0,00 | 204 | 22,16 | ||||
| 2026-02-13 | 13F | State Street Corp | 2.023.372 | 7,21 | 29.116 | 30,63 | ||||
| 2026-02-13 | 13F | Quarry LP | 84 | -80,51 | 1 | -80,00 | ||||
| 2026-01-21 | 13F | Sound Income Strategies, LLC | 418 | 7 | ||||||
| 2026-01-15 | 13F | Fortitude Family Office, LLC | 0 | -100,00 | 0 | |||||
| 2026-01-28 | 13F | U S Global Investors Inc | 1.611.228 | -11,87 | 23.186 | 7,38 | ||||
| 2026-02-13 | 13F | Ieq Capital, Llc | 0 | -100,00 | 0 | |||||
| 2026-02-17 | 13F | Two Sigma Advisers, Lp | 75.400 | 238,12 | 1.085 | 312,55 | ||||
| 2025-11-14 | 13F | Oxford Asset Management Llp | 0 | -100,00 | 0 | -100,00 | ||||
| 2026-02-12 | 13F | Skopos Labs, Inc. | 30.768 | 0,60 | 442 | 22,44 | ||||
| 2026-01-14 | 13F | Exchange Traded Concepts, Llc | 97.282 | 4,64 | 1.400 | 27,53 | ||||
| 2026-02-17 | 13F | Ameriprise Financial Inc | 2.621.812 | -0,58 | 37.728 | 21,14 | ||||
| 2025-11-14 | 13F | Texas Permanent School Fund | 0 | -100,00 | 0 | |||||
| 2026-02-13 | 13F | Smartleaf Asset Management LLC | 210 | 0,48 | 3 | 50,00 | ||||
| 2026-02-11 | 13F | Parallel Advisors, LLC | 81 | 1 | ||||||
| 2026-03-09 | 13F | EMC Capital Management | 7.415 | -15,00 | 0 | |||||
| 2026-02-02 | 13F | Horizon Investments, LLC | 42.446 | 0,55 | 611 | 22,49 | ||||
| 2026-02-12 | 13F | Renaissance Technologies Llc | 121.800 | -38,24 | 1.753 | -24,74 | ||||
| 2026-01-28 | 13F | Salomon & Ludwin, LLC | 336 | -16,00 | 5 | 25,00 | ||||
| 2025-11-13 | 13F | FIL Ltd | 0 | -100,00 | 0 | |||||
| 2026-02-10 | 13F | Rothschild Investment Llc | 120 | 0,00 | 2 | 0,00 | ||||
| 2026-01-29 | 13F | UBS Group AG | 335.482 | -58,00 | 4.828 | -48,83 | ||||
| 2026-02-17 | 13F | Susquehanna International Group, Llp | 128.678 | 357,16 | 1.852 | 457,53 | ||||
| 2025-11-06 | 13F | Ameritas Advisory Services, LLC | 0 | -100,00 | 0 | -100,00 | ||||
| 2026-02-06 | 13F | Global Retirement Partners, LLC | 92 | 0,00 | 1 | 0,00 | ||||
| 2026-02-13 | 13F | Peak6 Llc | Call | 17.600 | 19,73 | 253 | 46,24 | |||
| 2026-02-11 | 13F | Ameritas Investment Partners, Inc. | 4.275 | 62 | ||||||
| 2026-02-13 | 13F | Citigroup Inc | 12.606 | -30,72 | 181 | -15,42 | ||||
| 2026-01-29 | 13F | UMA Financial Services, Inc. | 200 | 88,68 | 3 | 100,00 | ||||
| 2026-02-11 | 13F | Cedar Mountain Advisors, LLC | 55 | 14,58 | 1 | |||||
| 2026-02-13 | 13F | Sei Investments Co | 17.998 | 11,28 | 259 | 35,08 | ||||
| 2026-02-10 | 13F | Bnp Paribas Arbitrage, Sa | 11.574 | -92,03 | 167 | -90,32 | ||||
| 2026-02-13 | 13F | Parkside Financial Bank & Trust | 109 | 0,00 | 2 | 0,00 | ||||
| 2026-02-12 | 13F | Nuveen, LLC | 623.623 | 537,66 | 8.974 | 676,88 | ||||
| 2025-09-29 | NP | RSSL - Global X Russell 2000 ETF | 26.051 | 9,88 | 302 | 29,74 | ||||
| 2026-02-04 | 13F | Valeo Financial Advisors, LLC | 0 | -100,00 | 0 | |||||
| 2025-09-29 | NP | KCXIX - Knights of Columbus U.S. All Cap Index Fund I Shares | 60 | 7,14 | 1 | |||||
| 2026-02-11 | 13F | Jpmorgan Chase & Co | 128.758 | 501,42 | 1.853 | 634,92 | ||||
| 2026-02-05 | 13F | Northwestern Mutual Wealth Management Co | 500 | 267,65 | 2 | 0,00 | ||||
| 2025-12-01 | 13F/A | Polar Asset Management Partners Inc. | 0 | -100,00 | 0 | -100,00 | ||||
| 2026-02-06 | 13F | FourThought Financial Partners, LLC | 20.577 | -29,10 | 296 | -13,45 | ||||
| 2026-02-04 | 13F | Dogwood Wealth Management LLC | 488 | 269,70 | 7 | 600,00 | ||||
| 2026-01-21 | 13F | Yousif Capital Management, Llc | 13.981 | -13,97 | 244 | 27,75 | ||||
| 2026-01-08 | 13F | Wealth Enhancement Advisory Services, Llc | 13.095 | -1,57 | 201 | 34,00 | ||||
| 2026-02-13 | 13F | Segall Bryant & Hamill, Llc | 35.598 | -0,76 | 512 | 21,04 | ||||
| 2026-02-13 | 13F | Y-Intercept (Hong Kong) Ltd | 0 | -100,00 | 0 | |||||
| 2026-02-12 | 13F | BlackRock, Inc. | 7.741.906 | 1,14 | 111.406 | 23,24 | ||||
| 2026-02-13 | 13F | SRS Capital Advisors, Inc. | 213 | -98,35 | 3 | -98,03 | ||||
| 2026-02-12 | 13F | Federated Hermes, Inc. | 93.551 | -67,00 | 1.346 | -59,78 | ||||
| 2026-02-17 | 13F | Boothbay Fund Management, Llc | 0 | -100,00 | 0 | |||||
| 2025-11-13 | 13F | Schroder Investment Management Group | 0 | -100,00 | 0 | |||||
| 2026-01-16 | 13F | Empirical Financial Services, LLC d.b.a. Empirical Wealth Management | 0 | -100,00 | 0 | |||||
| 2026-02-12 | 13F | Voya Investment Management Llc | 51.935 | 20,13 | 747 | 46,47 | ||||
| 2026-02-17 | 13F | Susquehanna International Group, Llp | Call | 0 | -100,00 | 0 | ||||
| 2025-11-12 | 13F | CIBC Bancorp USA Inc. | 21.902 | 259 | ||||||
| 2026-02-13 | 13F | American Century Companies Inc | 2.095.258 | 5,34 | 30.151 | 28,35 | ||||
| 2026-02-13 | 13F | Pinnacle Wealth Planning Services, Inc. | 1.014 | 15 | ||||||
| 2026-02-12 | 13F | Dimensional Fund Advisors Lp | 2.685.524 | 6,41 | 38.645 | 29,66 | ||||
| 2026-02-13 | 13F | Marshall Wace, Llp | 15.124 | 218 | ||||||
| 2026-02-13 | 13F | Police & Firemen's Retirement System of New Jersey | 13.374 | 0,00 | 192 | 22,29 | ||||
| 2026-02-12 | 13F | Jane Street Group, Llc | Call | 10.200 | -58,70 | 147 | -49,83 | |||
| 2025-11-14 | 13F | Squarepoint Ops LLC | 0 | -100,00 | 0 | |||||
| 2026-02-12 | 13F | Jane Street Group, Llc | 130.688 | 1.881 | ||||||
| 2026-02-17 | 13F | Quantinno Capital Management LP | 64.991 | 96,44 | 935 | 139,74 | ||||
| 2026-02-17 | 13F | State Of Wisconsin Investment Board | 102.228 | -29,22 | 1.471 | -13,72 | ||||
| 2026-02-17 | 13F | Summit Global Investments | 26.556 | -52,86 | 0 | |||||
| 2026-01-07 | 13F | Massmutual Trust Co Fsb/adv | 383 | -3,53 | 6 | 25,00 | ||||
| 2026-02-13 | 13F | Rhumbline Advisers | 150.267 | -6,39 | 2.162 | 14,09 | ||||
| 2025-11-13 | 13F | Macquarie Group Ltd | 0 | -100,00 | 0 | -100,00 | ||||
| 2025-09-29 | NP | POAGX - PRIMECAP Odyssey Aggressive Growth Fund | 107.915 | 130,51 | 1.251 | 172,93 | ||||
| 2026-02-13 | 13F | Sterling Capital Management LLC | 1.461 | -8,29 | 21 | 16,67 | ||||
| 2026-02-13 | 13F | Walleye Capital LLC | 241.493 | 3.475 | ||||||
| 2026-02-04 | 13F | Pacer Advisors, Inc. | 0 | -100,00 | 0 | -100,00 | ||||
| 2026-02-09 | 13F | Annis Gardner Whiting Capital Advisors, LLC | 75 | 0,00 | 1 | |||||
| 2026-02-12 | 13F | New York State Common Retirement Fund | 12.161 | 0,00 | 175 | 21,68 | ||||
| 2026-02-17 | 13F | XTX Topco Ltd | 0 | -100,00 | 0 | -100,00 | ||||
| 2026-01-26 | 13F | Cwm, Llc | 22.933 | -16,98 | 0 | |||||
| 2026-02-17 | 13F | Northern Trust Corp | 586.276 | -5,13 | 8.437 | 15,59 | ||||
| 2026-02-17 | 13F | T. Rowe Price Investment Management, Inc. | 647.474 | -64,88 | 9 | -57,14 | ||||
| 2026-02-09 | 13F | Legal & General Group Plc | 83.750 | -3,90 | 1.205 | 17,10 | ||||
| 2026-02-13 | 13F | Walleye Capital LLC | Put | 3.100 | 45 | |||||
| 2026-02-17 | 13F | Jump Financial, LLC | 0 | -100,00 | 0 | |||||
| 2026-02-17 | 13F | Man Group plc | 45.464 | 25,93 | 654 | 53,52 | ||||
| 2025-11-13 | 13F | Jefferies Financial Group Inc. | 0 | -100,00 | 0 | |||||
| 2026-02-11 | 13F | Los Angeles Capital Management Llc | 33.404 | -35,30 | 376 | -38,26 | ||||
| 2026-02-17 | 13F | Alliancebernstein L.p. | 49.810 | -12,35 | 717 | 6,71 | ||||
| 2026-02-19 | 13F | Invesco Ltd. | 371.814 | 7,91 | 5.350 | 31,48 | ||||
| 2026-01-30 | 13F | Us Bancorp \de\ | 16.677 | 11,91 | 240 | 36,57 | ||||
| 2026-02-17 | 13F | Two Sigma Investments, Lp | 293.511 | 253,06 | 4.224 | 330,48 | ||||
| 2026-02-02 | 13F | VELA Investment Management, LLC | 239.179 | 14,20 | 3.442 | 39,14 | ||||
| 2026-02-06 | 13F | Covestor Ltd | 678 | 0,30 | 0 | |||||
| 2026-02-11 | 13F | Brandywine Global Investment Management, LLC | 0 | -100,00 | 0 | |||||
| 2026-02-12 | 13F | South Dakota Investment Council | 205.450 | -8,51 | 3 | 0,00 | ||||
| 2026-02-17 | 13F | D. E. Shaw & Co., Inc. | 506.287 | -17,89 | 7.285 | 0,04 | ||||
| 2026-02-13 | 13F | Meros Investment Management, LP | 79.844 | 1.149 | ||||||
| 2026-02-11 | 13F | Meeder Asset Management Inc | 9.883 | 0,00 | 142 | 22,41 | ||||
| 2026-02-17 | 13F | Creative Planning | 117.827 | 91,21 | 1.696 | 133,15 | ||||
| 2026-02-13 | 13F | Morgan Stanley | 619.081 | -26,95 | 8.909 | -10,99 | ||||
| 2026-02-17 | 13F | Point72 Asset Management, L.P. | 192.989 | -88,69 | 2.777 | -86,22 | ||||
| 2026-02-10 | 13F | State of Wyoming | 0 | -100,00 | 0 | |||||
| 2026-02-13 | 13F | Ubs Asset Management Americas Inc | 59 | 1 | ||||||
| 2026-02-11 | 13F | CSM Advisors, LLC | 567.512 | 11,93 | 8 | 60,00 | ||||
| 2026-01-09 | 13F | SG Americas Securities, LLC | 20.668 | 0 | ||||||
| 2026-02-09 | 13F | Hantz Financial Services, Inc. | 1.501 | 86,23 | 0 | |||||
| 2026-02-13 | 13F | Kilter Group LLC | 9 | 0 |
Other Listings
| DE:6X2 | 14,80 € |