Grundlæggende statistik
| Institutionelle ejere | 60 total, 60 long only, 0 short only, 0 long/short - change of 20,00% MRQ |
| Gennemsnitlig porteføljeallokering | 0.1318 % - change of -26,63% MRQ |
| Institutionelle aktier (lange) | 25.354.628 (ex 13D/G) - change of -0,09MM shares -0,34% MRQ |
| Institutionel værdi (lang) | $ 726.338 USD ($1000) |
Institutionelt ejerskab og aktionærer
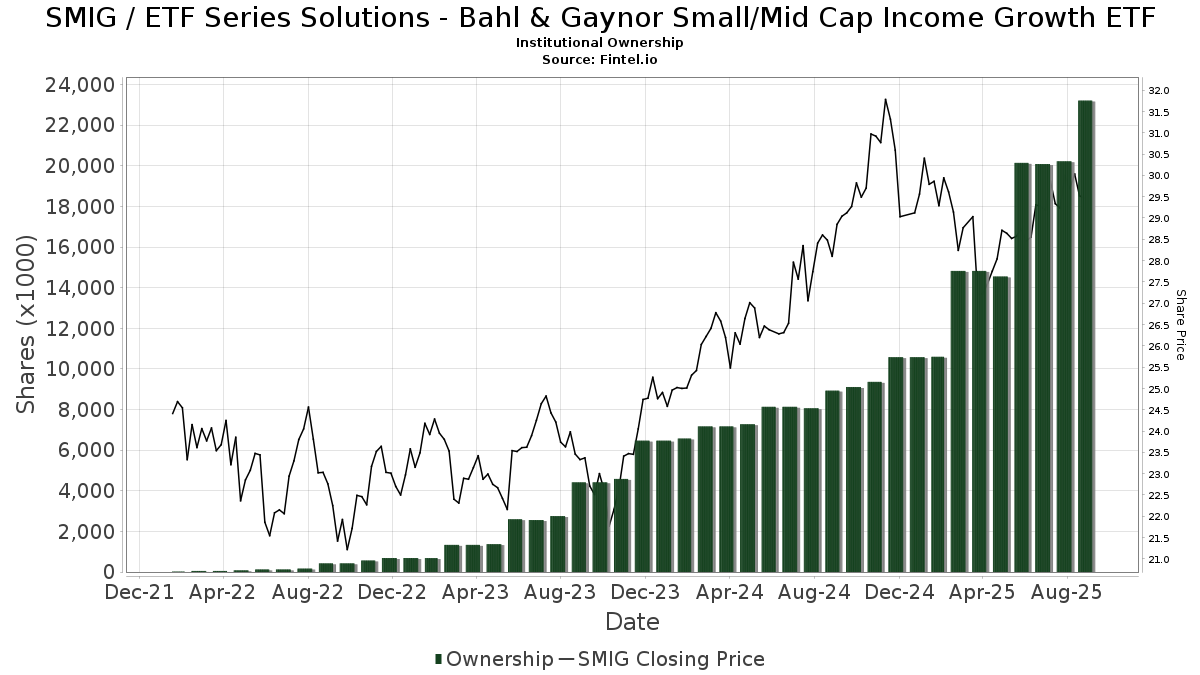
ETF Series Solutions - Bahl & Gaynor Small/Mid Cap Income Growth ETF (US:SMIG) har 60 institutionelle ejere og aktionærer, der har indsendt 13D/G- eller 13F-formularer til Securities Exchange Commission (SEC). Disse institutioner har i alt 25,354,628 aktier. Største aktionærer omfatter Bank Of America Corp /de/, Morgan Stanley, Royal Bank Of Canada, UBS Group AG, Raymond James Financial Inc, Wells Fargo & Company/mn, LPL Financial LLC, Pine Valley Investments Ltd Liability Co, Stifel Financial Corp, and Prime Capital Investment Advisors, LLC .
ETF Series Solutions - Bahl & Gaynor Small/Mid Cap Income Growth ETF (ARCA:SMIG) institutionel ejerskabsstruktur viser aktuelle positioner i virksomheden efter institutioner og fonde, samt seneste ændringer i positionsstørrelse. Større aktionærer kan omfatte individuelle investorer, investeringsforeninger, hedgefonde eller institutioner. Skema 13D angiver, at investoren besidder (eller besidder) mere end 5 % af virksomheden og har til hensigt (eller har til hensigt at) aktivt at forfølge en ændring i forretningsstrategi. Skema 13G indikerer en passiv investering på over 5%.
The share price as of April 2, 2026 is 29,38 / share. Previously, on April 4, 2025, the share price was 26,37 / share. This represents an increase of 11,41% over that period.
Fondens stemningsscore
Fund Sentiment Score (fka Ownership Accumulation Score) finder de aktier, der bliver mest købt af fonde. Det er resultatet af en sofistikeret, multi-faktor kvantitativ model, der identificerer virksomheder med de højeste niveauer af institutionel akkumulering. Scoringsmodellen bruger en kombination af den samlede stigning i oplyste ejere, ændringerne i porteføljeallokeringer i disse ejere og andre målinger. Tallet går fra 0 til 100, hvor højere tal indikerer et højere niveau af akkumulering for sine jævnaldrende, og 50 er gennemsnittet.
Opdateringsfrekvens: Dagligt
Se Ownership Explorer, som giver en liste over højest rangerende virksomheder.
AI+ Ask Fintel’s AI assistant about ETF Series Solutions - Bahl & Gaynor Small/Mid Cap Income Growth ETF.
Select a question to share a public post with an AI-crafted answer.
Thinking of good questions…
Institutionel Put/Call-forhold
Ud over at indberette standardaktie- og gældsudstedelser skal institutter med mere end 100 mill. aktiver under forvaltning også oplyse deres put- og call-optionsbeholdninger. Da salgsoptioner generelt indikerer negativ stemning, og købsoptioner indikerer positiv stemning, kan vi få en fornemmelse af den overordnede institutionelle stemning ved at plotte forholdet mellem put og kald. Diagrammet til højre viser det historiske put/call-forhold for dette instrument.
Brug af Put/Call Ratio som en indikator for investorernes stemning overvinder en af de vigtigste mangler ved at bruge totalt institutionelt ejerskab, som er, at en betydelig mængde af aktiver under forvaltning investeres passivt for at spore indekser. Passivt forvaltede fonde køber typisk ikke optioner, så indikatoren for put/call-forholdet følger mere nøje følelsen af aktivt forvaltede fonde.
13F og NPORT arkivering
Detaljer om 13F-arkivering er gratis. Detaljer om NP-ansøgninger kræver et premium-medlemskab. Grønne rækker angiver nye positioner. Røde rækker angiver lukkede positioner. Klik på linket ikon for at se den fulde transaktionshistorik.
Opgrader
for at låse premium-data op og eksportere til Excel ![]() .
.
| Fil dato | Kilde | Investor | Type | Gennemsnitlig pris (Øst) |
Aktier | Δ Aktier (%) |
Rapporteret Værdi ($1000) |
Δ Værdi (%) |
Port Alloc (%) |
|
|---|---|---|---|---|---|---|---|---|---|---|
| 2026-02-14 | 13F | Rockefeller Capital Management L.P. | 122.169 | 17,47 | 3.518 | 14,22 | ||||
| 2025-11-06 | 13F | Abich Financial Wealth Management LLC | 69 | 2 | ||||||
| 2026-01-14 | 13F | EdgeRock Capital LLC | 29.996 | -1,66 | 864 | -4,43 | ||||
| 2026-01-29 | 13F | Kestra Private Wealth Services, Llc | 68.639 | 2,47 | 1.977 | -0,40 | ||||
| 2026-02-13 | 13F | MAI Capital Management | 2.956 | 85 | ||||||
| 2026-02-17 | 13F | Warren Averett Asset Management, LLC | 86.853 | -4,44 | 2.501 | -7,10 | ||||
| 2026-02-10 | 13F | Weaver Consulting Group | 9.550 | 0,00 | 275 | -2,48 | ||||
| 2026-02-17 | 13F | Equitable Holdings, Inc. | 123.728 | -4,49 | 3.563 | -7,14 | ||||
| 2026-01-30 | 13F | Us Bancorp \de\ | 305.578 | 1,86 | 8.801 | -0,97 | ||||
| 2026-02-17 | 13F | Signature Equity Partners, LLC | 223 | 6 | ||||||
| 2026-02-05 | 13F | Atria Investments Llc | 37.989 | 1.094 | ||||||
| 2026-02-17 | 13F | Two Sigma Investments, Lp | 70.600 | 2.033 | ||||||
| 2026-02-13 | 13F | Wealth Dimensions Group, Ltd. | 41.775 | 0,00 | 1.203 | -2,75 | ||||
| 2026-01-16 | 13F | Ronald Blue Trust, Inc. | 1.677 | 0,00 | 48 | -2,04 | ||||
| 2026-01-22 | 13F | Castle Wealth Management Llc | 216.559 | -0,28 | 6.245 | -3,06 | ||||
| 2026-02-17 | 13F | Bank Of America Corp /de/ | 9.533.185 | -1,19 | 274.556 | -3,92 | ||||
| 2026-01-29 | 13F | Comerica Bank | 34.915 | -2,67 | 1.006 | -5,37 | ||||
| 2026-01-23 | 13F | U.S. Capital Wealth Advisors, LLC | 0 | -100,00 | 0 | |||||
| 2026-02-13 | 13F | Stifel Financial Corp | 329.976 | 2,57 | 9.503 | -0,26 | ||||
| 2026-02-06 | 13F | Vestmark Advisory Solutions, Inc. | 42.183 | 1.215 | ||||||
| 2026-02-17 | 13F | Susquehanna International Group, Llp | 13.809 | 398 | ||||||
| 2026-02-17 | 13F | Cetera Investment Advisers | 159.887 | 13,81 | 4.605 | 10,65 | ||||
| 2026-02-13 | 13F | Pine Valley Investments Ltd Liability Co | 348.299 | -1,36 | 10.041 | -4,10 | ||||
| 2026-02-17 | 13F | Raymond James Financial Inc | 624.109 | -14,87 | 17.974 | -17,22 | ||||
| 2026-02-17 | 13F | Wiley Bros.-aintree Capital, Llc | 20.604 | -37,38 | 593 | -39,12 | ||||
| 2026-01-14 | 13F | Wealthcare Advisory Partners LLC | 54.371 | -1,43 | 1.566 | -4,16 | ||||
| 2026-02-13 | 13F | Mml Investors Services, Llc | 20.150 | -47,79 | 580 | -49,26 | ||||
| 2026-02-06 | 13F | IFP Advisors, Inc | 33 | 1 | ||||||
| 2026-02-17 | 13F | Qube Research & Technologies Ltd | 1.341 | 702,99 | 39 | 850,00 | ||||
| 2026-01-13 | 13F | Argentarii, LLC | 8.058 | 2,22 | 232 | -0,43 | ||||
| 2026-02-05 | 13F | ORBA Wealth Advisors, L.L.C. | 7.075 | -31,68 | 204 | -33,66 | ||||
| 2026-02-17 | 13F | Gotham Asset Management, LLC | 170.000 | 0,00 | 4.896 | -2,76 | ||||
| 2026-02-17 | 13F | Integrity Wealth Advisors, Inc. | 0 | -100,00 | 0 | |||||
| 2026-01-29 | 13F | Sanctuary Advisors, LLC | 183.714 | 5,13 | 5.291 | 2,22 | ||||
| 2026-02-11 | 13F | Parallel Advisors, LLC | 950 | 27 | ||||||
| 2025-11-12 | 13F | BlackRock, Inc. | 0 | -100,00 | 0 | |||||
| 2026-02-05 | 13F | Cambridge Investment Research Advisors, Inc. | 118.118 | -2,00 | 3 | 0,00 | ||||
| 2026-02-13 | 13F | Baird Financial Group, Inc. | 25.507 | 4,76 | 735 | 1,80 | ||||
| 2026-01-30 | 13F | Joseph Group Capital Management | 198.931 | 5,11 | 5.729 | 2,19 | ||||
| 2026-02-13 | 13F | Arkadios Wealth Advisors | 7.555 | 218 | ||||||
| 2026-02-12 | 13F | Commonwealth Equity Services, Llc | 0 | -100,00 | 0 | |||||
| 2026-02-11 | 13F | LPL Financial LLC | 442.766 | 2,74 | 12.752 | -0,11 | ||||
| 2026-02-11 | 13F | Nemes Rush Group LLC | 116 | -49,34 | 3 | -50,00 | ||||
| 2026-02-11 | 13F | O'shaughnessy Asset Management, Llc | 0 | -100,00 | 0 | |||||
| 2026-02-12 | 13F | Jane Street Group, Llc | 0 | -100,00 | 0 | -100,00 | ||||
| 2026-01-12 | 13F | PUREfi Wealth, LLC | 13.000 | 0,00 | 374 | -2,86 | ||||
| 2026-02-17 | 13F | Advisor Group Holdings, Inc. | 1.691 | -67,40 | 49 | -68,63 | ||||
| 2026-01-26 | 13F | Heritage Wealth Management, Inc. | 85.820 | 0,00 | 2.472 | -2,75 | ||||
| 2026-02-13 | 13F | Cornerstone Financial Management LLC | 2.800 | 81 | ||||||
| 2026-02-12 | 13F | Mount Yale Investment Advisors, LLC | 42.183 | -13,40 | 1.217 | -15,85 | ||||
| 2026-02-17 | 13F | Royal Bank Of Canada | 2.365.873 | 2,38 | 68.137 | -0,45 | ||||
| 2026-01-23 | 13F | Farther Finance Advisors, LLC | 812 | 23 | ||||||
| 2026-01-23 | 13F | Transcend Wealth Collective, Llc | 46.460 | 1.338 | ||||||
| 2026-02-02 | 13F | Fifth Third Bancorp | 186.512 | 0,81 | 5.372 | -1,99 | ||||
| 2025-11-14 | 13F | Kestra Advisory Services, LLC | 0 | -100,00 | 0 | |||||
| 2026-02-11 | 13F | Janney Montgomery Scott LLC | 16.317 | 19,44 | 0 | |||||
| 2025-11-10 | 13F | Cowa, Llc | 0 | -100,00 | 0 | |||||
| 2026-02-10 | 13F | Envestnet Asset Management Inc | 123.783 | -5,31 | 3.565 | -7,93 | ||||
| 2026-02-13 | 13F | Morgan Stanley | 6.033.636 | -2,22 | 173.769 | -4,93 | ||||
| 2025-10-24 | 13F | We Are One Seven, LLC | 0 | -100,00 | 0 | |||||
| 2025-11-12 | 13F | Blair William & Co/il | 0 | -100,00 | 0 | |||||
| 2026-02-02 | 13F | Truist Financial Corp | 242.634 | -1,41 | 6.988 | -4,14 | ||||
| 2026-02-13 | 13F | Wells Fargo & Company/mn | 478.124 | 19,07 | 13.770 | 15,77 | ||||
| 2026-02-18 | 13F | Wealth Intelligence, LLC | 79.570 | 2.292 | ||||||
| 2026-01-26 | 13F | PFG Investments, LLC | 12.335 | 24,42 | 355 | 21,16 | ||||
| 2026-01-08 | 13F | Financial Management Network Inc | 0 | -100,00 | 0 | |||||
| 2025-10-22 | 13F | Gladstone Institutional Advisory LLC | 0 | -100,00 | 0 | |||||
| 2026-02-11 | 13F | Jpmorgan Chase & Co | 152.832 | 4,19 | 4.402 | 1,31 | ||||
| 2026-02-17 | 13F | D. E. Shaw & Co., Inc. | 16.122 | 464 | ||||||
| 2026-01-20 | 13F | Stratos Wealth Partners, LTD. | 7.327 | 0,00 | 211 | -2,76 | ||||
| 2025-11-12 | 13F | Creative Financial Designs Inc /adv | 0 | -100,00 | 0 | |||||
| 2025-11-14 | 13F | Skopos Labs, Inc. | 0 | -100,00 | 0 | |||||
| 2026-01-21 | 13F | Prime Capital Investment Advisors, LLC | 319.621 | 0,87 | 9.205 | -1,92 | ||||
| 2026-01-29 | 13F | UBS Group AG | 1.663.163 | -14,32 | 47.899 | -16,70 |