Grundlæggende statistik
| Institutionelle aktier (lange) | 64.999.256 - 36,87% (ex 13D/G) - change of -20,48MM shares -23,95% MRQ |
| Institutionel værdi (lang) | $ 90.628 USD ($1000) |
Institutionelt ejerskab og aktionærer
SelectQuote, Inc. (US:SLQT) har 160 institutionelle ejere og aktionærer, der har indsendt 13D/G- eller 13F-formularer til Securities Exchange Commission (SEC). Disse institutioner har i alt 64,999,256 aktier. Største aktionærer omfatter BlackRock, Inc., Vanguard Group Inc, Mariner, LLC, Geode Capital Management, Llc, State Street Corp, Occam Crest Management LP, Captrust Financial Advisors, Dimensional Fund Advisors Lp, Millennium Management Llc, and Diametric Capital, LP .
SelectQuote, Inc. (NYSE:SLQT) institutionel ejerskabsstruktur viser aktuelle positioner i virksomheden efter institutioner og fonde, samt seneste ændringer i positionsstørrelse. Større aktionærer kan omfatte individuelle investorer, investeringsforeninger, hedgefonde eller institutioner. Skema 13D angiver, at investoren besidder (eller besidder) mere end 5 % af virksomheden og har til hensigt (eller har til hensigt at) aktivt at forfølge en ændring i forretningsstrategi. Skema 13G indikerer en passiv investering på over 5%.
The share price as of April 21, 2026 is 0,77 / share. Previously, on April 22, 2025, the share price was 3,08 / share. This represents a decline of 75,14% over that period.

Fondens stemningsscore
Fund Sentiment Score (fka Ownership Accumulation Score) finder de aktier, der bliver mest købt af fonde. Det er resultatet af en sofistikeret, multi-faktor kvantitativ model, der identificerer virksomheder med de højeste niveauer af institutionel akkumulering. Scoringsmodellen bruger en kombination af den samlede stigning i oplyste ejere, ændringerne i porteføljeallokeringer i disse ejere og andre målinger. Tallet går fra 0 til 100, hvor højere tal indikerer et højere niveau af akkumulering for sine jævnaldrende, og 50 er gennemsnittet.
Opdateringsfrekvens: Dagligt
Se Ownership Explorer, som giver en liste over højest rangerende virksomheder.
AI+ Ask Fintel’s AI assistant about SelectQuote, Inc..
Select a question to share a public post with an AI-crafted answer.
Thinking of good questions…
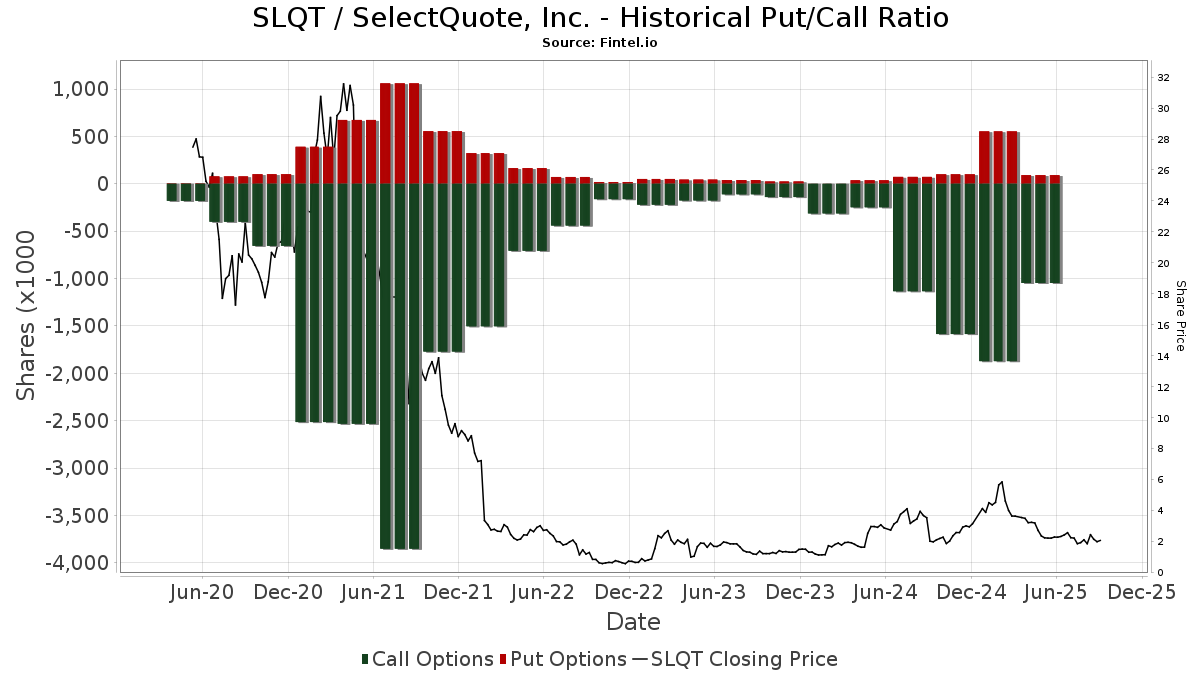
Institutionel Put/Call-forhold
Ud over at indberette standardaktie- og gældsudstedelser skal institutter med mere end 100 mill. aktiver under forvaltning også oplyse deres put- og call-optionsbeholdninger. Da salgsoptioner generelt indikerer negativ stemning, og købsoptioner indikerer positiv stemning, kan vi få en fornemmelse af den overordnede institutionelle stemning ved at plotte forholdet mellem put og kald. Diagrammet til højre viser det historiske put/call-forhold for dette instrument.
Brug af Put/Call Ratio som en indikator for investorernes stemning overvinder en af de vigtigste mangler ved at bruge totalt institutionelt ejerskab, som er, at en betydelig mængde af aktiver under forvaltning investeres passivt for at spore indekser. Passivt forvaltede fonde køber typisk ikke optioner, så indikatoren for put/call-forholdet følger mere nøje følelsen af aktivt forvaltede fonde.
13D/G-arkivering
Vi præsenterer 13D/G ansøgninger separat fra 13F ansøgninger på grund af den forskellige behandling af SEC. 13D/G-ansøgninger kan indgives af grupper af investorer (med én ledende), hvorimod 13F-ansøgninger ikke kan. Dette resulterer i situationer, hvor en investor kan indsende en 13D/G, der rapporterer én værdi for de samlede aktier (der repræsenterer alle de aktier, der ejes af investorgruppen), men derefter indsender en 13F, der rapporterer en anden værdi for de samlede aktier (der udelukkende repræsenterer deres egne) ejendomsret). Det betyder, at aktieejerskab af 13D/G-arkiver og 13F-arkiveringer ofte ikke er direkte sammenlignelige, så vi præsenterer dem separat.
Bemærk: Fra den 16. maj 2021 viser vi ikke længere ejere, der ikke har indsendt en 13D/G inden for det seneste år. Tidligere viste vi den fulde historie af 13D/G-arkiver. Generelt skal enheder, der er forpligtet til at indgive 13D/G-ansøgninger, indgive mindst årligt, før de indsender en afsluttende ansøgning. Dog forlader fonde nogle gange positioner uden at indsende en afsluttende ansøgning (dvs. de afvikler), så visning af den fulde historie resulterede nogle gange i forvirring om det nuværende ejerskab. For at undgå forvirring viser vi nu kun 'aktuelle' ejere - det vil sige - ejere, der har anmeldt inden for det seneste år.
Upgrade to unlock premium data.
| Fil dato | Form | Investor | Forrige Aktier |
Seneste Aktier |
Δ Aktier (Procent) |
Ejendomsret (Procent) |
Δ Ejerskab (Procent) |
|
|---|---|---|---|---|---|---|---|---|
| 2026-02-13 | MORGAN STANLEY | 10,134,048 | 8,982,943 | -11.36 | 4.99 | -10.89 |
13F og NPORT arkivering
Detaljer om 13F-arkivering er gratis. Detaljer om NP-ansøgninger kræver et premium-medlemskab. Grønne rækker angiver nye positioner. Røde rækker angiver lukkede positioner. Klik på linket ikon for at se den fulde transaktionshistorik.
Opgrader
for at låse premium-data op og eksportere til Excel ![]() .
.
| Fil dato | Kilde | Investor | Type | Gennemsnitlig pris (Øst) |
Aktier | Δ Aktier (%) |
Rapporteret Værdi ($1000) |
Δ Værdi (%) |
Port Alloc (%) |
|
|---|---|---|---|---|---|---|---|---|---|---|
| 2026-04-10 | 13F | Financial Partners Group, Inc | 56.504 | 9,71 | 36 | -52,05 | ||||
| 2026-02-12 | 13F | Renaissance Technologies Llc | 111.300 | -45,89 | 157 | -61,29 | ||||
| 2025-11-18 | 13F | Pictet Asset Management Holding SA | 0 | -100,00 | 0 | -100,00 | ||||
| 2026-02-13 | 13F | Mariner, LLC | 6.359.335 | -0,17 | 8.967 | -28,19 | ||||
| 2026-02-12 | 13F | Jane Street Group, Llc | Call | 48.700 | 266,17 | 69 | 161,54 | |||
| 2026-02-12 | 13F | Jane Street Group, Llc | 384.740 | -11,68 | 542 | -36,46 | ||||
| 2026-02-17 | 13F | SageView Advisory Group, LLC | 1.800 | 3 | ||||||
| 2026-02-09 | 13F | Hartland & Co., LLC | 16 | -97,40 | 0 | -100,00 | ||||
| 2025-11-03 | 13F | Federated Hermes, Inc. | 0 | -100,00 | 0 | |||||
| 2026-02-17 | 13F | Public Employees Retirement System Of Ohio | 36.268 | 0,00 | 51 | -28,17 | ||||
| 2025-11-14 | 13F | G2 Investment Partners Management LLC | 0 | -100,00 | 0 | |||||
| 2026-02-17 | 13F | Blair William & Co/il | 55.000 | -3,70 | 78 | -30,63 | ||||
| 2026-02-13 | 13F | Healthcare Of Ontario Pension Plan Trust Fund | 0 | -100,00 | 0 | -100,00 | ||||
| 2026-02-17 | 13F | Susquehanna International Group, Llp | 139.700 | 56,01 | 197 | 12,00 | ||||
| 2026-02-13 | 13F | Police & Firemen's Retirement System of New Jersey | 34.369 | 0,00 | 48 | -28,36 | ||||
| 2026-02-13 | 13F | Quinn Opportunity Partners LLC | 40.000 | 0,00 | 56 | -28,21 | ||||
| 2026-02-17 | 13F | Jones Financial Companies Lllp | 535 | -26,61 | 1 | -100,00 | ||||
| 2026-02-13 | 13F | Victory Capital Management Inc | 15.780 | 2,22 | 22 | -26,67 | ||||
| 2026-02-12 | 13F | Xponance, Inc. | 10.885 | 2,17 | 15 | -25,00 | ||||
| 2026-02-17 | 13F | Creative Planning | 170.119 | -19,90 | 240 | -42,55 | ||||
| 2026-01-29 | 13F | UBS Group AG | 217.777 | 133,24 | 307 | 67,76 | ||||
| 2025-11-14 | 13F | AXA Investment Managers S.A. | 346.494 | 679 | ||||||
| 2026-02-13 | 13F | Squarepoint Ops LLC | 0 | -100,00 | 0 | -100,00 | ||||
| 2026-02-10 | 13F | Bank of New York Mellon Corp | 384.904 | 0,48 | 543 | -27,73 | ||||
| 2026-02-13 | 13F | First National Bank Of Omaha | 17.500 | 24 | ||||||
| 2026-02-13 | 13F | Occam Crest Management LP | 2.088.465 | -17,17 | 2.945 | -40,42 | ||||
| 2026-02-17 | 13F | Fmr Llc | 720.042 | 19,69 | 1.015 | -13,91 | ||||
| 2026-02-17 | 13F | Caption Management, LLC | Call | 862.300 | 0,00 | 1.216 | -28,11 | |||
| 2026-02-17 | 13F | Advisor Group Holdings, Inc. | 43.518 | -11,97 | 61 | -38,38 | ||||
| 2025-11-17 | 13F | Caxton Associates Llp | 0 | -100,00 | 0 | -100,00 | ||||
| 2026-02-17 | 13F | Alliancebernstein L.p. | 145.146 | -79,84 | 205 | -85,53 | ||||
| 2025-11-14 | 13F | CI Private Wealth, LLC | 0 | -100,00 | 0 | |||||
| 2026-02-12 | 13F | Nuveen, LLC | 308.028 | 0,00 | 434 | -28,03 | ||||
| 2026-02-11 | 13F | Parallel Advisors, LLC | 600 | 0,00 | 1 | -100,00 | ||||
| 2026-04-15 | 13F | Nations Financial Group Inc, /ia/ /adv | 33.500 | 6,35 | 21 | -52,27 | ||||
| 2026-02-17 | 13F | Graham Capital Management, L.P. | 51.104 | -47,93 | 72 | -62,50 | ||||
| 2026-02-17 | 13F | Millennium Management Llc | 1.637.460 | 530,08 | 2.309 | 353,44 | ||||
| 2025-11-14 | 13F | State Of Wisconsin Investment Board | 0 | -100,00 | 0 | |||||
| 2026-02-13 | 13F | American Century Companies Inc | 724.180 | -57,02 | 1.021 | -69,08 | ||||
| 2026-02-12 | 13F | Dimensional Fund Advisors Lp | 2.024.358 | -12,08 | 2.854 | -36,78 | ||||
| 2026-02-06 | 13F | EverSource Wealth Advisors, LLC | 698 | -70,29 | 1 | -100,00 | ||||
| 2026-02-10 | 13F | Rothschild Investment Llc | 6 | -96,00 | 0 | |||||
| 2026-02-14 | 13F | Rockefeller Capital Management L.P. | 13.572 | 3,75 | 19 | -24,00 | ||||
| 2026-02-12 | 13F | Bank Of Montreal /can/ | 100.000 | 0,00 | 141 | -28,06 | ||||
| 2026-04-08 | 13F | Wealth Enhancement Advisory Services, Llc | 21.000 | 13 | ||||||
| 2026-02-10 | 13F | NINE MASTS CAPITAL Ltd | 16.714 | 24 | ||||||
| 2025-11-10 | 13F | Resources Investment Advisors, LLC. | 0 | -100,00 | 0 | |||||
| 2026-02-17 | 13F | Eversept Partners, LP | 357.661 | 504 | ||||||
| 2025-11-14 | 13F | Polymer Capital Management (US) LLC | 0 | -100,00 | 0 | |||||
| 2025-11-14 | 13F | Boothbay Fund Management, Llc | 0 | -100,00 | 0 | |||||
| 2026-02-17 | 13F | Prelude Capital Management, Llc | 234.344 | 25,55 | 330 | -9,59 | ||||
| 2025-11-03 | 13F | Arizona State Retirement System | 0 | -100,00 | 0 | |||||
| 2025-11-12 | 13F | Royce & Associates Lp | 0 | -100,00 | 0 | |||||
| 2026-04-16 | 13F | Kavar Capital Partners Group, Llc | 391.312 | 0,00 | 246 | -55,35 | ||||
| 2026-02-13 | 13F | State Street Corp | 2.970.373 | 0,24 | 4.188 | -27,89 | ||||
| 2026-02-17 | 13F | Aquatic Capital Management LLC | 48.315 | 224,17 | 68 | 134,48 | ||||
| 2025-11-14 | 13F | Cubist Systematic Strategies, LLC | 0 | -100,00 | 0 | |||||
| 2026-02-13 | 13F | Walleye Trading LLC | Call | 109.200 | 7,80 | 154 | -22,73 | |||
| 2026-02-11 | 13F | Simplex Trading, Llc | Call | 5.400 | 50,00 | 8 | ||||
| 2025-10-30 | 13F | Covestor Ltd | 0 | -100,00 | 0 | |||||
| 2026-02-13 | 13F | Prudential Financial Inc | 108.600 | -23,53 | 153 | -44,96 | ||||
| 2026-02-13 | 13F | Morgan Stanley | 944.197 | -24,24 | 1.331 | -45,50 | ||||
| 2026-02-10 | 13F | Goldman Sachs Group Inc | 519.620 | 4,94 | 733 | -24,54 | ||||
| 2026-02-04 | 13F | Wsfs Capital Management, Llc | 322.580 | 0,00 | 455 | -28,16 | ||||
| 2026-02-11 | 13F | Empowered Funds, LLC | 445.310 | 628 | ||||||
| 2026-02-13 | 13F | Arrowstreet Capital, Limited Partnership | 574.978 | -68,30 | 811 | -77,22 | ||||
| 2026-02-09 | 13F | Legal & General Group Plc | 13.478 | -5,03 | 19 | -29,63 | ||||
| 2025-10-23 | 13F | Klp Kapitalforvaltning As | 0 | -100,00 | 0 | |||||
| 2026-02-17 | 13F | Northern Trust Corp | 1.061.737 | -3,98 | 1.497 | -30,92 | ||||
| 2026-02-10 | 13F/A | Northwestern Mutual Wealth Management Co | 5.915 | 0,00 | 8 | -27,27 | ||||
| 2025-11-14 | 13F | Zurcher Kantonalbank (Zurich Cantonalbank) | 0 | -100,00 | 0 | |||||
| 2026-02-13 | 13F | Citigroup Inc | 3.478 | -71,88 | 5 | -83,33 | ||||
| 2026-02-19 | 13F | Invesco Ltd. | 265.687 | 11,99 | 375 | -19,57 | ||||
| 2025-11-14 | 13F | Point72 (DIFC) Ltd | 6.070 | 2.164,93 | 12 | |||||
| 2026-02-09 | 13F | Northstar Financial Companies, Inc. | 0 | -100,00 | 0 | -100,00 | ||||
| 2026-02-26 | 13F/A | Aristides Capital LLC | 76.700 | 108 | ||||||
| 2026-02-17 | 13F | MIRAE ASSET GLOBAL ETFS HOLDINGS Ltd. | 65.388 | 1,29 | 92 | -26,98 | ||||
| 2026-04-20 | 13F | State of Alaska, Department of Revenue | 7.272 | 0,00 | 0 | |||||
| 2026-02-13 | 13F | Commerce Bank | 12.641 | -4,53 | 18 | -32,00 | ||||
| 2026-02-11 | 13F | Simplex Trading, Llc | Put | 100 | -98,67 | 0 | ||||
| 2026-02-12 | 13F | New York State Common Retirement Fund | 36.351 | 0,00 | 51 | -28,17 | ||||
| 2026-02-11 | 13F | Simplex Trading, Llc | 7.617 | -58,59 | 11 | |||||
| 2026-02-17 | 13F | Bank Of America Corp /de/ | 426.675 | -1,39 | 602 | -29,13 | ||||
| 2026-03-20 | 13F/A | Hsbc Holdings Plc | 12.887 | -54,09 | 18 | -66,67 | ||||
| 2026-02-12 | 13F | BlackRock, Inc. | 10.631.952 | 4,17 | 14.991 | -25,06 | ||||
| 2026-02-17 | 13F | Two Sigma Securities, Llc | 0 | -100,00 | 0 | -100,00 | ||||
| 2026-02-13 | 13F | Rhumbline Advisers | 169.846 | -13,22 | 239 | -37,60 | ||||
| 2026-02-09 | 13F | Kazazian Asset Management, LLC | 106.330 | 88,76 | 150 | 35,45 | ||||
| 2026-02-06 | 13F | Gsa Capital Partners Llp | 196.422 | 414,95 | 0 | |||||
| 2026-02-17 | 13F | Clear Street Markets Llc | 0 | -100,00 | 0 | |||||
| 2026-02-13 | 13F | Aigen Investment Management, Lp | 0 | -100,00 | 0 | -100,00 | ||||
| 2026-02-10 | 13F | Bnp Paribas Arbitrage, Sa | 172.916 | 154,13 | 244 | 82,71 | ||||
| 2026-02-10 | 13F | Axq Capital, Lp | 0 | -100,00 | 0 | -100,00 | ||||
| 2026-02-12 | 13F | Moneta Group Investment Advisors Llc | 78.485 | 0,00 | 111 | -28,10 | ||||
| 2026-02-13 | 13F | OMERS ADMINISTRATION Corp | 0 | -100,00 | 0 | -100,00 | ||||
| 2025-11-14 | 13F | Point72 Europe (London) LLP | 2.030 | 4 | ||||||
| 2026-02-17 | 13F | XTX Topco Ltd | 31.011 | 44 | ||||||
| 2025-11-12 | 13F | Us Bancorp \de\ | 0 | -100,00 | 0 | |||||
| 2026-02-17 | 13F | Susquehanna International Group, Llp | Call | 0 | -100,00 | 0 | ||||
| 2025-11-14 | 13F | Integrated Wealth Concepts LLC | 0 | -100,00 | 0 | |||||
| 2026-02-11 | 13F | Los Angeles Capital Management Llc | 394.478 | -19,93 | 813 | -15,85 | ||||
| 2026-02-17 | 13F | Royal Bank Of Canada | 29.932 | -4,15 | 43 | -29,51 | ||||
| 2026-04-15 | 13F | Atwood & Palmer Inc | 1.500 | 0,00 | 1 | -100,00 | ||||
| 2026-02-02 | 13F | Opes Wealth Management LLC | 59.520 | 0,00 | 84 | -28,45 | ||||
| 2026-02-10 | 13F | Connor, Clark & Lunn Investment Management Ltd. | 1.114.972 | -13,05 | 1.572 | -37,45 | ||||
| 2026-03-26 | 13F | Leonteq Securities AG | 0 | -100,00 | 0 | -100,00 | ||||
| 2026-02-06 | 13F | Pnc Financial Services Group, Inc. | 15 | 0 | ||||||
| 2026-02-18 | 13F | Financial Advisory Service, Inc. | 97.499 | 0,00 | 137 | -28,27 | ||||
| 2026-02-17 | 13F | Two Sigma Advisers, Lp | 0 | -100,00 | 0 | -100,00 | ||||
| 2026-01-23 | 13F | Avion Wealth | 1.512 | 0,00 | 0 | |||||
| 2026-01-29 | 13F | Vanguard Group Inc | 8.093.577 | -1,18 | 11.412 | -28,91 | ||||
| 2026-02-17 | 13F | Capstone Financial Advisors, Inc. | 10.000 | 14 | ||||||
| 2026-02-17 | 13F | IHT Wealth Management, LLC | 41.605 | -58,23 | 59 | -70,26 | ||||
| 2025-11-14 | 13F | Point72 Asia (Singapore) Pte. Ltd. | 11.681 | 142,65 | 23 | 100,00 | ||||
| 2025-11-14 | 13F | Susquehanna International Group, Llp | Put | 0 | -100,00 | 0 | -100,00 | |||
| 2026-02-13 | 13F | Sei Investments Co | 23.861 | 0,00 | 34 | -28,26 | ||||
| 2026-02-12 | 13F | CNO Financial Group, Inc. | 50.500 | 0,00 | 71 | -27,55 | ||||
| 2025-10-24 | 13F | New York State Teachers Retirement System | 0 | -100,00 | 0 | |||||
| 2026-02-11 | 13F | LPL Financial LLC | 41.650 | -19,48 | 59 | -42,57 | ||||
| 2026-02-17 | 13F | D. E. Shaw & Co., Inc. | 41.182 | -71,89 | 58 | -79,79 | ||||
| 2026-02-05 | 13F | Amalgamated Bank | 4.412 | -4,36 | 0 | |||||
| 2026-02-17 | 13F | Quadrature Capital Ltd | 0 | -100,00 | 0 | -100,00 | ||||
| 2026-01-26 | 13F | Cwm, Llc | 87.182 | -23,80 | 0 | |||||
| 2025-11-14 | 13F | Ubs Asset Management Americas Inc | 0 | -100,00 | 0 | |||||
| 2026-03-03 | 13F/A | Caitong International Asset Management Co., Ltd | 51.599 | 1.166,23 | 73 | 928,57 | ||||
| 2026-02-17 | 13F | Guggenheim Capital Llc | 1.201.211 | 0,00 | 1.694 | -28,08 | ||||
| 2026-04-16 | 13F | Capital Advisors, Ltd. LLC | 4 | -97,71 | 0 | |||||
| 2026-01-08 | 13F | PMV Capital Advisers, LLC | 0 | -100,00 | 0 | |||||
| 2026-02-11 | 13F | Group One Trading, L.p. | Put | 100 | -99,42 | 0 | -100,00 | |||
| 2026-02-11 | 13F | Group One Trading, L.p. | 21.140 | 30 | ||||||
| 2026-02-11 | 13F | Group One Trading, L.p. | Call | 25.300 | -77,79 | 36 | -84,30 | |||
| 2026-02-13 | 13F | Jacobs Levy Equity Management, Inc | 567.330 | -48,33 | 800 | -62,87 | ||||
| 2026-02-12 | 13F | Hrt Financial Lp | 0 | -100,00 | 0 | -100,00 | ||||
| 2025-11-14 | 13F | Walleye Trading LLC | Put | 0 | -100,00 | 0 | -100,00 | |||
| 2026-01-15 | 13F | Nisa Investment Advisors, Llc | 105 | 0,00 | 0 | |||||
| 2026-02-03 | 13F | SBI Securities Co., Ltd. | 1.004 | 0,10 | 1 | 0,00 | ||||
| 2026-02-06 | 13F | ProShare Advisors LLC | 25.583 | 8,85 | 36 | -21,74 | ||||
| 2026-02-12 | 13F | Cibc World Markets Corp | 0 | -100,00 | 0 | -100,00 | ||||
| 2025-11-21 | 13F/A | CIBC Bancorp USA Inc. | 14.651 | 29 | ||||||
| 2026-02-17 | 13F | Balyasny Asset Management Llc | 0 | -100,00 | 0 | |||||
| 2026-02-17 | 13F | Price T Rowe Associates Inc /md/ | 72.467 | 0,00 | 0 | |||||
| 2026-04-07 | 13F | Farther Finance Advisors, LLC | 827 | 176,59 | 0 | |||||
| 2026-04-16 | 13F | SG Americas Securities, LLC | 319.669 | -8,03 | 0 | |||||
| 2026-02-13 | 13F | Change Path, LLC | 43.678 | 0,00 | 62 | -28,24 | ||||
| 2026-01-26 | 13F | PFG Investments, LLC | 29.760 | 0,00 | 42 | -29,31 | ||||
| 2026-01-13 | 13F | Mayflower Financial Advisors, LLC | 28.480 | -35,58 | 40 | -53,49 | ||||
| 2026-02-11 | 13F | Jpmorgan Chase & Co | 1.143.427 | 36,07 | 1.612 | -2,13 | ||||
| 2026-02-17 | 13F | Engineers Gate Manager LP | 68.967 | -38,57 | 97 | -55,91 | ||||
| 2026-02-17 | 13F | Optiver Holding B.V. | 2.142 | 0,00 | 3 | -25,00 | ||||
| 2026-02-17 | 13F | Qube Research & Technologies Ltd | 379.620 | -28,09 | 535 | -48,26 | ||||
| 2026-02-13 | 13F | Umb Bank N A/mo | 200.000 | 0,00 | 282 | -28,06 | ||||
| 2026-02-13 | 13F | SRS Capital Advisors, Inc. | 0 | -100,00 | 0 | -100,00 | ||||
| 2026-02-17 | 13F | Voleon Capital Management Lp | 107.197 | 151 | ||||||
| 2026-02-02 | 13F | Kornitzer Capital Management Inc /ks | 15.000 | 0,00 | 21 | -27,59 | ||||
| 2026-01-15 | 13F | Fortitude Family Office, LLC | 0 | -100,00 | 0 | |||||
| 2026-02-10 | 13F | Intech Investment Management Llc | 55.775 | -10,15 | 79 | -35,54 | ||||
| 2026-02-05 | 13F | Allworth Financial LP | 362 | -56,12 | 1 | -100,00 | ||||
| 2026-02-13 | 13F | Manufacturers Life Insurance Company, The | 45.805 | -5,33 | 65 | -31,91 | ||||
| 2026-02-10 | 13F | Quantbot Technologies LP | 0 | -100,00 | 0 | -100,00 | ||||
| 2026-02-13 | 13F | Marshall Wace, Llp | 0 | -100,00 | 0 | -100,00 | ||||
| 2025-11-14 | 13F | Wolverine Trading, Llc | 17.967 | 4,02 | 36 | -7,69 | ||||
| 2025-11-14 | 13F | Wolverine Trading, Llc | Call | 41.000 | -52,87 | 82 | -59,00 | |||
| 2026-02-18 | 13F | Mackenzie Financial Corp | 22.028 | 0,00 | 31 | -30,23 | ||||
| 2026-02-12 | 13F | Steward Partners Investment Advisory, Llc | 30 | 0 | ||||||
| 2026-02-17 | 13F | Bridgeway Capital Management Inc | 841.292 | 1.186 | ||||||
| 2026-02-17 | 13F | Citadel Advisors Llc | Put | 16.600 | 43,10 | 23 | 4,55 | |||
| 2026-02-17 | 13F | Algert Global Llc | 0 | -100,00 | 0 | |||||
| 2026-02-11 | 13F | Franklin Resources Inc | 16.621 | -84,60 | 23 | -89,10 | ||||
| 2026-02-17 | 13F | Citadel Advisors Llc | 291.422 | -30,93 | 411 | -50,36 | ||||
| 2026-02-17 | 13F | Citadel Advisors Llc | Call | 13.300 | 19 | |||||
| 2026-02-09 | 13F | Koesten, Hirschmann & Crabtree, INC. | 0 | -100,00 | 0 | -100,00 | ||||
| 2026-02-17 | 13F | Tower Research Capital LLC (TRC) | 8.747 | 6,36 | 12 | -25,00 | ||||
| 2026-04-13 | 13F | IFP Advisors, Inc | 198 | 607,14 | 0 | |||||
| 2026-01-21 | 13F | Prime Capital Investment Advisors, LLC | 0 | -100,00 | 0 | -100,00 | ||||
| 2026-02-17 | 13F | Aqr Capital Management Llc | 285.649 | -52,94 | 403 | -66,19 | ||||
| 2025-11-17 | 13F | Great West Life Assurance Co /can/ | 0 | -100,00 | 0 | |||||
| 2026-02-10 | 13F | Acadian Asset Management Llc | 17.342 | 0 | ||||||
| 2026-02-12 | 13F | Quadrant Capital Group Llc | 0 | -100,00 | 0 | |||||
| 2025-11-14 | 13F | National Bank Of Canada /fi/ | 0 | -100,00 | 0 | |||||
| 2025-11-14 | 13F | Janus Henderson Group Plc | 0 | -100,00 | 0 | |||||
| 2026-04-22 | 13F | Sterling Capital Management LLC | 1.957 | -41,16 | 1 | -75,00 | ||||
| 2026-02-10 | 13F | State of Wyoming | 46.899 | 66 | ||||||
| 2025-11-12 | 13F | Globeflex Capital L P | 0 | -100,00 | 0 | |||||
| 2026-02-09 | 13F | GatePass Capital, LLC | 210.200 | 13,35 | 296 | -18,46 | ||||
| 2026-02-13 | 13F | Ieq Capital, Llc | 0 | -100,00 | 0 | -100,00 | ||||
| 2026-02-12 | 13F | Empower Advisory Group, LLC | 257.344 | 0,00 | 363 | -28,17 | ||||
| 2026-02-12 | 13F | Commonwealth Equity Services, Llc | 16.127 | 23 | ||||||
| 2026-02-13 | 13F | Diametric Capital, LP | 1.463.708 | 116,94 | 2.064 | 56,05 | ||||
| 2026-02-17 | 13F | California State Teachers Retirement System | 8.635 | 0,88 | 12 | -25,00 | ||||
| 2025-11-13 | 13F | Winton Capital Group Ltd | 0 | -100,00 | 0 | |||||
| 2026-02-09 | 13F | Geode Capital Management, Llc | 3.369.383 | 1,19 | 4.752 | -27,21 | ||||
| 2026-02-17 | 13F | Abrams Bison Investments, Llc | 0 | -100,00 | 0 | |||||
| 2026-04-14 | 13F | Nbc Securities, Inc. | 1.000 | 0,00 | 1 | -100,00 | ||||
| 2026-02-12 | 13F | StoneX Group Inc. | 12.060 | 17 | ||||||
| 2026-02-13 | 13F | Wells Fargo & Company/mn | 244.930 | 35,62 | 345 | -2,27 | ||||
| 2026-02-17 | 13F | Captrust Financial Advisors | 2.081.209 | 36,33 | 2.935 | -1,94 | ||||
| 2026-02-17 | 13F | Russell Investments Group, Ltd. | 68.390 | -46,97 | 96 | -61,90 | ||||
| 2026-02-02 | 13F | Principal Financial Group Inc | 0 | -100,00 | 0 | -100,00 | ||||
| 2026-02-17 | 13F | Advisory Services Network, LLC | 0 | -100,00 | 0 | |||||
| 2026-01-12 | 13F | Canvas Wealth Advisors, LLC | 15.000 | 0,00 | 21 | -32,26 | ||||
| 2026-04-20 | 13F | TFB Advisors LLC | 0 | -100,00 | 0 | |||||
| 2026-01-29 | 13F | Sanctuary Advisors, LLC | 0 | -100,00 | 0 | -100,00 | ||||
| 2025-11-14 | 13F | Atom Investors LP | 0 | -100,00 | 0 | |||||
| 2026-02-11 | 13F | Ameritas Investment Partners, Inc. | 12.128 | 17 | ||||||
| 2026-04-06 | 13F | IFS Advisors, LLC | 185 | 0,00 | 0 | |||||
| 2026-02-12 | 13F | EntryPoint Capital, LLC | 162.177 | 215,18 | 229 | 128,00 | ||||
| 2026-02-13 | 13F | Centiva Capital, LP | 53.144 | 75 | ||||||
| 2026-02-13 | 13F | Walleye Trading LLC | 0 | -100,00 | 0 | -100,00 | ||||
| 2025-11-13 | 13F | Swiss National Bank | 0 | -100,00 | 0 | |||||
| 2026-04-15 | 13F | Merit Financial Group, LLC | 10.605 | 7 | ||||||
| 2026-02-11 | 13F | Meeder Asset Management Inc | 6.434 | 66,73 | 9 | 28,57 | ||||
| 2026-02-12 | 13F | Voya Investment Management Llc | 25.256 | 0,00 | 36 | -28,57 | ||||
| 2026-02-13 | 13F | Charles Schwab Investment Management Inc | 1.115.671 | -11,25 | 1.573 | -36,13 | ||||
| 2026-04-13 | 13F | True Wealth Design, LLC | 477 | -44,34 | 0 | -100,00 | ||||
| 2025-10-30 | 13F | Teacher Retirement System Of Texas | 0 | -100,00 | 0 | |||||
| 2026-02-13 | 13F | Dynamic Technology Lab Private Ltd | 0 | -100,00 | 0 | -100,00 | ||||
| 2026-04-06 | 13F | GAMMA Investing LLC | 0 | -100,00 | 0 | -100,00 | ||||
| 2026-01-27 | 13F | TriaGen Wealth Management LLC | 1.055.500 | 0,00 | 1.488 | -28,05 | ||||
| 2026-02-12 | 13F | Skopos Labs, Inc. | 0 | -100,00 | 0 | -100,00 | ||||
| 2026-02-17 | 13F | Tudor Investment Corp Et Al | 981.279 | -5,16 | 1.384 | -31,77 | ||||
| 2026-04-13 | 13F | Plan Group Financial, LLC | 19.533 | 0,00 | 12 | -55,56 | ||||
| 2026-02-17 | 13F | Ameriprise Financial Inc | 61.463 | 0,00 | 87 | -28,33 | ||||
| 2026-02-12 | 13F | MetLife Investment Management, LLC | 27.330 | -58,48 | 39 | -70,54 | ||||
| 2026-01-28 | 13F | Hoey Investments, Inc | 0 | -100,00 | 0 | |||||
| 2026-04-10 | 13F | Smh Capital Advisors Inc | 0 | -100,00 | 0 | -100,00 | ||||
| 2026-02-13 | 13F | Panagora Asset Management Inc | 537.598 | -0,06 | 758 | -28,08 | ||||
| 2026-02-17 | 13F | Two Sigma Investments, Lp | 80.193 | -83,52 | 113 | -88,14 | ||||
| 2026-02-17 | 13F | Raymond James Financial Inc | 26.535 | 0,03 | 37 | -27,45 | ||||
| 2026-04-21 | 13F | GHP Investment Advisors, Inc. | 17.990 | 11 | ||||||
| 2026-02-11 | 13F | Deutsche Bank Ag\ | 105.570 | 6,75 | 149 | -23,32 | ||||
| 2026-02-13 | 13F | Barclays Plc | 252.725 | 9,01 | 356 | -21,59 | ||||
| 2026-02-17 | 13F | Brevan Howard Capital Management LP | 27.953 | 39 | ||||||
| 2026-02-18 | 13F | GWM Advisors LLC | 896 | 0,00 | 1 | 0,00 | ||||
| 2026-02-17 | 13F | Bayesian Capital Management, LP | 0 | -100,00 | 0 | |||||
| 2025-11-14 | 13F | Verition Fund Management LLC | 0 | -100,00 | 0 |
Other Listings
| DE:6SJA | 0,63 € |