Grundlæggende statistik
| Institutionelle aktier (lange) | 63.174.320 - 114,24% (ex 13D/G) - change of -15,79MM shares -19,99% MRQ |
| Institutionel værdi (lang) | $ 5.115.542 USD ($1000) |
Institutionelt ejerskab og aktionærer
Champion Homes, Inc. (US:SKY) har 352 institutionelle ejere og aktionærer, der har indsendt 13D/G- eller 13F-formularer til Securities Exchange Commission (SEC). Disse institutioner har i alt 63,174,320 aktier. Største aktionærer omfatter BlackRock, Inc., Vanguard Group Inc, Wellington Management Group Llp, Wasatch Advisors Inc, State Street Corp, Mak Capital One Llc, Capital Research Global Investors, Dimensional Fund Advisors Lp, Fmr Llc, and Mak Capital One Llc .
Champion Homes, Inc. (NYSE:SKY) institutionel ejerskabsstruktur viser aktuelle positioner i virksomheden efter institutioner og fonde, samt seneste ændringer i positionsstørrelse. Større aktionærer kan omfatte individuelle investorer, investeringsforeninger, hedgefonde eller institutioner. Skema 13D angiver, at investoren besidder (eller besidder) mere end 5 % af virksomheden og har til hensigt (eller har til hensigt at) aktivt at forfølge en ændring i forretningsstrategi. Skema 13G indikerer en passiv investering på over 5%.
The share price as of April 24, 2026 is 82,00 / share. Previously, on April 28, 2025, the share price was 84,23 / share. This represents a decline of 2,65% over that period.

Fondens stemningsscore
Fund Sentiment Score (fka Ownership Accumulation Score) finder de aktier, der bliver mest købt af fonde. Det er resultatet af en sofistikeret, multi-faktor kvantitativ model, der identificerer virksomheder med de højeste niveauer af institutionel akkumulering. Scoringsmodellen bruger en kombination af den samlede stigning i oplyste ejere, ændringerne i porteføljeallokeringer i disse ejere og andre målinger. Tallet går fra 0 til 100, hvor højere tal indikerer et højere niveau af akkumulering for sine jævnaldrende, og 50 er gennemsnittet.
Opdateringsfrekvens: Dagligt
Se Ownership Explorer, som giver en liste over højest rangerende virksomheder.
AI+ Ask Fintel’s AI assistant about Champion Homes, Inc..
Select a question to share a public post with an AI-crafted answer.
Thinking of good questions…
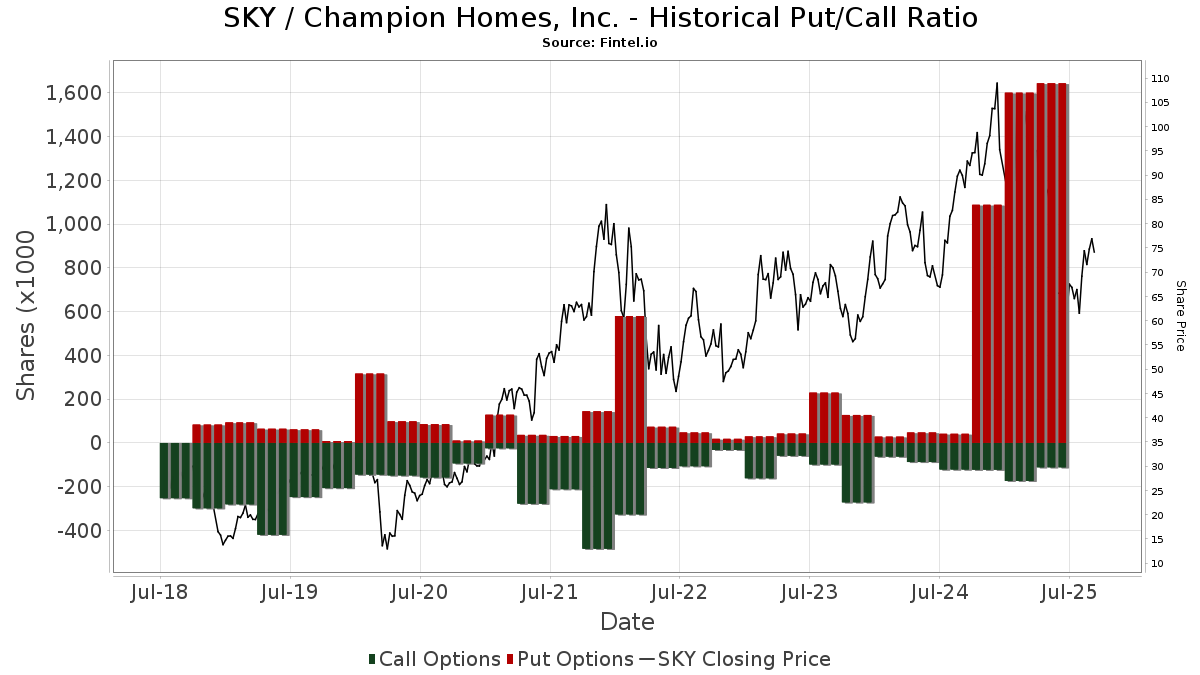
Institutionel Put/Call-forhold
Ud over at indberette standardaktie- og gældsudstedelser skal institutter med mere end 100 mill. aktiver under forvaltning også oplyse deres put- og call-optionsbeholdninger. Da salgsoptioner generelt indikerer negativ stemning, og købsoptioner indikerer positiv stemning, kan vi få en fornemmelse af den overordnede institutionelle stemning ved at plotte forholdet mellem put og kald. Diagrammet til højre viser det historiske put/call-forhold for dette instrument.
Brug af Put/Call Ratio som en indikator for investorernes stemning overvinder en af de vigtigste mangler ved at bruge totalt institutionelt ejerskab, som er, at en betydelig mængde af aktiver under forvaltning investeres passivt for at spore indekser. Passivt forvaltede fonde køber typisk ikke optioner, så indikatoren for put/call-forholdet følger mere nøje følelsen af aktivt forvaltede fonde.
13D/G-arkivering
Vi præsenterer 13D/G ansøgninger separat fra 13F ansøgninger på grund af den forskellige behandling af SEC. 13D/G-ansøgninger kan indgives af grupper af investorer (med én ledende), hvorimod 13F-ansøgninger ikke kan. Dette resulterer i situationer, hvor en investor kan indsende en 13D/G, der rapporterer én værdi for de samlede aktier (der repræsenterer alle de aktier, der ejes af investorgruppen), men derefter indsender en 13F, der rapporterer en anden værdi for de samlede aktier (der udelukkende repræsenterer deres egne) ejendomsret). Det betyder, at aktieejerskab af 13D/G-arkiver og 13F-arkiveringer ofte ikke er direkte sammenlignelige, så vi præsenterer dem separat.
Bemærk: Fra den 16. maj 2021 viser vi ikke længere ejere, der ikke har indsendt en 13D/G inden for det seneste år. Tidligere viste vi den fulde historie af 13D/G-arkiver. Generelt skal enheder, der er forpligtet til at indgive 13D/G-ansøgninger, indgive mindst årligt, før de indsender en afsluttende ansøgning. Dog forlader fonde nogle gange positioner uden at indsende en afsluttende ansøgning (dvs. de afvikler), så visning af den fulde historie resulterede nogle gange i forvirring om det nuværende ejerskab. For at undgå forvirring viser vi nu kun 'aktuelle' ejere - det vil sige - ejere, der har anmeldt inden for det seneste år.
Upgrade to unlock premium data.
| Fil dato | Form | Investor | Forrige Aktier |
Seneste Aktier |
Δ Aktier (Procent) |
Ejendomsret (Procent) |
Δ Ejerskab (Procent) |
|
|---|---|---|---|---|---|---|---|---|
| 2026-02-09 | STATE STREET CORP | 2,913,233 | 2,726,744 | -6.40 | 4.90 | -5.77 | ||
| 2025-11-12 | WELLINGTON MANAGEMENT GROUP LLP | 4,246,012 | 4,800,562 | 13.06 | 8.50 | 14.86 | ||
| 2025-10-17 | BlackRock, Inc. | 8,031,497 | 8,547,546 | 6.43 | 15.10 | 7.86 |
13F og NPORT arkivering
Detaljer om 13F-arkivering er gratis. Detaljer om NP-ansøgninger kræver et premium-medlemskab. Grønne rækker angiver nye positioner. Røde rækker angiver lukkede positioner. Klik på linket ikon for at se den fulde transaktionshistorik.
Opgrader
for at låse premium-data op og eksportere til Excel ![]() .
.
| Fil dato | Kilde | Investor | Type | Gennemsnitlig pris (Øst) |
Aktier | Δ Aktier (%) |
Rapporteret Værdi ($1000) |
Δ Værdi (%) |
Port Alloc (%) |
|
|---|---|---|---|---|---|---|---|---|---|---|
| 2026-02-12 | 13F | Nuveen, LLC | 494.797 | 45,52 | 41.810 | 61,01 | ||||
| 2025-11-13 | 13F | Clear Street Markets Llc | Call | 0 | -100,00 | 0 | -100,00 | |||
| 2026-02-17 | 13F | Creative Planning | 23.814 | 77,15 | 2.012 | 96,10 | ||||
| 2026-02-12 | 13F | CIBC Private Wealth Group, LLC | 1.605 | -9,01 | 136 | 0,75 | ||||
| 2026-02-05 | 13F | Bessemer Group Inc | 47.480 | 30.335,90 | 4 | |||||
| 2025-11-13 | 13F | Clear Street Markets Llc | Put | 0 | -100,00 | 0 | -100,00 | |||
| 2026-02-11 | 13F | Rise Advisors, LLC | 0 | -100,00 | 0 | |||||
| 2026-02-17 | 13F | MIRAE ASSET GLOBAL ETFS HOLDINGS Ltd. | 26.269 | -1,40 | 2.220 | 9,10 | ||||
| 2026-02-04 | 13F | Versor Investments LP | 13.462 | -0,14 | 1.138 | 10,50 | ||||
| 2026-01-30 | 13F | Us Bancorp \de\ | 143 | 62,50 | 12 | 100,00 | ||||
| 2026-01-30 | 13F | State of New Jersey Common Pension Fund D | 27.830 | -6,49 | 2.352 | 3,48 | ||||
| 2026-03-16 | 13F/A | Rockefeller Capital Management L.P. | 70.902 | 49.830,99 | 5.991 | 59.810,00 | ||||
| 2026-02-11 | 13F | Neumeier Poma Investment Counsel Llc | 484.196 | 40,22 | 40.915 | 55,15 | ||||
| 2026-02-17 | 13F | Frontier Capital Management Co Llc | 92.573 | 7.822 | ||||||
| 2026-02-11 | 13F | Hughes Financial Services, LLC | 6 | 1 | ||||||
| 2025-11-13 | 13F | Clear Street Markets Llc | 0 | -100,00 | 0 | -100,00 | ||||
| 2026-02-17 | 13F | Jones Financial Companies Lllp | 939 | 465,66 | 79 | 558,33 | ||||
| 2026-02-12 | 13F | Dimensional Fund Advisors Lp | 1.655.633 | 8,17 | 139.904 | 19,70 | ||||
| 2026-02-03 | 13F | Pier Capital, LLC | 121.883 | -1,06 | 10.299 | 9,48 | ||||
| 2026-02-09 | 13F | Hantz Financial Services, Inc. | 559 | 258,33 | 0 | |||||
| 2026-02-13 | 13F | Parkside Financial Bank & Trust | 414 | 7,25 | 35 | 17,24 | ||||
| 2026-02-17 | 13F | Fred Alger Management, Llc | 2.868 | -7,60 | 242 | 2,11 | ||||
| 2026-01-29 | 13F | Teachers Retirement System Of The State Of Kentucky | 14.124 | -5,56 | 1 | 0,00 | ||||
| 2026-04-27 | 13F | Sound Income Strategies, LLC | 115 | 0,00 | 9 | -27,27 | ||||
| 2026-02-13 | 13F | Financial Network Wealth Advisors LLC | 30 | 0,00 | 3 | 0,00 | ||||
| 2026-02-17 | 13F | Northern Trust Corp | 604.054 | -7,06 | 51.043 | 2,83 | ||||
| 2026-01-29 | 13F | IMC-Chicago, LLC | Call | 20.300 | 50,37 | 1.715 | 66,50 | |||
| 2026-02-12 | 13F | Penserra Capital Management LLC | 3.192 | 11,10 | 0 | |||||
| 2026-02-12 | 13F | Swiss National Bank | 105.900 | 0,38 | 8.949 | 11,06 | ||||
| 2026-04-20 | 13F | Louisiana State Employees Retirement System | 24.500 | -4,30 | 1.822 | -15,77 | ||||
| 2026-01-08 | 13F | Ulland Investment Advisors, LLC | 43.754 | -6,26 | 4 | 0,00 | ||||
| 2026-02-17 | 13F | Alliancebernstein L.p. | 68.786 | -95,74 | 5.812 | -95,28 | ||||
| 2025-11-12 | 13F | Simplex Trading, Llc | Call | 0 | -100,00 | 0 | ||||
| 2026-02-12 | 13F | BlackRock, Inc. | 8.953.554 | 0,84 | 756.575 | 11,57 | ||||
| 2026-02-13 | 13F | Bridgefront Capital, LLC | 3.576 | -32,66 | 302 | -25,43 | ||||
| 2026-02-10 | 13F | Bank of New York Mellon Corp | 327.475 | -1,66 | 27.672 | 8,81 | ||||
| 2026-04-13 | 13F | True Wealth Design, LLC | 9 | 28,57 | 1 | |||||
| 2026-02-09 | 13F | Geode Capital Management, Llc | 1.308.250 | -0,93 | 110.566 | 9,62 | ||||
| 2026-03-06 | 13F | Hsbc Holdings Plc | 0 | -100,00 | 0 | |||||
| 2026-02-13 | 13F | Victory Capital Management Inc | 82.651 | -48,76 | 6.984 | -43,30 | ||||
| 2026-02-18 | 13F/A | Fuller & Thaler Asset Management, Inc. | 1.068.430 | 90.282 | ||||||
| 2026-04-24 | 13F | Root Financial Partners, LLC | 193 | 17,68 | 14 | 7,69 | ||||
| 2026-02-02 | 13F | Danske Bank A/s | 300 | 0,00 | 25 | 13,64 | ||||
| 2026-02-11 | 13F | Cedar Mountain Advisors, LLC | 10 | 900,00 | 1 | |||||
| 2026-02-13 | 13F | Edgestream Partners, L.P. | 0 | -100,00 | 0 | |||||
| 2026-01-29 | 13F | RMG Wealth Management LLC | 0 | -100,00 | 0 | -100,00 | ||||
| 2026-02-13 | 13F | Entropy Technologies, LP | 4.382 | 370 | ||||||
| 2026-04-10 | 13F | Abound Wealth Management | 3 | 0,00 | 0 | |||||
| 2026-04-13 | 13F | Massmutual Trust Co Fsb/adv | 42 | 0,00 | 3 | 0,00 | ||||
| 2025-11-21 | 13F | Nebula Research & Development LLC | 0 | -100,00 | 0 | -100,00 | ||||
| 2026-02-17 | 13F | Adage Capital Partners Gp, L.l.c. | 333.000 | 233,00 | 28.138 | 268,44 | ||||
| 2025-11-13 | 13F | Glenmede Investment Management, LP | 2.931 | 224 | ||||||
| 2026-04-21 | 13F | Huntleigh Advisors, Inc. | 9.541 | 3,00 | 710 | -9,34 | ||||
| 2026-02-13 | 13F | Barclays Plc | 162.688 | 25,36 | 13.747 | 38,72 | ||||
| 2026-04-07 | 13F | Signaturefd, Llc | 59 | 47,50 | 4 | 33,33 | ||||
| 2026-02-17 | 13F | Aquatic Capital Management LLC | 13.076 | 1.105 | ||||||
| 2026-02-13 | 13F | Arkadios Wealth Advisors | 6.758 | 0,22 | 571 | 11,09 | ||||
| 2025-11-21 | 13F/A | CIBC Bancorp USA Inc. | 6.113 | 467 | ||||||
| 2026-02-17 | 13F | Captrust Financial Advisors | 7.852 | 2,67 | 663 | 13,53 | ||||
| 2026-01-29 | 13F | Verdence Capital Advisors LLC | 2.506 | -44,69 | 212 | -38,30 | ||||
| 2026-02-13 | 13F | Ubs Asset Management Americas Inc | 95.134 | 4,57 | 8.039 | 15,70 | ||||
| 2026-04-13 | 13F | St Germain D J Co Inc | 0 | -100,00 | 0 | |||||
| 2026-02-09 | 13F | William Blair Investment Management, Llc | 1.020.700 | 1,54 | 86.249 | 12,35 | ||||
| 2025-11-12 | 13F | 111 Capital | 0 | -100,00 | 0 | -100,00 | ||||
| 2026-01-28 | 13F | B. Metzler seel. Sohn & Co. AG | 30.948 | -15,53 | 2.615 | -6,54 | ||||
| 2026-02-13 | 13F | Morgan Stanley | 404.828 | -2,81 | 34.208 | 7,54 | ||||
| 2026-02-17 | 13F | Landmark Investment Partners, L.p. | Call | 0 | -100,00 | 0 | ||||
| 2026-02-13 | 13F | Brasada Capital Management, Lp | 6.915 | -13,56 | 584 | -4,26 | ||||
| 2026-02-11 | 13F | Group One Trading, L.p. | Call | 0 | -100,00 | 0 | -100,00 | |||
| 2026-04-08 | 13F | DiNuzzo Private Wealth, Inc. | 10 | -9,09 | 1 | |||||
| 2026-02-11 | 13F | Vestcor Inc | 3.003 | 0 | ||||||
| 2026-04-22 | 13F | Pictet Asset Management Holding SA | 8.922 | 20,83 | 664 | 6,42 | ||||
| 2026-02-09 | 13F | Quest Partners LLC | 7.107 | 26,96 | 601 | 40,52 | ||||
| 2026-02-09 | 13F | Legal & General Group Plc | 143.911 | -5,49 | 12.160 | 4,57 | ||||
| 2026-01-30 | 13F | Torren Management, LLC | 271 | 23 | ||||||
| 2026-04-14 | 13F | Congress Asset Management Co /ma | 1.040.888 | 9,62 | 77.411 | -3,52 | ||||
| 2026-02-13 | 13F | Commerce Bank | 9.089 | -2,42 | 768 | 8,02 | ||||
| 2026-02-13 | 13F | Dynamic Technology Lab Private Ltd | 0 | -100,00 | 0 | -100,00 | ||||
| 2026-02-17 | 13F | Dark Forest Capital Management Lp | 14.379 | 1.215 | ||||||
| 2026-04-23 | 13F | Peregrine Capital Management Llc | 154.345 | -0,14 | 11.479 | -12,11 | ||||
| 2026-04-24 | 13F | Yousif Capital Management, Llc | 15.014 | -1,22 | 1.117 | -22,01 | ||||
| 2026-04-13 | 13F | Mather Group, Llc. | 182 | 14 | ||||||
| 2026-02-13 | 13F | Walleye Trading LLC | Call | 0 | -100,00 | 0 | ||||
| 2026-04-17 | 13F | Bell Investment Advisors, Inc | 18 | 0,00 | 1 | 0,00 | ||||
| 2025-11-12 | 13F | Park Square Financial Group, LLC | 0 | -100,00 | 0 | |||||
| 2026-04-14 | 13F | Bay Harbor Wealth Management, LLC | 7 | 16,67 | 1 | |||||
| 2026-02-11 | 13F | Parallel Advisors, LLC | 51 | 82,14 | 4 | 100,00 | ||||
| 2025-11-10 | 13F | MAI Capital Management | 0 | -100,00 | 0 | |||||
| 2026-01-27 | 13F | Zurcher Kantonalbank (Zurich Cantonalbank) | 11.600 | 7,51 | 980 | 18,93 | ||||
| 2026-02-11 | 13F | Group One Trading, L.p. | Put | 600 | -91,78 | 51 | -91,02 | |||
| 2026-02-17 | 13F | Philadelphia Financial Management of San Francisco, LLC | 155.425 | -18,30 | 13.133 | -9,60 | ||||
| 2026-02-11 | 13F | Group One Trading, L.p. | 562 | -78,16 | 47 | -76,02 | ||||
| 2026-02-17 | 13F | Susquehanna Portfolio Strategies, LLC | 101.407 | 8.569 | ||||||
| 2026-02-02 | 13F | Kornitzer Capital Management Inc /ks | 146.731 | 0,05 | 12.399 | 10,71 | ||||
| 2026-01-12 | 13F | Rialto Wealth Management, LLC | 6 | 50,00 | 1 | |||||
| 2026-04-08 | 13F | Mirador Capital Partners LP | 51.506 | 2,48 | 3.831 | -9,80 | ||||
| 2026-02-05 | 13F | HFM Investment Advisors, LLC | 4 | 33,33 | 0 | |||||
| 2026-02-12 | 13F | MetLife Investment Management, LLC | 31.577 | -5,38 | 2.668 | 4,71 | ||||
| 2026-02-04 | 13F | First Eagle Investment Management, LLC | 122.824 | 10,13 | 10.379 | 21,85 | ||||
| 2026-02-09 | 13F | Royce & Associates Lp | 286.196 | -17,78 | 24.184 | -9,03 | ||||
| 2026-02-13 | 13F | First Trust Advisors Lp | 22.482 | -54,93 | 1.900 | -50,14 | ||||
| 2026-01-27 | 13F | Meritage Portfolio Management | 0 | -100,00 | 0 | -100,00 | ||||
| 2026-02-11 | 13F | Deutsche Bank Ag\ | 49.033 | 5,47 | 4.143 | 16,70 | ||||
| 2026-04-24 | 13F | Marathon Asset Mgmt Ltd | 290.034 | 21.572 | ||||||
| 2026-04-14 | 13F | USA Financial Portformulas Corp | 6 | 0,00 | 0 | |||||
| 2026-02-13 | 13F | Mml Investors Services, Llc | 3.640 | 10,44 | 308 | 22,31 | ||||
| 2026-02-17 | 13F | Bank Of America Corp /de/ | 529.867 | 31,43 | 44.774 | 45,42 | ||||
| 2026-02-09 | 13F | Atlantic Trust, LLC | 495 | -1,39 | 42 | 7,89 | ||||
| 2026-02-04 | 13F | Bailard, Inc. | 0 | -100,00 | 0 | |||||
| 2026-02-12 | 13F | Bank Of Montreal /can/ | 826.232 | 14.013,97 | 69.817 | 15.518,79 | ||||
| 2025-11-07 | 13F | HighTower Advisors, LLC | Call | 0 | -100,00 | 0 | -100,00 | |||
| 2026-02-17 | 13F | Raymond James Financial Inc | 80.503 | -23,45 | 6.802 | -15,30 | ||||
| 2026-04-23 | 13F | Asset Planning,Inc | 100 | 0,00 | 7 | -12,50 | ||||
| 2026-02-10 | 13F | Zhang Financial LLC | 10.000 | 0,00 | 845 | 10,75 | ||||
| 2025-11-14 | 13F | SummitTX Capital, L.P. | 0 | -100,00 | 0 | -100,00 | ||||
| 2026-04-21 | 13F | Gilpin Wealth Management, Llc | 5 | 0,00 | 0 | |||||
| 2026-01-23 | 13F | Guidance Capital, Inc | 6.892 | 1,04 | 645 | 23,61 | ||||
| 2026-02-12 | 13F | Principal Securities, Inc. | 0 | -100,00 | 0 | -100,00 | ||||
| 2026-02-09 | 13F | Keating Financial Advisory Services, Inc. | 26 | 2 | ||||||
| 2026-02-17 | 13F | XTX Topco Ltd | 0 | -100,00 | 0 | |||||
| 2026-02-17 | 13F | Punch & Associates Investment Management, Inc. | 0 | -100,00 | 0 | |||||
| 2026-02-19 | 13F/A | T. Rowe Price Investment Management, Inc. | 517.911 | -53,12 | 44 | -48,81 | ||||
| 2026-02-12 | 13F | Granite Investment Partners, LLC | 146.956 | -15,80 | 12.418 | -6,84 | ||||
| 2026-01-15 | 13F | Nisa Investment Advisors, Llc | 1.727 | 102,46 | 146 | 123,08 | ||||
| 2026-02-17 | 13F | Sig Brokerage, Lp | 3.716 | 314 | ||||||
| 2026-02-11 | 13F | Franklin Resources Inc | 17.559 | 0,42 | 1.484 | 11,09 | ||||
| 2026-02-17 | 13F | Mercer Global Advisors Inc /adv | 33.273 | -6,57 | 2.812 | 3,38 | ||||
| 2026-02-13 | 13F | BNP Paribas Asset Management Holding S.A. | 696 | 44,70 | 0 | |||||
| 2026-02-17 | 13F | Optiver Holding B.V. | 74 | -66,67 | 6 | -62,50 | ||||
| 2026-02-05 | 13F | Cambridge Investment Research Advisors, Inc. | 2.915 | 0 | ||||||
| 2026-02-13 | 13F | Kennedy Capital Management, Inc. | 152.229 | -1,34 | 12.863 | 9,17 | ||||
| 2026-02-05 | 13F | Gabelli Funds Llc | 143.742 | -0,96 | 12.146 | 9,58 | ||||
| 2026-01-29 | 13F | Concurrent Investment Advisors, LLC | 3.871 | 10,98 | 327 | 22,93 | ||||
| 2026-02-13 | 13F | Public Employees Retirement Association Of Colorado | 6.258 | 0,00 | 1 | |||||
| 2026-02-13 | 13F | Arrowstreet Capital, Limited Partnership | 8.193 | 692 | ||||||
| 2026-02-17 | 13F | EMG Holdings, L.P. | Call | 0 | -100,00 | 0 | ||||
| 2025-11-14 | 13F | Texas Permanent School Fund | 0 | -100,00 | 0 | |||||
| 2026-02-06 | 13F | HighTower Advisors, LLC | 6.111 | 0,96 | 516 | 11,69 | ||||
| 2026-02-13 | 13F | Pinnacle Wealth Planning Services, Inc. | 1.016 | 86 | ||||||
| 2026-02-13 | 13F | Caitong International Asset Management Co., Ltd | 182 | 15 | ||||||
| 2026-01-28 | 13F | Klp Kapitalforvaltning As | 11.500 | 0,00 | 972 | 10,59 | ||||
| 2026-02-17 | 13F | Tensile Capital Management LP | 248.562 | -19,34 | 21 | -8,70 | ||||
| 2026-02-13 | 13F | Marshall Wace, Llp | 1.237.190 | -11,48 | 104.543 | -2,06 | ||||
| 2026-02-19 | 13F | CI Private Wealth, LLC | 2.552 | 216 | ||||||
| 2026-02-17 | 13F | DV Trading LLC | 100 | 8 | ||||||
| 2026-02-13 | 13F | American Century Companies Inc | 1.147.750 | -36,72 | 96.985 | -29,98 | ||||
| 2026-02-13 | 13F/A | Alberta Investment Management Corp | 0 | -100,00 | 0 | |||||
| 2026-01-21 | 13F | Portside Wealth Group, LLC | 6.461 | 16,00 | 546 | 28,24 | ||||
| 2026-02-04 | 13F | Wsfs Capital Management, Llc | 14.972 | 8,86 | 1.265 | 20,48 | ||||
| 2026-02-13 | 13F | Alyeska Investment Group, L.P. | 639.102 | 566,54 | 54.004 | 637,56 | ||||
| 2026-02-04 | 13F | Pacer Advisors, Inc. | 0 | -100,00 | 0 | -100,00 | ||||
| 2026-02-17 | 13F | Price T Rowe Associates Inc /md/ | 51.016 | 2,33 | 4 | 33,33 | ||||
| 2026-02-10 | 13F | Td Asset Management Inc | 0 | -100,00 | 0 | -100,00 | ||||
| 2026-02-06 | 13F | Global Retirement Partners, LLC | 12 | 1 | ||||||
| 2026-02-17 | 13F | Samlyn Capital, Llc | 218.754 | 18.485 | ||||||
| 2025-11-07 | 13F | Shell Asset Management Co | 659 | -60,42 | 0 | |||||
| 2026-04-15 | 13F | Occidental Asset Management, LLC | 0 | -100,00 | 0 | |||||
| 2026-02-10 | 13F | Envestnet Asset Management Inc | 37.855 | -9,85 | 3.199 | -0,25 | ||||
| 2026-02-13 | 13F | Landscape Capital Management, L.l.c. | 17.590 | 1.486 | ||||||
| 2025-11-14 | 13F | Centiva Capital, LP | 0 | -100,00 | 0 | |||||
| 2026-04-15 | 13F | Exchange Traded Concepts, Llc | 1.615 | 12,00 | 120 | -0,83 | ||||
| 2026-01-21 | 13F | Flagship Harbor Advisors, Llc | 54 | 5 | ||||||
| 2026-02-17 | 13F | Schonfeld Strategic Advisors LLC | 38.577 | 3.260 | ||||||
| 2026-02-13 | 13F | Pathstone Holdings, LLC | 4.602 | 58,47 | 389 | 75,57 | ||||
| 2026-04-14 | 13F | Prospera Financial Services Inc | 4.500 | 0,00 | 335 | -12,11 | ||||
| 2026-02-12 | 13F | Cibc World Markets Corp | 3.744 | -43,78 | 316 | -24,04 | ||||
| 2026-02-17 | 13F | Mangrove Partners | 2.563 | 217 | ||||||
| 2025-11-14 | 13F | Graham Capital Management, L.P. | 0 | -100,00 | 0 | |||||
| 2026-02-12 | 13F | Cloud Capital Management, LLC | 0 | -100,00 | 0 | |||||
| 2026-02-13 | 13F | Manufacturers Life Insurance Company, The | 0 | -100,00 | 0 | |||||
| 2026-01-16 | 13F | Crewe Advisors LLC | 164 | 13,89 | 14 | 30,00 | ||||
| 2025-11-14 | 13F | DRW Securities, LLC | 0 | -100,00 | 0 | |||||
| 2026-02-17 | 13F | Jain Global LLC | 3.624 | 306 | ||||||
| 2026-02-17 | 13F | Holocene Advisors, LP | 3.200 | -77,90 | 270 | -75,57 | ||||
| 2026-02-17 | 13F | Trexquant Investment LP | 0 | -100,00 | 0 | |||||
| 2026-02-09 | 13F | Harbour Investments, Inc. | 5.761 | 0,03 | 487 | 10,71 | ||||
| 2026-02-17 | 13F | Susquehanna International Group, Llp | Call | 23.900 | -57,17 | 2.020 | -52,62 | |||
| 2026-02-17 | 13F | Susquehanna International Group, Llp | 27.940 | -37,78 | 2.361 | -31,18 | ||||
| 2026-02-13 | 13F | Brant Point Investment Management Llc | 35.000 | 40,00 | 2.958 | 54,90 | ||||
| 2026-02-17 | 13F | Susquehanna International Group, Llp | Put | 18.600 | -22,82 | 1.572 | -14,62 | |||
| 2026-02-17 | 13F | Janus Henderson Group Plc | 102.850 | 330,97 | 8.689 | 376,89 | ||||
| 2026-04-21 | 13F | GHP Investment Advisors, Inc. | 6 | 0 | ||||||
| 2026-01-23 | 13F | Transcend Wealth Collective, Llc | 2.733 | 231 | ||||||
| 2026-04-17 | 13F | AdvisorNet Financial, Inc | 735 | 0,00 | 55 | -12,90 | ||||
| 2026-01-21 | 13F | Clayton Financial Group LLC | 0 | -100,00 | 0 | |||||
| 2026-02-13 | 13F | Baird Financial Group, Inc. | 11.427 | 64,89 | 966 | 82,42 | ||||
| 2026-02-10 | 13F | Eurizon Capital SGR S.p.A. | 1.488 | 127 | ||||||
| 2026-04-22 | 13F | Janney Montgomery Scott LLC | 0 | -100,00 | 0 | |||||
| 2026-04-20 | 13F | Ronald Blue Trust, Inc. | 0 | -100,00 | 0 | |||||
| 2025-12-09 | 13F/A | Tudor Investment Corp Et Al | 0 | -100,00 | 0 | |||||
| 2026-02-12 | 13F | Ankerstar Wealth, LLC | 9 | 1 | ||||||
| 2026-02-11 | 13F | O'shaughnessy Asset Management, Llc | 2.698 | 228 | ||||||
| 2026-02-17 | 13F | Aster Capital Management (DIFC) Ltd | 228 | 19 | ||||||
| 2026-02-12 | 13F | Xponance, Inc. | 4.470 | -0,86 | 378 | 9,59 | ||||
| 2026-04-22 | 13F | Fort Washington Investment Advisors Inc /oh/ | 316.018 | 0,42 | 23.502 | -11,62 | ||||
| 2025-11-12 | 13F | Steward Partners Investment Advisory, Llc | 0 | -100,00 | 0 | -100,00 | ||||
| 2025-11-03 | 13F | Townsquare Capital Llc | 0 | -100,00 | 0 | |||||
| 2026-02-10 | 13F | Commonwealth Of Pennsylvania Public School Empls Retrmt Sys | 13.829 | -3,93 | 1.169 | 6,28 | ||||
| 2025-11-04 | 13F | IMC-Chicago, LLC | Put | 0 | -100,00 | 0 | -100,00 | |||
| 2026-04-23 | 13F | Oppenheimer Asset Management Inc. | 41.071 | 278,92 | 3.054 | 233,77 | ||||
| 2026-02-13 | 13F | Smartleaf Asset Management LLC | 186 | 154,79 | 16 | 200,00 | ||||
| 2026-02-17 | 13F | Almitas Capital LLC | 5.000 | 422 | ||||||
| 2026-04-24 | 13F | Profund Advisors Llc | 2.739 | -43,63 | 204 | -50,49 | ||||
| 2026-02-13 | 13F | Rafferty Asset Management, LLC | 91.419 | 7,17 | 7.725 | 18,58 | ||||
| 2026-01-27 | 13F | Vista Finance, Llc | 2.983 | -5,27 | 252 | 5,00 | ||||
| 2026-01-30 | 13F | AMG National Trust Bank | 10.871 | 919 | ||||||
| 2026-04-20 | 13F | Sowell Financial Services LLC | 3.228 | 9,20 | 240 | -3,61 | ||||
| 2026-02-10 | 13F | Bnp Paribas Arbitrage, Sa | 27.494 | -49,37 | 2.323 | -43,98 | ||||
| 2026-02-17 | 13F | Advisor Group Holdings, Inc. | 103.545 | -4,83 | 8.750 | 5,31 | ||||
| 2026-02-11 | 13F | Capital Research Global Investors | 1.757.463 | -0,28 | 148.506 | 10,34 | ||||
| 2026-02-03 | 13F | Wilson Asset Management (international) Pty Ltd | 6.602 | 558 | ||||||
| 2026-02-06 | 13F | Aviance Capital Partners, LLC | 7.926 | 12,25 | 670 | 24,12 | ||||
| 2026-02-13 | 13F | Aigen Investment Management, Lp | 0 | -100,00 | 0 | |||||
| 2026-04-23 | 13F | Oppenheimer & Co Inc | 5.820 | 433 | ||||||
| 2026-02-11 | 13F | Meeder Asset Management Inc | 1.232 | -53,33 | 104 | -48,26 | ||||
| 2026-02-11 | 13F | GW&K Investment Management, LLC | 493.096 | 42 | ||||||
| 2026-04-13 | 13F | Creative Financial Designs Inc /adv | 10 | 0,00 | 1 | |||||
| 2025-11-14 | 13F | Walleye Trading LLC | 0 | -100,00 | 0 | -100,00 | ||||
| 2026-02-05 | 13F | Thrivent Financial For Lutherans | 210.372 | 6,50 | 18 | 13,33 | ||||
| 2026-02-17 | 13F | Advisory Services Network, LLC | 0 | -100,00 | 0 | |||||
| 2026-04-17 | 13F | CENTRAL TRUST Co | 10 | 0,00 | 1 | |||||
| 2026-02-17 | 13F | Summit Partners Public Asset Management, Llc | 470.832 | -4,45 | 39.785 | 5,72 | ||||
| 2026-02-13 | 13F | Kettle Hill Capital Management, Llc | 70.343 | 5.944 | ||||||
| 2026-02-12 | 13F | Third Avenue Management Llc | 0 | -100,00 | 0 | |||||
| 2026-02-13 | 13F | Gendell Jeffrey L | 317.097 | 54,42 | 26.795 | 70,86 | ||||
| 2026-02-11 | 13F | Allianz Asset Management GmbH | 73.270 | -4,69 | 6.191 | 5,47 | ||||
| 2026-02-11 | 13F | Capital World Investors | 800.000 | 0,00 | 67.600 | 10,65 | ||||
| 2026-02-12 | 13F | Jane Street Group, Llc | Call | 6.500 | -48,82 | 549 | -43,34 | |||
| 2026-02-17 | 13F | Quantinno Capital Management LP | 6.467 | 35,21 | 546 | 49,59 | ||||
| 2026-02-12 | 13F | Jane Street Group, Llc | 29.723 | 730,25 | 2.512 | 819,78 | ||||
| 2026-02-17 | 13F | Public Employees Retirement System Of Ohio | 745 | 3,47 | 63 | 14,81 | ||||
| 2026-02-06 | 13F | Vestmark Advisory Solutions, Inc. | 15.881 | 25,51 | 1.342 | 38,82 | ||||
| 2026-02-13 | 13F | Schroder Investment Management Group | 6.771 | -2,10 | 578 | 12,02 | ||||
| 2025-11-13 | 13F | PFG Advisors | 0 | -100,00 | 0 | |||||
| 2025-11-14 | 13F | Freestone Grove Partners LP | 0 | -100,00 | 0 | |||||
| 2026-02-12 | 13F | New York State Common Retirement Fund | 41.777 | -3,24 | 3.530 | 7,07 | ||||
| 2026-02-12 | 13F | Robotti Robert | 70.041 | 1,54 | 5.918 | 12,34 | ||||
| 2026-02-17 | 13F | Millennium Management Llc | 18.780 | -37,57 | 1.587 | -30,95 | ||||
| 2026-01-20 | 13F | Harbor Capital Advisors, Inc. | 14.098 | -66,80 | 1 | -66,67 | ||||
| 2025-11-14 | 13F | Vident Advisory, LLC | 0 | -100,00 | 0 | |||||
| 2026-02-17 | 13F | Brevan Howard Capital Management LP | 19.191 | 1.622 | ||||||
| 2026-02-13 | 13F | Fiduciary Trust Co | 2.637 | 223 | ||||||
| 2026-02-13 | 13F | Charles Schwab Investment Management Inc | 738.884 | 1,67 | 62.436 | 12,50 | ||||
| 2026-02-12 | 13F | California Public Employees Retirement System | 90.125 | 0,00 | 7.616 | 10,65 | ||||
| 2026-01-26 | 13F | KBC Group NV | 1.758 | 0,00 | 0 | |||||
| 2026-02-17 | 13F/A | RBF Capital, LLC | 7.000 | 0,00 | 592 | 10,67 | ||||
| 2026-02-17 | 13F | Mak Capital One Llc | Put | 1.500.000 | 0,00 | 126.750 | 10,65 | |||
| 2026-02-10 | 13F | Goldman Sachs Group Inc | 1.446.348 | -13,30 | 122.216 | -4,07 | ||||
| 2026-02-13 | 13F | JustInvest LLC | 2.473 | 209 | ||||||
| 2026-02-10 | 13F | Goldman Sachs Group Inc | Put | 225.000 | 19.012 | |||||
| 2026-02-04 | 13F | Swiss Life Asset Management Ltd | 4.772 | 403 | ||||||
| 2026-02-17 | 13F | Mak Capital One Llc | 2.000.000 | 0,00 | 169.000 | 10,65 | ||||
| 2026-02-13 | 13F | Citigroup Inc | 60.593 | 0,51 | 5.120 | 11,23 | ||||
| 2026-02-13 | 13F | Gts Securities Llc | 7.366 | -27,00 | 622 | -19,22 | ||||
| 2026-04-20 | 13F | Jfs Wealth Advisors, Llc | 43 | -6,52 | 3 | 0,00 | ||||
| 2026-02-09 | 13F | Huntington National Bank | 120 | -5,51 | 10 | 11,11 | ||||
| 2026-02-13 | 13F | Verition Fund Management LLC | 14.363 | -60,16 | 1.214 | -55,94 | ||||
| 2026-02-06 | 13F | Larson Financial Group LLC | 212 | 27,71 | 18 | 41,67 | ||||
| 2026-04-15 | 13F | Fortitude Family Office, LLC | 30 | 57,89 | 2 | 100,00 | ||||
| 2026-02-13 | 13F | State Street Corp | 2.726.744 | -6,40 | 230.410 | 3,56 | ||||
| 2026-02-17 | 13F | Aqr Capital Management Llc | 8.100 | 133,90 | 684 | 159,09 | ||||
| 2026-02-19 | 13F | Invesco Ltd. | 931.016 | 35,44 | 78.671 | 49,86 | ||||
| 2026-04-21 | 13F | Wasatch Advisors Inc | 2.736.767 | 221,32 | 203.533 | 182,80 | ||||
| 2026-02-17 | 13F | RMB Capital Management, LLC | 5.238 | -14,76 | 443 | -5,76 | ||||
| 2025-11-14 | 13F | Royal Bank Of Canada | Put | 0 | -100,00 | 0 | -100,00 | |||
| 2026-02-13 | 13F | Quarry LP | 0 | -100,00 | 0 | |||||
| 2026-02-05 | 13F | Td Private Client Wealth Llc | 8 | 0,00 | 1 | |||||
| 2026-02-10 | 13F | Argent Trust Co | 4.023 | 18,29 | 340 | 30,89 | ||||
| 2026-02-02 | 13F | Fifth Third Bancorp | 4.527 | -0,88 | 383 | 9,77 | ||||
| 2026-02-17 | 13F | Delaware Management Holdings, Inc. | 42.383 | 3.581 | ||||||
| 2026-02-12 | 13F | Wealthspire Advisors, LLC | 0 | -100,00 | 0 | |||||
| 2026-02-13 | 13F | Prudential Financial Inc | 52.300 | -7,58 | 4.419 | 2,27 | ||||
| 2025-11-04 | 13F | High Note Wealth, LLC | 0 | -100,00 | 0 | |||||
| 2025-10-30 | 13F | Twin Peaks Wealth Advisors, LLC | 0 | -100,00 | 0 | |||||
| 2026-02-03 | 13F | Mitsubishi UFJ Kokusai Asset Management Co., Ltd. | 79 | 0,00 | 7 | 0,00 | ||||
| 2026-02-06 | 13F | Envestnet Portfolio Solutions, Inc. | 4.183 | 7,64 | 353 | 19,26 | ||||
| 2025-11-13 | 13F | Magnetar Financial LLC | 0 | -100,00 | 0 | |||||
| 2026-02-17 | 13F | Gotham Asset Management, LLC | 8.531 | 6,35 | 721 | 17,65 | ||||
| 2025-11-14 | 13F | Skopos Labs, Inc. | 0 | -100,00 | 0 | |||||
| 2025-11-05 | 13F | SOUTH STATE Corp | 0 | -100,00 | 0 | |||||
| 2026-02-10 | 13F | Natixis Advisors, L.p. | 11.992 | 1 | ||||||
| 2026-02-20 | 13F | Kovitz Investment Group Partners, LLC | 2.400 | -55,71 | 203 | -51,09 | ||||
| 2026-02-17 | 13F | Kingdon Capital Management, L.l.c. | 0 | -100,00 | 0 | |||||
| 2026-02-05 | 13F | Amalgamated Bank | 16.257 | -0,25 | 1 | 0,00 | ||||
| 2026-02-09 | 13F | Roubaix Capital, LLC | 0 | -100,00 | 0 | |||||
| 2026-02-17 | 13F | California State Teachers Retirement System | 51.119 | -1,79 | 4.320 | 8,65 | ||||
| 2026-02-05 | 13F | Atria Investments Llc | 5.856 | -3,53 | 495 | 6,70 | ||||
| 2026-04-24 | 13F | ProShare Advisors LLC | 8.695 | -20,92 | 647 | -30,46 | ||||
| 2026-02-17 | 13F | Point72 Asset Management, L.P. | 941.751 | 2,11 | 79.578 | 12,98 | ||||
| 2025-11-12 | 13F | Fox Run Management, L.l.c. | 0 | -100,00 | 0 | |||||
| 2026-02-17 | 13F | Lighthouse Investment Partners, LLC | 0 | -100,00 | 0 | |||||
| 2026-04-15 | 13F | Bayforest Capital Ltd | 0 | -100,00 | 0 | |||||
| 2026-01-28 | 13F | Arizona State Retirement System | 14.885 | -7,56 | 1.258 | 2,28 | ||||
| 2026-02-05 | 13F | Gamco Investors, Inc. Et Al | 177.800 | -1,98 | 15.024 | 8,45 | ||||
| 2026-02-02 | 13F | Principal Financial Group Inc | 267.159 | -2,26 | 22.575 | 8,14 | ||||
| 2026-02-10 | 13F | Goldman Sachs Group Inc | Call | 0 | -100,00 | 0 | -100,00 | |||
| 2026-02-13 | 13F | Ranger Investment Management, L.P. | 200.047 | -0,30 | 16.904 | 10,30 | ||||
| 2026-02-11 | 13F | Barrow Hanley Mewhinney & Strauss Llc | 86 | 0,00 | 7 | 16,67 | ||||
| 2026-02-17 | 13F | Blue Door Asset Management, LLC | 130.774 | 64,50 | 11.050 | 82,01 | ||||
| 2026-02-11 | 13F | Empowered Funds, LLC | 8.614 | 22,67 | 728 | 35,63 | ||||
| 2025-10-30 | 13F | Jennison Associates Llc | 0 | -100,00 | 0 | |||||
| 2026-02-12 | 13F | Federation des caisses Desjardins du Quebec | 500 | -16,67 | 42 | -6,67 | ||||
| 2026-01-23 | 13F | Gibbs Wealth Management | 8.057 | -3,79 | 768 | 20,19 | ||||
| 2026-01-05 | 13F | Argent Capital Management Llc | 17.170 | -5,15 | 1.451 | 4,92 | ||||
| 2026-02-13 | 13F | Sei Investments Co | 46.732 | 18,34 | 3.949 | 30,95 | ||||
| 2026-02-13 | 13F | Rokos Capital Management LLP | 46.560 | 3.933 | ||||||
| 2026-02-17 | 13F | Kemnay Advisory Services Inc. | 145 | 12 | ||||||
| 2025-11-14 | 13F | Point72 Europe (London) LLP | 1.301 | 99 | ||||||
| 2026-01-26 | 13F | Private Trust Co Na | 0 | -100,00 | 0 | |||||
| 2026-02-11 | 13F | Cerity Partners LLC | 59.551 | 2,09 | 5.032 | 12,98 | ||||
| 2026-04-07 | 13F | Central Pacific Bank - Trust Division | 4.773 | -2,45 | 355 | -14,29 | ||||
| 2026-02-17 | 13F | Silvercrest Asset Management Group Llc | 114.116 | -0,29 | 9.643 | 10,32 | ||||
| 2026-02-13 | 13F | Umb Bank N A/mo | 313 | 78,86 | 26 | 100,00 | ||||
| 2026-02-17 | 13F | Cetera Investment Advisers | 6.335 | 535 | ||||||
| 2026-04-16 | 13F | SG Americas Securities, LLC | 21.723 | 56,63 | 2 | 0,00 | ||||
| 2026-02-17 | 13F | Wellington Management Group Llp | 4.298.202 | -10,46 | 363.198 | -0,93 | ||||
| 2026-01-28 | 13F | Salomon & Ludwin, LLC | 462 | 19,38 | 39 | 34,48 | ||||
| 2026-01-26 | 13F | Cwm, Llc | 2.608 | 8,22 | 0 | |||||
| 2026-02-06 | 13F | Pnc Financial Services Group, Inc. | 6.302 | 4,88 | 533 | 16,16 | ||||
| 2026-04-06 | 13F | Versant Capital Management, Inc | 327 | 271,59 | 24 | 242,86 | ||||
| 2026-04-27 | 13F | Y-Intercept (Hong Kong) Ltd | 12.921 | -60,08 | 961 | -64,90 | ||||
| 2026-04-24 | 13F | Strs Ohio | 4.300 | 10,26 | 320 | -3,04 | ||||
| 2026-02-12 | 13F | Federated Hermes, Inc. | 299 | -37,18 | 25 | -30,56 | ||||
| 2026-01-28 | 13F | DekaBank Deutsche Girozentrale | 1.461 | 0,00 | 0 | |||||
| 2026-02-13 | 13F | Public Sector Pension Investment Board | 0 | -100,00 | 0 | |||||
| 2026-01-08 | 13F | Nordea Investment Management Ab | 135.262 | -17,69 | 11.507 | -5,90 | ||||
| 2026-02-11 | 13F | Simplex Trading, Llc | Put | 2.200 | 37,50 | 186 | ||||
| 2026-02-10 | 13F | Nomura Asset Management Co Ltd | 250 | 0,00 | 21 | 10,53 | ||||
| 2026-02-17 | 13F | Qube Research & Technologies Ltd | 0 | -100,00 | 0 | |||||
| 2026-02-11 | 13F | Simplex Trading, Llc | 262 | -93,36 | 22 | |||||
| 2026-02-11 | 13F | CenterBook Partners LP | 4.863 | 411 | ||||||
| 2026-04-09 | 13F | Park Place Capital Corp | 115 | 0,00 | 9 | -11,11 | ||||
| 2026-02-09 | 13F | Hartland & Co., LLC | 30 | 0,00 | 3 | 0,00 | ||||
| 2025-11-14 | 13F | Equitable Holdings, Inc. | 0 | -100,00 | 0 | |||||
| 2026-02-13 | 13F | Rhumbline Advisers | 151.338 | -3,76 | 12.788 | 6,49 | ||||
| 2026-01-30 | 13F | Bogart Wealth, LLC | 11 | 0,00 | 1 | |||||
| 2026-02-12 | 13F | Aviva Plc | 5.913 | -8,31 | 500 | 1,42 | ||||
| 2026-02-11 | 13F | Illinois Municipal Retirement Fund | 30.017 | 6,87 | 2.536 | 18,23 | ||||
| 2026-02-17 | 13F | EMG Holdings, L.P. | 31.829 | -81,27 | 2.690 | -79,27 | ||||
| 2026-01-29 | 13F | Comerica Bank | 35.543 | 119,86 | 3.003 | 143,35 | ||||
| 2026-01-29 | 13F | Vanguard Group Inc | 5.767.896 | -1,57 | 487.387 | 8,91 | ||||
| 2026-02-17 | 13F | Maryland State Retirement & Pension System | 8.163 | 0,47 | 690 | 11,13 | ||||
| 2026-02-12 | 13F | Jane Street Group, Llc | Put | 0 | -100,00 | 0 | -100,00 | |||
| 2026-02-10 | 13F | Rothschild Investment Llc | 96 | 28,00 | 8 | 60,00 | ||||
| 2026-02-11 | 13F | Zions Bancorporation, National Association /ut/ | 12 | 1 | ||||||
| 2026-04-13 | 13F | IFP Advisors, Inc | 48 | 33,33 | 4 | 0,00 | ||||
| 2026-02-17 | 13F | Glenmede Trust Co Na | 3.114 | 263 | ||||||
| 2026-02-13 | 13F | FJ Capital Management LLC | 35.462 | 2.997 | ||||||
| 2026-02-17 | 13F | Twinbeech Capital Lp | 21.200 | 1.791 | ||||||
| 2026-02-17 | 13F | Clough Capital Partners L P | 0 | -100,00 | 0 | |||||
| 2026-02-17 | 13F | Tower Research Capital LLC (TRC) | 1.482 | -16,79 | 125 | -8,09 | ||||
| 2026-02-06 | 13F | Covestor Ltd | 2.570 | 33,65 | 0 | |||||
| 2026-01-29 | 13F | Dunhill Financial, LLC | 1 | 0 | ||||||
| 2026-04-02 | 13F | Byrne Asset Management LLC | 2.790 | 32,98 | 207 | 16,95 | ||||
| 2026-02-09 | 13F | Annis Gardner Whiting Capital Advisors, LLC | 4 | 0 | ||||||
| 2026-02-13 | 13F | Cramer Rosenthal Mcglynn Llc | 835.979 | 25,93 | 70.640 | 39,33 | ||||
| 2026-02-13 | 13F | Wells Fargo & Company/mn | 160.410 | 20,33 | 13.555 | 33,14 | ||||
| 2026-04-17 | 13F | Vermillion Wealth Management, Inc. | 3 | 0 | ||||||
| 2026-01-16 | 13F | Empirical Financial Services, LLC d.b.a. Empirical Wealth Management | 0 | -100,00 | 0 | |||||
| 2026-02-12 | 13F | Ensign Peak Advisors, Inc | 3.144 | -66,17 | 266 | -62,62 | ||||
| 2026-02-02 | 13F | Truist Financial Corp | 6.881 | -2,55 | 581 | 7,79 | ||||
| 2026-02-10 | 13F/A | Northwestern Mutual Wealth Management Co | 120 | -24,05 | 10 | -16,67 | ||||
| 2026-02-18 | 13F | GWM Advisors LLC | 0 | -100,00 | 0 | |||||
| 2026-04-22 | 13F | Sterling Capital Management LLC | 362 | -2,16 | 27 | -16,13 | ||||
| 2026-01-30 | 13F | New York State Teachers Retirement System | 18.700 | 52,03 | 2 | |||||
| 2026-02-06 | 13F | EverSource Wealth Advisors, LLC | 941 | 447,09 | 80 | 507,69 | ||||
| 2026-01-30 | 13F | NJ State Employees Deferred Compensation Plan | 0 | -100,00 | 0 | |||||
| 2026-02-17 | 13F | Fmr Llc | 1.594.172 | -20,00 | 134.708 | -11,49 | ||||
| 2026-02-02 | 13F | Horizon Investments, LLC | 17.028 | 1.439 | ||||||
| 2026-04-07 | 13F | Farther Finance Advisors, LLC | 296 | -4,82 | 22 | -19,23 | ||||
| 2026-02-05 | 13F | Tucker Asset Management Llc | 100 | 8 | ||||||
| 2025-11-13 | 13F | Loomis Sayles & Co L P | 0 | -100,00 | 0 | |||||
| 2026-02-13 | 13F | Toroso Investments, LLC | 62.810 | 5.307 | ||||||
| 2026-02-06 | 13F | Bare Financial Services, Inc | 141 | 113,64 | 12 | 120,00 | ||||
| 2026-04-22 | 13F | JNBA Financial Advisors | 39 | 3 | ||||||
| 2026-02-05 | 13F | O'Brien Greene & Co. Inc | 13.276 | 0,00 | 1.122 | 10,66 | ||||
| 2026-02-11 | 13F | Jpmorgan Chase & Co | 182.444 | 65,79 | 15.417 | 83,44 | ||||
| 2026-04-23 | 13F | Private Wealth Management Group, LLC | 72 | -23,40 | 5 | -28,57 | ||||
| 2026-02-03 | 13F | SBI Securities Co., Ltd. | 84 | 0,00 | 7 | 16,67 | ||||
| 2026-02-17 | 13F | Citadel Advisors Llc | Call | 8.500 | -90,07 | 718 | -89,02 | |||
| 2026-02-17 | 13F | Citadel Advisors Llc | 396.948 | 139,78 | 33.542 | 165,32 | ||||
| 2026-04-23 | 13F | North Star Investment Management Corp. | 9.500 | 0,00 | 707 | -11,97 | ||||
| 2026-02-17 | 13F | Citadel Advisors Llc | Put | 20.600 | -8,04 | 1.741 | 1,75 | |||
| 2026-04-23 | 13F | SJS Investment Consulting Inc. | 9 | 80,00 | 1 | |||||
| 2026-02-11 | 13F | Los Angeles Capital Management Llc | 304 | 20 | ||||||
| 2026-01-29 | 13F | UBS Group AG | 324.084 | -29,21 | 27.385 | -21,68 | ||||
| 2025-10-28 | 13F | Campbell & CO Investment Adviser LLC | 0 | -100,00 | 0 | |||||
| 2026-02-10 | 13F | Norges Bank | 478.952 | 40.471 | ||||||
| 2026-02-12 | 13F | State Board Of Administration Of Florida Retirement System | 15.256 | 0,00 | 1.289 | 10,64 | ||||
| 2026-02-17 | 13F | Engineers Gate Manager LP | 0 | -100,00 | 0 | |||||
| 2026-02-18 | 13F | Mackenzie Financial Corp | 3.612 | 0,00 | 308 | 11,64 | ||||
| 2025-11-12 | 13F | Headlands Technologies LLC | 0 | -100,00 | 0 | |||||
| 2026-02-17 | 13F | Amundi | 8.398 | -15,32 | 710 | 2,90 | ||||
| 2025-11-14 | 13F | Wolverine Trading, Llc | Call | 10.200 | 161,54 | 762 | 211,89 | |||
| 2026-02-04 | 13F | Oregon Public Employees Retirement Fund | 12.799 | 0,79 | 1.082 | 11,56 | ||||
| 2026-02-05 | 13F | Allworth Financial LP | 127 | 19,81 | 11 | 25,00 | ||||
| 2026-02-04 | 13F | Summit Wealth Group Llc / Co | 0 | -100,00 | 0 | -100,00 | ||||
| 2026-02-18 | 13F | State of Tennessee, Treasury Department | 20.179 | -10,72 | 1.582 | -8,40 | ||||
| 2026-02-10 | 13F | CIBC Asset Management Inc | 3.778 | 319 | ||||||
| 2026-02-12 | 13F | Quadrant Capital Group Llc | 20 | -85,07 | 2 | -90,00 | ||||
| 2026-02-09 | 13F | New Age Alpha Advisors, LLC | 53.073 | 1.851,93 | 4.485 | 2.066,18 | ||||
| 2026-02-13 | 13F | SG Capital Management LLC | 136.942 | 11.572 | ||||||
| 2026-04-06 | 13F | GAMMA Investing LLC | 2.002 | 34,45 | 149 | 18,40 | ||||
| 2025-11-14 | 13F | ExodusPoint Capital Management, LP | 0 | -100,00 | 0 | |||||
| 2026-02-17 | 13F | Man Group plc | 21.708 | -0,02 | 1.834 | 10,62 | ||||
| 2026-02-10 | 13F | Intech Investment Management Llc | 26.005 | 8,28 | 2.197 | 19,79 | ||||
| 2026-02-17 | 13F | Balyasny Asset Management Llc | 0 | -100,00 | 0 | -100,00 | ||||
| 2026-02-11 | 13F | LPL Financial LLC | 4.094 | -10,40 | 346 | -0,86 | ||||
| 2026-02-13 | 13F | Kestra Advisory Services, LLC | 313 | 26 | ||||||
| 2026-02-17 | 13F | Royal Bank Of Canada | 4.047 | -96,25 | 342 | -95,85 | ||||
| 2026-02-10 | 13F | Basepoint Wealth LLC | 60 | 5 | ||||||
| 2026-02-12 | 13F | BRYN MAWR TRUST Co | 37.473 | 0,12 | 3.166 | 10,78 | ||||
| 2026-02-10 | 13F | Mutual Of America Capital Management Llc | 6.384 | 1,51 | 539 | 12,29 | ||||
| 2026-02-17 | 13F | Atom Investors LP | 39.810 | 3.364 | ||||||
| 2026-02-13 | 13F | Walleye Capital LLC | 0 | -100,00 | 0 | |||||
| 2026-02-10 | 13F | State of Wyoming | 7.622 | 169,90 | 644 | 199,53 | ||||
| 2026-02-13 | 13F | Walleye Capital LLC | Call | 0 | -100,00 | 0 | ||||
| 2026-04-23 | 13F | Farmers & Merchants Investments Inc | 30 | 0,00 | 2 | 0,00 | ||||
| 2026-02-13 | 13F | Walleye Capital LLC | Put | 0 | -100,00 | 0 | ||||
| 2025-11-14 | 13F | Sherbrooke Park Advisers Llc | 0 | -100,00 | 0 | -100,00 | ||||
| 2026-02-12 | 13F | SMA Capital LLC | 17.000 | 1.436 | ||||||
| 2026-02-17 | 13F | Night Squared LP | 50.024 | 4.227 | ||||||
| 2025-11-12 | 13F | Burgundy Asset Management Ltd. | 844.413 | 1,11 | 63.719 | 21,86 | ||||
| 2026-01-28 | 13F | Universal- Beteiligungs- und Servicegesellschaft mbH | 40.434 | -2,17 | 3.426 | 8,56 | ||||
| 2026-04-15 | 13F | Norden Group Llc | 3.271 | 8,96 | 243 | -3,95 | ||||
| 2026-02-13 | 13F | SRS Capital Advisors, Inc. | 38 | 3 | ||||||
| 2026-01-07 | 13F | Procyon Private Wealth Partners, LLC | 17.006 | 1.437 | ||||||
| 2026-02-13 | 13F | Rice Hall James & Associates, Llc | 35.239 | -0,25 | 2.978 | 10,38 | ||||
| 2026-02-17 | 13F | Ameriprise Financial Inc | 609.873 | -56,79 | 51.534 | -52,19 | ||||
| 2026-02-17 | 13F | Russell Investments Group, Ltd. | 64.748 | 1,68 | 5.471 | 12,50 | ||||
| 2026-04-20 | 13F | Assenagon Asset Management S.A. | 95.072 | -17,19 | 7.071 | -27,12 | ||||
| 2026-02-13 | 13F | Police & Firemen's Retirement System of New Jersey | 15.215 | -3,38 | 1.286 | 6,91 | ||||
| 2025-11-14 | 13F | Scientech Research LLC | 0 | -100,00 | 0 | -100,00 | ||||
| 2026-02-17 | 13F | ISAM Funds (UK) Ltd | 0 | -100,00 | 0 | |||||
| 2026-02-13 | 13F | Stifel Financial Corp | 18.330 | 9,68 | 1.549 | 21,32 | ||||
| 2026-01-23 | 13F | Assetmark, Inc | 856 | -0,47 | 72 | 10,77 | ||||
| 2026-02-13 | 13F | Walleye Trading LLC | Put | 0 | -100,00 | 0 | ||||
| 2026-02-06 | 13F | Handelsbanken Fonder AB | 19.300 | 31,29 | 2 | 0,00 | ||||
| 2025-12-15 | 13F/A | Hudson Bay Capital Management LP | Call | 0 | -100,00 | 0 | -100,00 | |||
| 2026-02-17 | 13F | Lazard Asset Management Llc | 5.461 | -0,04 | 461 | 10,55 | ||||
| 2025-12-15 | 13F/A | Hudson Bay Capital Management LP | Put | 0 | -100,00 | 0 | -100,00 | |||
| 2026-01-28 | 13F | Teacher Retirement System Of Texas | 6.593 | -43,61 | 557 | -37,56 | ||||
| 2026-02-12 | 13F | Voya Investment Management Llc | 276.242 | -43,52 | 23.342 | -37,51 | ||||
| 2025-12-15 | 13F/A | Hudson Bay Capital Management LP | 0 | -100,00 | 0 | -100,00 | ||||
| 2026-02-13 | 13F | National Bank Of Canada /fi/ | 27 | -64,47 | 2 | -60,00 | ||||
| 2026-02-13 | 13F | Great West Life Assurance Co /can/ | 179.419 | 228,08 | 15 | 275,00 | ||||
| 2026-02-11 | 13F | Ameritas Investment Partners, Inc. | 4.594 | 388 | ||||||
| 2026-02-17 | 13F | Bamco Inc /ny/ | 725.542 | 61.308 | ||||||
| 2026-04-20 | 13F | State of Alaska, Department of Revenue | 30.420 | -3,62 | 2 | 0,00 | ||||
| 2026-02-13 | 13F | Macquarie Group Ltd | 0 | -100,00 | 0 | |||||
| 2026-02-05 | 13F | Integrated Investment Consultants, LLC | 61.461 | 0,00 | 5.193 | 10,65 | ||||
| 2026-02-17 | 13F | State Of Wisconsin Investment Board | 8.528 | -11,92 | 721 | -2,57 | ||||
| 2026-01-14 | 13F | Net Worth Advisory Group | 3.672 | 24,73 | 310 | 38,39 |