Grundlæggende statistik
| Institutionelle aktier (lange) | 45.043.884 - 41,95% (ex 13D/G) - change of -6,54MM shares -12,68% MRQ |
| Institutionel værdi (lang) | $ 1.097.273 USD ($1000) |
Institutionelt ejerskab og aktionærer
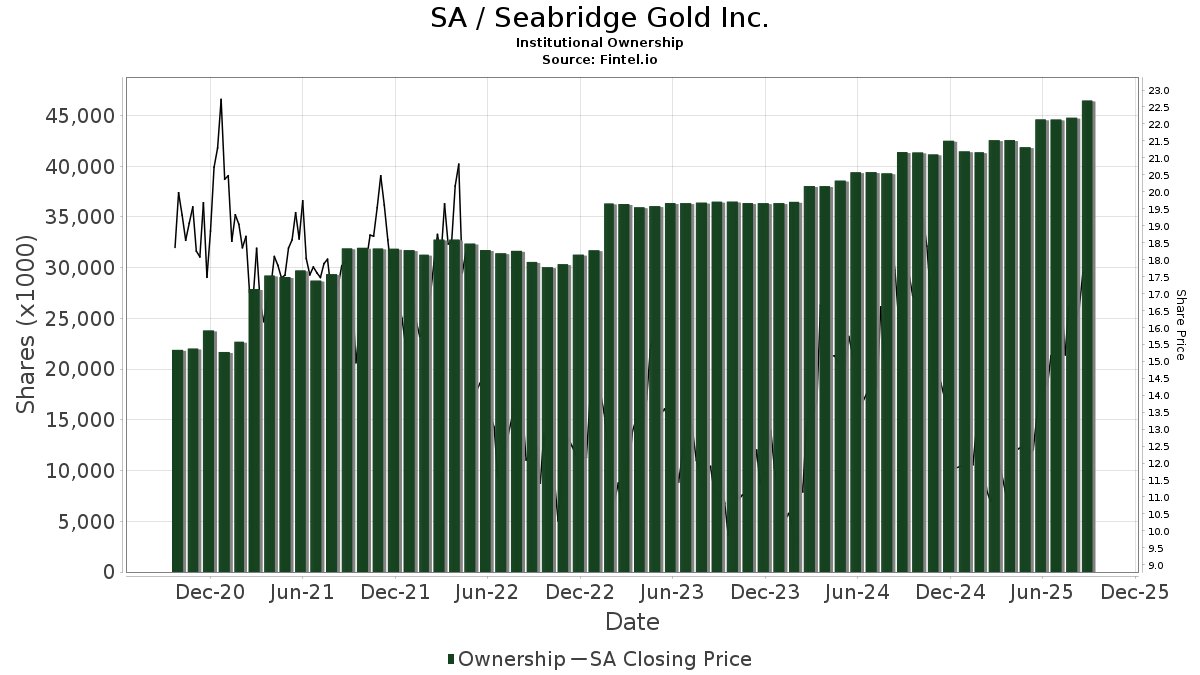
Seabridge Gold Inc. (US:SA) har 197 institutionelle ejere og aktionærer, der har indsendt 13D/G- eller 13F-formularer til Securities Exchange Commission (SEC). Disse institutioner har i alt 45,043,884 aktier. Største aktionærer omfatter Van Eck Associates Corp, Kopernik Global Investors, LLC, Toroso Investments, LLC, Vanguard Group Inc, CIBC World Markets Inc., Ontario Teachers Pension Plan Board, Raymond James Financial Inc, Jane Street Group, Llc, Toronto Dominion Bank, and Citadel Advisors Llc .
Seabridge Gold Inc. (NYSE:SA) institutionel ejerskabsstruktur viser aktuelle positioner i virksomheden efter institutioner og fonde, samt seneste ændringer i positionsstørrelse. Større aktionærer kan omfatte individuelle investorer, investeringsforeninger, hedgefonde eller institutioner. Skema 13D angiver, at investoren besidder (eller besidder) mere end 5 % af virksomheden og har til hensigt (eller har til hensigt at) aktivt at forfølge en ændring i forretningsstrategi. Skema 13G indikerer en passiv investering på over 5%.
The share price as of April 9, 2026 is 32,46 / share. Previously, on April 10, 2025, the share price was 11,16 / share. This represents an increase of 190,86% over that period.
Fondens stemningsscore
Fund Sentiment Score (fka Ownership Accumulation Score) finder de aktier, der bliver mest købt af fonde. Det er resultatet af en sofistikeret, multi-faktor kvantitativ model, der identificerer virksomheder med de højeste niveauer af institutionel akkumulering. Scoringsmodellen bruger en kombination af den samlede stigning i oplyste ejere, ændringerne i porteføljeallokeringer i disse ejere og andre målinger. Tallet går fra 0 til 100, hvor højere tal indikerer et højere niveau af akkumulering for sine jævnaldrende, og 50 er gennemsnittet.
Opdateringsfrekvens: Dagligt
Se Ownership Explorer, som giver en liste over højest rangerende virksomheder.
AI+ Ask Fintel’s AI assistant about Seabridge Gold Inc..
Select a question to share a public post with an AI-crafted answer.
Thinking of good questions…
Institutionel Put/Call-forhold
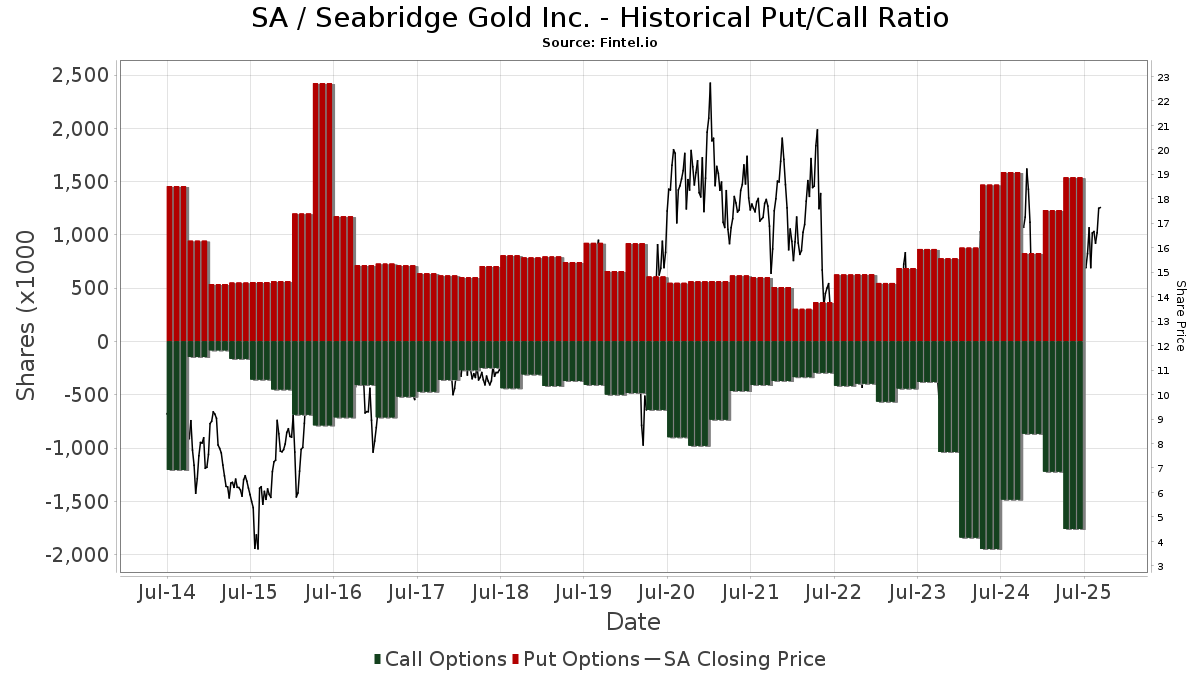
Ud over at indberette standardaktie- og gældsudstedelser skal institutter med mere end 100 mill. aktiver under forvaltning også oplyse deres put- og call-optionsbeholdninger. Da salgsoptioner generelt indikerer negativ stemning, og købsoptioner indikerer positiv stemning, kan vi få en fornemmelse af den overordnede institutionelle stemning ved at plotte forholdet mellem put og kald. Diagrammet til højre viser det historiske put/call-forhold for dette instrument.
Brug af Put/Call Ratio som en indikator for investorernes stemning overvinder en af de vigtigste mangler ved at bruge totalt institutionelt ejerskab, som er, at en betydelig mængde af aktiver under forvaltning investeres passivt for at spore indekser. Passivt forvaltede fonde køber typisk ikke optioner, så indikatoren for put/call-forholdet følger mere nøje følelsen af aktivt forvaltede fonde.
13D/G-arkivering
Vi præsenterer 13D/G ansøgninger separat fra 13F ansøgninger på grund af den forskellige behandling af SEC. 13D/G-ansøgninger kan indgives af grupper af investorer (med én ledende), hvorimod 13F-ansøgninger ikke kan. Dette resulterer i situationer, hvor en investor kan indsende en 13D/G, der rapporterer én værdi for de samlede aktier (der repræsenterer alle de aktier, der ejes af investorgruppen), men derefter indsender en 13F, der rapporterer en anden værdi for de samlede aktier (der udelukkende repræsenterer deres egne) ejendomsret). Det betyder, at aktieejerskab af 13D/G-arkiver og 13F-arkiveringer ofte ikke er direkte sammenlignelige, så vi præsenterer dem separat.
Bemærk: Fra den 16. maj 2021 viser vi ikke længere ejere, der ikke har indsendt en 13D/G inden for det seneste år. Tidligere viste vi den fulde historie af 13D/G-arkiver. Generelt skal enheder, der er forpligtet til at indgive 13D/G-ansøgninger, indgive mindst årligt, før de indsender en afsluttende ansøgning. Dog forlader fonde nogle gange positioner uden at indsende en afsluttende ansøgning (dvs. de afvikler), så visning af den fulde historie resulterede nogle gange i forvirring om det nuværende ejerskab. For at undgå forvirring viser vi nu kun 'aktuelle' ejere - det vil sige - ejere, der har anmeldt inden for det seneste år.
Upgrade to unlock premium data.
| Fil dato | Form | Investor | Forrige Aktier |
Seneste Aktier |
Δ Aktier (Procent) |
Ejendomsret (Procent) |
Δ Ejerskab (Procent) |
|
|---|---|---|---|---|---|---|---|---|
| 2026-02-13 | VAN ECK ASSOCIATES CORP | 8,290,002 | 7,264,903 | -12.37 | 6.95 | -15.66 |
13F og NPORT arkivering
Detaljer om 13F-arkivering er gratis. Detaljer om NP-ansøgninger kræver et premium-medlemskab. Grønne rækker angiver nye positioner. Røde rækker angiver lukkede positioner. Klik på linket ikon for at se den fulde transaktionshistorik.
Opgrader
for at låse premium-data op og eksportere til Excel ![]() .
.
| Fil dato | Kilde | Investor | Type | Gennemsnitlig pris (Øst) |
Aktier | Δ Aktier (%) |
Rapporteret Værdi ($1000) |
Δ Værdi (%) |
Port Alloc (%) |
|
|---|---|---|---|---|---|---|---|---|---|---|
| 2026-01-29 | 13F | UMA Financial Services, Inc. | 3.000 | 0,00 | 89 | 22,22 | ||||
| 2026-02-13 | 13F | Uniting Wealth Partners, LLC | 12.530 | 8,67 | 371 | 33,09 | ||||
| 2026-02-17 | 13F | Public Employees Retirement System Of Ohio | 22.363 | -35,93 | 664 | -21,26 | ||||
| 2026-01-29 | 13F | UBS Group AG | 212.085 | -13,85 | 6.276 | 5,57 | ||||
| 2026-02-13 | 13F | Y-Intercept (Hong Kong) Ltd | 45.065 | 1.333 | ||||||
| 2025-11-14 | 13F | Ubs Asset Management Americas Inc | 0 | -100,00 | 0 | |||||
| 2026-02-04 | 13F | Oxbow Advisors, LLC | 7.935 | 235 | ||||||
| 2026-02-13 | 13F | Kopernik Global Investors, LLC | 6.979.611 | 0,47 | 206.527 | 23,11 | ||||
| 2026-02-17 | 13F | D. E. Shaw & Co., Inc. | Call | 0 | -100,00 | 0 | ||||
| 2026-02-13 | 13F | Barclays Plc | 76.258 | -40,54 | 2.256 | 4,78 | ||||
| 2026-01-27 | 13F | TD Waterhouse Canada Inc. | 3.950 | -1,25 | 117 | 17,17 | ||||
| 2026-02-10 | 13F | CIBC World Markets Inc. | 2.182.535 | 2,41 | 64.712 | 25,91 | ||||
| 2026-02-12 | 13F | Sprott Inc. | 45.715 | 3,58 | 1.353 | 26,95 | ||||
| 2026-02-17 | 13F | Parvin Asset Management, LLC | 266 | 8 | ||||||
| 2026-04-07 | 13F | Signaturefd, Llc | 3.158 | 5,55 | 89 | 1,14 | ||||
| 2026-02-13 | 13F | Clear Street Group Inc. | 875.000 | 0 | ||||||
| 2026-01-21 | 13F | Flagship Harbor Advisors, Llc | 252 | 7 | ||||||
| 2026-02-17 | 13F | Caption Management, LLC | 5.906 | 175 | ||||||
| 2026-03-03 | 13F/A | Caitong International Asset Management Co., Ltd | 5.628 | 167 | ||||||
| 2026-02-17 | 13F | Caption Management, LLC | Call | 2.500 | 74 | |||||
| 2026-02-03 | 13F | We Are One Seven, LLC | Call | 4.000 | 0,00 | 118 | 22,92 | |||
| 2026-01-26 | 13F | Key Capital Management, INC | 100 | 3 | ||||||
| 2026-02-03 | 13F | We Are One Seven, LLC | 51.881 | -5,25 | 1.535 | 16,11 | ||||
| 2026-02-23 | 13F | Wealth Preservation Advisors, LLC | 10.329 | 0,00 | 306 | 22,49 | ||||
| 2026-02-17 | 13F | SIG North Trading, ULC | 47.678 | 19,44 | 1.411 | 46,42 | ||||
| 2026-02-17 | 13F | Creative Planning | 30.282 | 6,39 | 896 | 30,42 | ||||
| 2026-02-13 | 13F | Mariner, LLC | 14.978 | 0,39 | 443 | 23,06 | ||||
| 2026-02-17 | 13F | SIG North Trading, ULC | Put | 51.700 | 338,14 | 1.530 | 438,38 | |||
| 2026-02-17 | 13F | SIG North Trading, ULC | Call | 44.700 | -31,23 | 1.323 | -15,74 | |||
| 2026-02-04 | 13F | LRI Investments, LLC | 442 | 0,00 | 13 | 30,00 | ||||
| 2025-11-14 | 13F | Luminist Capital LLC | 0 | -100,00 | 0 | |||||
| 2026-02-06 | 13F | Leonteq Securities AG | 4.000 | 33,33 | 118 | 63,89 | ||||
| 2026-02-12 | 13F | Bank Of Montreal /can/ | 565.531 | -0,34 | 16.766 | 22,51 | ||||
| 2026-02-03 | 13F | Privium Fund Management B.V. | 23.756 | -50,99 | 703 | -40,00 | ||||
| 2026-01-23 | 13F | Halbert Hargrove Global Advisors, Llc | 3.000 | 89 | ||||||
| 2026-01-30 | 13F | Us Bancorp \de\ | 679 | 0,00 | 20 | 25,00 | ||||
| 2026-02-24 | 13F | Astoria Portfolio Advisors LLC. | 10.263 | -0,01 | 373 | 45,14 | ||||
| 2025-11-14 | 13F | LMR Partners LLP | 0 | -100,00 | 0 | -100,00 | ||||
| 2026-02-12 | 13F | Dimensional Fund Advisors Lp | 484.494 | -11,45 | 14.340 | 8,55 | ||||
| 2026-01-16 | 13F | Ronald Blue Trust, Inc. | 1.654 | 0,00 | 49 | 23,08 | ||||
| 2026-02-06 | 13F | EverSource Wealth Advisors, LLC | 97 | 0,00 | 3 | 0,00 | ||||
| 2026-02-12 | 13F | Nuveen, LLC | 59.493 | 0,00 | 1.766 | 23,07 | ||||
| 2026-02-17 | 13F | Fmr Llc | 433.900 | -26,11 | 12.839 | -9,46 | ||||
| 2026-02-13 | 13F | Parkside Financial Bank & Trust | 60 | 2 | ||||||
| 2026-02-13 | 13F | Public Sector Pension Investment Board | 32.070 | 951 | ||||||
| 2026-02-17 | 13F | Advisor Group Holdings, Inc. | 46.357 | 427,98 | 1.372 | 725,90 | ||||
| 2026-04-07 | 13F | CoreCap Advisors, LLC | 426 | 42,00 | 12 | 50,00 | ||||
| 2026-02-10 | 13F | CIBC Asset Management Inc | 78.019 | 4,08 | 2.314 | 28,20 | ||||
| 2026-02-12 | 13F | Jane Street Group, Llc | 1.150.464 | 47,59 | 34.042 | 80,84 | ||||
| 2026-02-12 | 13F | Jane Street Group, Llc | Call | 150.100 | 172,91 | 4.441 | 234,41 | |||
| 2025-10-10 | 13F | Sound Income Strategies, LLC | 0 | -100,00 | 0 | -100,00 | ||||
| 2026-02-11 | 13F | Parallel Advisors, LLC | 76 | 0,00 | 2 | 100,00 | ||||
| 2026-01-29 | 13F | IMC-Chicago, LLC | 198.407 | 77,33 | 5.871 | 117,25 | ||||
| 2026-02-12 | 13F | Jane Street Group, Llc | Put | 197.900 | 1.246,26 | 5.856 | 1.549,30 | |||
| 2026-01-16 | 13F | FNY Investment Advisers, LLC | 19.209 | 50,07 | 1 | |||||
| 2026-01-29 | 13F | IMC-Chicago, LLC | Put | 273.400 | 144,54 | 8.090 | 199,70 | |||
| 2026-02-17 | 13F | Jones Financial Companies Lllp | 285 | 83,87 | 8 | 166,67 | ||||
| 2026-01-16 | 13F | FNY Investment Advisers, LLC | Call | 305 | 0 | |||||
| 2026-01-29 | 13F | IMC-Chicago, LLC | Call | 326.500 | 33,37 | 9.661 | 63,44 | |||
| 2026-01-29 | 13F | Pictet Asset Management Holding SA | 15.064 | 3,59 | 447 | 27,71 | ||||
| 2026-02-13 | 13F | Toroso Investments, LLC | Call | 46.300 | 1.370 | |||||
| 2026-02-13 | 13F | Toroso Investments, LLC | 4.146.489 | 34,99 | 122.695 | 65,39 | ||||
| 2026-02-18 | 13F | Mackenzie Financial Corp | 94.961 | 73,61 | 2.868 | 117,44 | ||||
| 2026-04-08 | 13F | Fermata Advisors, LLC | 0 | -100,00 | 0 | |||||
| 2026-02-12 | 13F | Quadrant Capital Group Llc | 1.162 | 5,06 | 34 | 30,77 | ||||
| 2026-02-17 | 13F | Prelude Capital Management, Llc | 7.526 | -46,06 | 223 | -33,93 | ||||
| 2026-02-17 | 13F | Alliancebernstein L.p. | 11.200 | 331 | ||||||
| 2026-04-08 | 13F | Wealth Enhancement Advisory Services, Llc | 32.796 | -3,90 | 988 | -9,44 | ||||
| 2026-02-23 | 13F | Beaird Harris Wealth Management, LLC | 524 | 0,00 | 16 | 25,00 | ||||
| 2026-02-17 | 13F | Millennium Management Llc | 448.617 | 37,41 | 13.276 | 68,39 | ||||
| 2026-01-30 | 13F | BancorpSouth Bank | 7.246 | 214 | ||||||
| 2026-02-12 | 13F | Bank Of Montreal /can/ | Call | 180.000 | 0,00 | 5.336 | 22,95 | |||
| 2026-02-12 | 13F | Bank Of Montreal /can/ | Put | 180.700 | 0,39 | 5.357 | 23,43 | |||
| 2026-01-27 | 13F | Zurcher Kantonalbank (Zurich Cantonalbank) | 30.245 | 32,24 | 898 | 62,79 | ||||
| 2026-01-20 | 13F | Thurston, Springer, Miller, Herd & Titak, Inc. | 594 | 725,00 | 18 | 1.600,00 | ||||
| 2026-02-18 | 13F | Caitlin John, LLC | 600 | -53,85 | 18 | -45,16 | ||||
| 2026-02-13 | 13F | SRS Capital Advisors, Inc. | 3.500 | -36,36 | 104 | -21,97 | ||||
| 2025-11-14 | 13F | Schonfeld Strategic Advisors LLC | 0 | -100,00 | 0 | |||||
| 2026-02-17 | 13F | Knoll Capital Management, LLC | 317.003 | 0,00 | 9.380 | 22,53 | ||||
| 2026-02-17 | 13F | Jain Global LLC | 16.200 | 480 | ||||||
| 2025-11-14 | 13F | Brevan Howard Capital Management LP | 0 | -100,00 | 0 | |||||
| 2026-02-11 | 13F | Everett Harris & Co /ca/ | 11.000 | -5,98 | 325 | 15,25 | ||||
| 2026-02-17 | 13F | Susquehanna International Group, Llp | 858.826 | -28,57 | 25.413 | -12,48 | ||||
| 2026-02-17 | 13F | Susquehanna International Group, Llp | Put | 362.500 | 41,16 | 10.726 | 72,97 | |||
| 2026-02-12 | 13F | Swiss National Bank | 161.900 | 2,99 | 4.809 | 26,79 | ||||
| 2026-02-17 | 13F | Susquehanna International Group, Llp | Call | 947.200 | 186,94 | 28.028 | 251,61 | |||
| 2025-11-14 | 13F | Wolverine Trading, Llc | 24.757 | 586 | ||||||
| 2025-11-14 | 13F | Wolverine Trading, Llc | Call | 370.300 | 19,99 | 8.772 | 101,89 | |||
| 2025-11-14 | 13F | Wolverine Trading, Llc | Put | 86.100 | 11,53 | 2.040 | 87,75 | |||
| 2025-11-14 | 13F | Point72 (DIFC) Ltd | 0 | -100,00 | 0 | -100,00 | ||||
| 2026-02-09 | 13F | Legal & General Group Plc | 71.707 | -10,76 | 2.129 | 9,80 | ||||
| 2026-03-05 | 13F | Gunpowder Capital Management, LLC dba Oliver Wealth Management | 266 | 8 | ||||||
| 2026-02-17 | 13F | Toronto Dominion Bank | 1.024.001 | 2,16 | 30.358 | 25,59 | ||||
| 2026-02-13 | 13F | Squarepoint Ops LLC | Call | 10.200 | 302 | |||||
| 2026-02-13 | 13F | Walleye Trading LLC | 266.347 | 144,17 | 7.881 | 199,20 | ||||
| 2026-01-29 | 13F | Nbc Securities, Inc. | 250 | 0,00 | 7 | 16,67 | ||||
| 2026-02-10 | 13F | David R. Rahn & Associates Inc. | 10.300 | 0,00 | 305 | 22,58 | ||||
| 2026-02-13 | 13F | Walleye Trading LLC | Put | 44.100 | 76,40 | 1.305 | 116,25 | |||
| 2026-02-03 | 13F | SBI Securities Co., Ltd. | 307 | 151,64 | 9 | 350,00 | ||||
| 2026-02-13 | 13F | Walleye Trading LLC | Call | 16.400 | -26,13 | 485 | -9,51 | |||
| 2026-02-02 | 13F | PKO Investment Management Joint-Stock Co | 45.000 | 1.336 | ||||||
| 2026-04-02 | 13F | Hilltop National Bank | 187 | 0,00 | 5 | 0,00 | ||||
| 2026-02-02 | 13F | New England Capital Financial Advisors LLC | 101 | 3 | ||||||
| 2026-01-09 | 13F | SG Americas Securities, LLC | 28.123 | -11,56 | 1 | |||||
| 2026-02-13 | 13F | Aviso Financial Inc. | 0 | -100,00 | 0 | |||||
| 2026-02-17 | 13F | Nomura Holdings Inc | 10.000 | 0,00 | 296 | 22,41 | ||||
| 2026-02-11 | 13F | Strategic Advocates LLC | 1 | 0,00 | 0 | |||||
| 2026-01-14 | 13F | ORG Partners LLC | 600 | 60,00 | 18 | 88,89 | ||||
| 2026-01-07 | 13F | Massmutual Trust Co Fsb/adv | 1.970 | 58 | ||||||
| 2026-02-12 | 13F | Alps Advisors Inc | 549.225 | 0,61 | 16.252 | 23,27 | ||||
| 2026-02-13 | 13F | Citigroup Inc | 1 | -99,97 | 0 | -100,00 | ||||
| 2026-02-04 | 13F | Strait & Sound Wealth Management LLC | 130.348 | -1,07 | 3.857 | 21,22 | ||||
| 2026-02-13 | 13F | Charles Schwab Investment Management Inc | 121.274 | 87,19 | 3.600 | 130,26 | ||||
| 2026-02-13 | 13F | Van Eck Associates Corp | 7.153.563 | -12,53 | 212 | 7,11 | ||||
| 2026-01-06 | 13F | Penbrook Management LLC | 95.990 | -0,57 | 2.840 | 21,84 | ||||
| 2026-01-23 | 13F | Optima Capital Llc | 200 | 6 | ||||||
| 2026-02-12 | 13F | Chilton Capital Management Llc | 3.400 | 0,00 | 101 | 21,95 | ||||
| 2026-01-20 | 13F | Toth Financial Advisory Corp | 50 | 1 | ||||||
| 2026-01-29 | 13F | DecisionPoint Financial, LLC | 61 | 0,00 | 2 | 0,00 | ||||
| 2026-02-12 | 13F | Rossby Financial, LCC | 30.150 | -8,36 | 892 | 8,65 | ||||
| 2026-02-10 | 13F | Connor, Clark & Lunn Investment Management Ltd. | 309.653 | 778,80 | 9.180 | 981,15 | ||||
| 2026-02-05 | 13F | Mesirow Financial Investment Management, Inc. | 7.000 | 207 | ||||||
| 2026-02-11 | 13F | Winton Capital Group Ltd | 14.249 | 422 | ||||||
| 2026-03-04 | 13F/A | Savant Capital, LLC | 0 | -100,00 | 0 | |||||
| 2025-11-12 | 13F | Creekmur Asset Management LLC | 599 | 0,00 | 14 | 75,00 | ||||
| 2026-02-17 | 13F | MIRAE ASSET GLOBAL ETFS HOLDINGS Ltd. | 62.840 | 4,38 | 1.859 | 27,94 | ||||
| 2026-02-06 | 13F | Creative Financial Designs Inc /adv | 4.480 | 5,41 | 133 | 29,41 | ||||
| 2026-02-12 | 13F | Federation des caisses Desjardins du Quebec | 1.065 | 77,50 | 31 | 121,43 | ||||
| 2026-02-13 | 13F | Squarepoint Ops LLC | Put | 227.500 | 26,60 | 6.732 | 55,13 | |||
| 2026-02-10 | 13F | Armor Advisors, L.l.c. | 51.132 | -3,78 | 1.513 | 17,85 | ||||
| 2026-02-13 | 13F | Squarepoint Ops LLC | 34.404 | 41,63 | 1.018 | 73,72 | ||||
| 2026-02-17 | 13F | Bank Of America Corp /de/ | 429.506 | -16,36 | 12.709 | 2,48 | ||||
| 2026-02-05 | 13F | Cambridge Investment Research Advisors, Inc. | 24.208 | -11,37 | 1 | |||||
| 2026-02-10 | 13F | Acadian Asset Management Llc | 0 | -100,00 | 0 | |||||
| 2026-02-12 | 13F | BlackRock, Inc. | 377.710 | 5,99 | 11.176 | 29,86 | ||||
| 2026-02-10 | 13F/A | Northwestern Mutual Wealth Management Co | 3.052 | 1,73 | 90 | 25,00 | ||||
| 2026-02-13 | 13F | Walleye Capital LLC | Call | 37.000 | 31,21 | 1.095 | 60,65 | |||
| 2026-02-13 | 13F | Walleye Capital LLC | Put | 116.300 | 160,76 | 3.441 | 219,50 | |||
| 2026-01-27 | 13F | Krilogy Financial LLC | 9.309 | -5,10 | 314 | 43,38 | ||||
| 2026-02-13 | 13F | Walleye Capital LLC | 11.108 | -24,87 | 329 | -8,12 | ||||
| 2026-04-06 | 13F | Versant Capital Management, Inc | 4.000 | 0,00 | 113 | -4,24 | ||||
| 2025-11-12 | 13F | Catalyst Funds Management Pty Ltd | 0 | -100,00 | 0 | -100,00 | ||||
| 2026-02-17 | 13F | Investment Management Corp of Ontario | 10.478 | 310 | ||||||
| 2025-11-13 | 13F | Total Investment Management Inc | 0 | -100,00 | 0 | |||||
| 2026-02-10 | 13F | Goldman Sachs Group Inc | 291.020 | -16,37 | 8.611 | 2,46 | ||||
| 2025-11-14 | 13F | Point72 Asset Management, L.P. | 0 | -100,00 | 0 | -100,00 | ||||
| 2026-02-11 | 13F | Simplex Trading, Llc | 0 | -100,00 | 0 | -100,00 | ||||
| 2025-11-14 | 13F | Skopos Labs, Inc. | 0 | -100,00 | 0 | |||||
| 2026-02-12 | 13F | SWAN Capital LLC | 80 | 2 | ||||||
| 2025-11-04 | 13F | Umb Bank N A/mo | 0 | -100,00 | 0 | |||||
| 2025-11-14 | 13F | XTX Topco Ltd | 0 | -100,00 | 0 | -100,00 | ||||
| 2026-02-19 | 13F | TMB Capital Partners, LLC | 46.153 | 1.366 | ||||||
| 2026-02-17 | 13F | Crawford Fund Management, LLC | 405.743 | -2,56 | 12.006 | 19,38 | ||||
| 2026-02-17 | 13F | DV Trading LLC | 5.328 | 158 | ||||||
| 2026-02-13 | 13F | Sei Investments Co | 104.667 | -23,96 | 3.097 | -6,83 | ||||
| 2026-01-29 | 13F | Sanctuary Advisors, LLC | 18.935 | 560 | ||||||
| 2026-02-11 | 13F | Group One Trading, L.p. | Put | 93.300 | 4,71 | 2.761 | 28,31 | |||
| 2026-02-11 | 13F | Group One Trading, L.p. | 196.987 | -70,11 | 5.829 | -63,39 | ||||
| 2026-02-11 | 13F | Group One Trading, L.p. | Call | 520.300 | 177,20 | 15.396 | 239,70 | |||
| 2026-02-17 | 13F | D. E. Shaw & Co., Inc. | 577.928 | -29,25 | 17.103 | -13,28 | ||||
| 2025-11-10 | 13F | Optiver Holding B.V. | 0 | -100,00 | 0 | |||||
| 2026-02-13 | 13F | Ontario Teachers Pension Plan Board | 1.664.634 | 11,69 | 49.350 | 37,30 | ||||
| 2026-01-30 | 13F | Caldwell Securities, Inc | 0 | -100,00 | 0 | |||||
| 2026-02-17 | 13F | Susquehanna Advisors Group, Inc. | 29.400 | 870 | ||||||
| 2025-11-14 | 13F | Verition Fund Management LLC | 0 | -100,00 | 0 | |||||
| 2025-11-14 | 13F | Paulson & Co. Inc. | 0 | -100,00 | 0 | -100,00 | ||||
| 2025-11-14 | 13F | SummitTX Capital, L.P. | 0 | -100,00 | 0 | |||||
| 2026-01-21 | 13F | Stone House Investment Management, LLC | 294 | 9 | ||||||
| 2026-02-17 | 13F | Perritt Capital Management Inc | 0 | -100,00 | 0 | |||||
| 2026-02-17 | 13F | Amundi | 509.292 | -31,19 | 15.070 | -17,64 | ||||
| 2026-02-10 | 13F | Bnp Paribas Arbitrage, Sa | 2.667 | -29,67 | 79 | -14,29 | ||||
| 2026-02-13 | 13F | National Bank Of Canada /fi/ | 124.168 | -56,22 | 3.670 | -46,05 | ||||
| 2026-02-17 | 13F | Balyasny Asset Management Llc | 20.825 | 616 | ||||||
| 2026-01-07 | 13F | Aventura Private Wealth, LLC | 50 | 1 | ||||||
| 2025-11-13 | 13F | De Lisle Partners LLP | 0 | -100,00 | 0 | |||||
| 2026-02-17 | 13F | Guggenheim Capital Llc | 90.730 | -28,30 | 2.685 | -12,14 | ||||
| 2026-02-17 | 13F | Numerai GP LLC | 14.956 | -59,41 | 443 | -50,28 | ||||
| 2025-11-07 | 13F | Shell Asset Management Co | 1.215 | -72,46 | 0 | |||||
| 2026-02-17 | 13F | Cetera Investment Advisers | 23.470 | 19,47 | 694 | 46,41 | ||||
| 2026-02-17 | 13F | D. E. Shaw & Co., Inc. | Put | 58.900 | -34,85 | 1.743 | -20,20 | |||
| 2026-02-17 | 13F | IHT Wealth Management, LLC | 14.935 | -3,24 | 442 | 18,55 | ||||
| 2026-02-13 | 13F | Manufacturers Life Insurance Company, The | 0 | -100,00 | 0 | |||||
| 2026-02-17 | 13F | Lombard Odier Asset Management (Switzerland) SA | 24.410 | 6.722 | ||||||
| 2026-02-13 | 13F | Baird Financial Group, Inc. | 271.511 | 2,65 | 8.034 | 25,79 | ||||
| 2026-02-11 | 13F | O'shaughnessy Asset Management, Llc | 14.283 | 423 | ||||||
| 2025-11-05 | 13F | Bessemer Group Inc | 0 | -100,00 | 0 | |||||
| 2026-01-28 | 13F | Geneos Wealth Management Inc. | 33.165 | -32,05 | 981 | -16,72 | ||||
| 2026-02-12 | 13F | Steward Partners Investment Advisory, Llc | 1.182 | -5,06 | 35 | 13,33 | ||||
| 2026-02-11 | 13F | MCF Advisors LLC | 65 | 0,00 | 2 | 0,00 | ||||
| 2025-11-13 | 13F | Dynamic Technology Lab Private Ltd | 0 | -100,00 | 0 | |||||
| 2026-01-28 | 13F | U S Global Investors Inc | 40.000 | 0,00 | 1.184 | 22,46 | ||||
| 2026-02-10 | 13F | One Capital Management, LLC | 10.980 | 325 | ||||||
| 2026-02-05 | 13F | Allworth Financial LP | 540 | 43,62 | 16 | 66,67 | ||||
| 2026-02-13 | 13F | Eschler Asset Management LLP | 18.000 | 0,00 | 533 | 22,58 | ||||
| 2025-11-14 | 13F | ExodusPoint Capital Management, LP | 0 | -100,00 | 0 | |||||
| 2026-02-10 | 13F | Waterloo Capital, L.P. | 7.000 | 207 | ||||||
| 2025-11-21 | 13F/A | Tcfg Wealth Management, Llc | 0 | -100,00 | 0 | -100,00 | ||||
| 2026-04-07 | 13F | Farther Finance Advisors, LLC | 3.199 | 15,91 | 97 | 18,52 | ||||
| 2026-02-10 | 13F | Quantbot Technologies LP | 10.126 | -81,31 | 300 | -77,14 | ||||
| 2026-02-12 | 13F | Northwest & Ethical Investments L.P. | 5.179 | 40,39 | 154 | 73,86 | ||||
| 2026-02-18 | 13F | GWM Advisors LLC | 0 | -100,00 | 0 | |||||
| 2026-01-26 | 13F | Nations Financial Group Inc, /ia/ /adv | 310.617 | -5,12 | 9.191 | 16,27 | ||||
| 2026-02-09 | 13F | Harbour Investments, Inc. | 160 | 1,91 | 5 | 33,33 | ||||
| 2026-02-10 | 13F | Td Asset Management Inc | 539.446 | 109,14 | 16.013 | 157,32 | ||||
| 2026-02-04 | 13F | Ameritas Advisory Services, LLC | 0 | -100,00 | 0 | |||||
| 2026-02-06 | 13F | Pnc Financial Services Group, Inc. | 45.333 | 7,51 | 1.341 | 31,73 | ||||
| 2026-04-07 | 13F | U.S. Capital Wealth Advisors, LLC | 0 | -100,00 | 0 | |||||
| 2026-02-17 | 13F | Point72 Asset Management, L.P. | Put | 16.300 | 482 | |||||
| 2026-02-17 | 13F | Ewing Morris & Co. Investment Partners Ltd. | 11.100 | 0,00 | 334 | 24,72 | ||||
| 2026-02-06 | 13F | Banque Cantonale Vaudoise | 1.310 | 39 | ||||||
| 2026-02-17 | 13F | Point72 Asset Management, L.P. | Call | 26.900 | 796 | |||||
| 2026-02-11 | 13F | LPL Financial LLC | 114.075 | 9,01 | 3.375 | 33,56 | ||||
| 2026-02-13 | 13F | BRITISH COLUMBIA INVESTMENT MANAGEMENT Corp | 45.192 | -7,37 | 1.340 | 13,86 | ||||
| 2025-11-05 | 13F | Plante Moran Financial Advisors, LLC | 0 | -100,00 | 0 | |||||
| 2026-02-17 | 13F | Stansberry Asset Management, Llc | 50.401 | 21,37 | 1.491 | 48,80 | ||||
| 2026-02-17 | 13F | Medici Capital Llc | 0 | -100,00 | 0 | |||||
| 2026-02-12 | 13F | Commonwealth Equity Services, Llc | 13.142 | -15,28 | 389 | |||||
| 2026-01-27 | 13F | Atlantic Edge Private Wealth Management, LLC | 50 | 1 | ||||||
| 2026-01-29 | 13F | Vanguard Group Inc | 2.371.496 | 82,86 | 70.305 | 124,73 | ||||
| 2026-02-17 | 13F | Royal Bank Of Canada | 265.192 | -54,29 | 7.847 | -43,99 | ||||
| 2026-02-13 | 13F | Great West Life Assurance Co /can/ | 6.346 | 0,00 | 0 | |||||
| 2026-02-17 | 13F | PDT Partners, LLC | 56.969 | -30,62 | 1.686 | -14,98 | ||||
| 2026-02-10 | 13F | Root Financial Partners, LLC | 5.000 | 0,00 | 148 | 22,50 | ||||
| 2026-02-12 | 13F | Summit Financial, LLC | 160.052 | 0,00 | 4.736 | 22,51 | ||||
| 2025-10-24 | 13F | Godsey & Gibb Associates | 0 | -100,00 | 0 | |||||
| 2026-02-17 | 13F | Tower Research Capital LLC (TRC) | 1.473 | 212,08 | 44 | 290,91 | ||||
| 2025-10-21 | 13F | Global Retirement Partners, LLC | 0 | -100,00 | 0 | |||||
| 2026-02-06 | 13F | IFP Advisors, Inc | 253 | -27,09 | 7 | -12,50 | ||||
| 2026-02-13 | 13F | Diametric Capital, LP | 37.935 | -2,09 | 1.122 | 20,00 | ||||
| 2026-02-05 | 13F | Everstar Asset Management, LLC | 76.608 | 489,29 | 2.267 | 623,96 | ||||
| 2026-02-13 | 13F | Morgan Stanley | 650.841 | 39,27 | 19.258 | 70,65 | ||||
| 2026-01-14 | 13F | Elevatus Welath Management | 105.862 | -30,45 | 3.132 | -14,78 | ||||
| 2025-11-13 | 13F | Macquarie Group Ltd | 0 | -100,00 | 0 | |||||
| 2026-01-26 | 13F | Cwm, Llc | 27.826 | 4,41 | 1 | |||||
| 2026-02-12 | 13F | Hrt Financial Lp | 73.304 | 2 | ||||||
| 2026-02-17 | 13F | Citadel Advisors Llc | Put | 836.800 | 51,51 | 24.761 | 85,64 | |||
| 2026-02-17 | 13F | Citadel Advisors Llc | Call | 365.500 | 53,89 | 10.815 | 88,58 | |||
| 2026-02-17 | 13F | Van Den Berg Management I, Inc | 707.390 | -4,79 | 20.932 | 16,65 | ||||
| 2026-01-20 | 13F | AdvisorNet Financial, Inc | 2.453 | 5,01 | 73 | 28,57 | ||||
| 2026-02-17 | 13F | Citadel Advisors Llc | 978.868 | 60,26 | 28.965 | 96,37 | ||||
| 2026-04-02 | 13F | Marex Group plc | 25.363 | 45,76 | 296 | 48,99 | ||||
| 2025-11-21 | 13F | Nebula Research & Development LLC | 0 | -100,00 | 0 | |||||
| 2026-02-11 | 13F | Jpmorgan Chase & Co | 206 | 0,00 | 6 | 50,00 | ||||
| 2026-02-12 | 13F | Walled Lake Planning & Wealth Management, Llc | 16.095 | 476 | ||||||
| 2026-02-13 | 13F | Sofos Investments, Inc. | 1.000 | 30 | ||||||
| 2026-02-13 | 13F | Wells Fargo & Company/mn | 52.231 | 441,37 | 1.546 | 565,95 | ||||
| 2025-11-14 | 13F | Point72 Asia (Singapore) Pte. Ltd. | 0 | -100,00 | 0 | |||||
| 2026-02-13 | 13F | Hatch Cove Capital, Llc | 127.300 | 5.180 | ||||||
| 2026-02-11 | 13F | Deutsche Bank Ag\ | 482.410 | 6,78 | 14.275 | 30,83 | ||||
| 2026-02-17 | 13F | Trexquant Investment LP | 0 | -100,00 | 0 | |||||
| 2026-02-17 | 13F | Russell Investments Group, Ltd. | 457.828 | -34,25 | 13.570 | -19,26 | ||||
| 2025-11-14 | 13F | Aigen Investment Management, Lp | 0 | -100,00 | 0 | |||||
| 2026-02-11 | 13F | Fox Run Management, L.l.c. | 8.728 | 258 | ||||||
| 2026-02-12 | 13F | CIBC Private Wealth Group, LLC | 1.706 | 274,12 | 50 | 354,55 | ||||
| 2026-02-13 | 13F | Kestra Advisory Services, LLC | 5.177 | 153 | ||||||
| 2026-02-23 | 13F | Virtu Financial LLC | 14.555 | 0 | ||||||
| 2026-02-06 | 13F | Profund Advisors Llc | 8.743 | -15,35 | 259 | 3,61 | ||||
| 2025-11-12 | 13F | Stifel Financial Corp | 0 | -100,00 | 0 | |||||
| 2025-10-16 | 13F | City State Bank | 0 | -100,00 | 0 | |||||
| 2026-02-11 | 13F | Simplex Trading, Llc | Call | 319.100 | 34,64 | 9.442 | 188.740,00 | |||
| 2026-02-09 | 13F | Cary Street Partners Financial Llc | 7.120 | 211 | ||||||
| 2026-02-11 | 13F | Simplex Trading, Llc | Put | 44.100 | 67,05 | 1.305 | ||||
| 2026-02-13 | 13F | Smartleaf Asset Management LLC | 1.000 | 30 | ||||||
| 2026-02-14 | 13F | Rockefeller Capital Management L.P. | 53.673 | 7.567,57 | 1.588 | 9.825,00 | ||||
| 2026-02-17 | 13F | Advisory Services Network, LLC | 0 | -100,00 | 0 | |||||
| 2026-02-17 | 13F | Advisor Group Holdings, Inc. | Call | 0 | -100,00 | 0 | ||||
| 2026-02-17 | 13F | Raymond James Financial Inc | Call | 21.700 | 0,00 | 326 | 0,00 | |||
| 2026-02-09 | 13F | Geode Capital Management, Llc | 58.027 | 12,82 | 1.755 | 40,63 | ||||
| 2026-02-13 | 13F | Peak6 Llc | Put | 36.000 | 0,00 | 1.065 | 22,55 | |||
| 2026-02-17 | 13F | Raymond James Financial Inc | 1.364.262 | 0,50 | 40.369 | 23,13 | ||||
| 2026-02-13 | 13F | Peak6 Llc | 109.686 | 3.246 | ||||||
| 2026-02-17 | 13F | Tudor Investment Corp Et Al | Put | 9.200 | 272 | |||||
| 2026-02-13 | 13F | Peak6 Llc | Call | 6.600 | -96,47 | 195 | -95,68 | |||
| 2026-02-13 | 13F | Marshall Wace, Llp | 0 | -100,00 | 0 | |||||
| 2026-02-09 | 13F | Bleakley Financial Group, LLC | 159.207 | 29,90 | 4.711 | 59,18 | ||||
| 2026-02-06 | 13F | HighTower Advisors, LLC | 8.644 | 256 | ||||||
| 2026-02-06 | 13F | GPS Wealth Strategies Group, LLC | 0 | -100,00 | 0 | |||||
| 2026-02-13 | 13F | Evelyn Partners Asset Management Ltd | 1.500 | 0,00 | 44 | 22,22 |