Grundlæggende statistik
| Institutionelle ejere | 109 total, 109 long only, 0 short only, 0 long/short - change of 0,00% MRQ |
| Gennemsnitlig porteføljeallokering | 0.0754 % - change of -4,37% MRQ |
| Institutionelle aktier (lange) | 3.058.403 (ex 13D/G) - change of -0,05MM shares -1,61% MRQ |
| Institutionel værdi (lang) | $ 85.631 USD ($1000) |
Institutionelt ejerskab og aktionærer
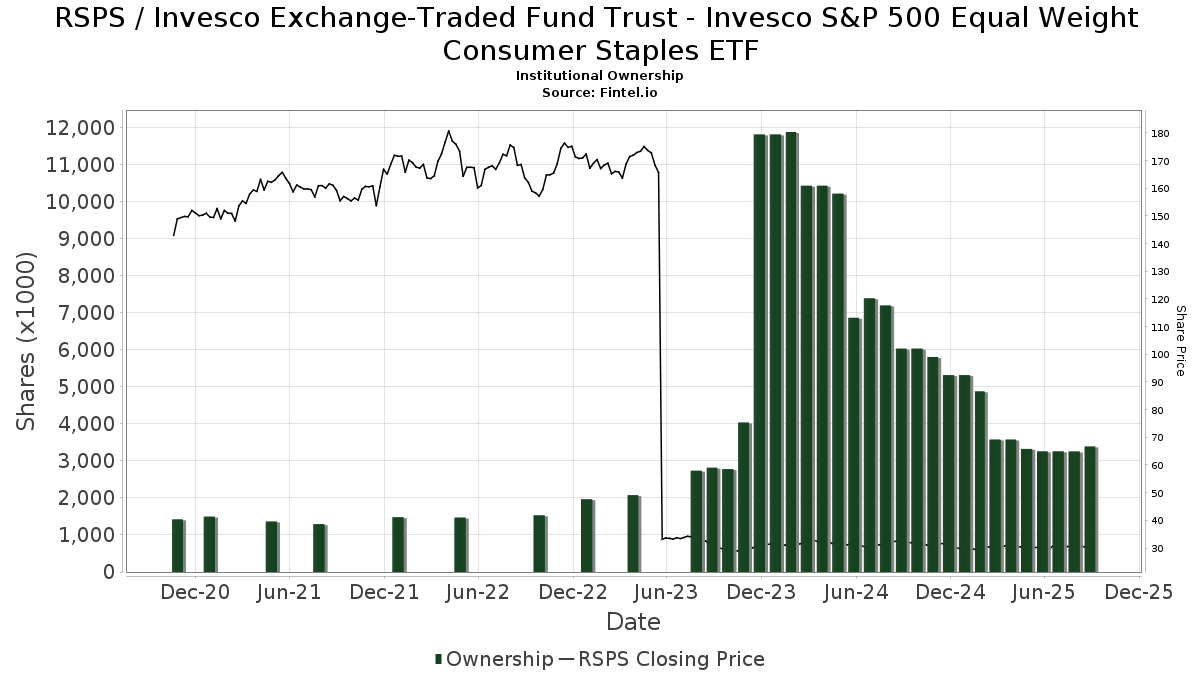
Invesco Exchange-Traded Fund Trust - Invesco S&P 500 Equal Weight Consumer Staples ETF (US:RSPS) har 109 institutionelle ejere og aktionærer, der har indsendt 13D/G- eller 13F-formularer til Securities Exchange Commission (SEC). Disse institutioner har i alt 3,058,403 aktier. Største aktionærer omfatter Bank Of America Corp /de/, Morgan Stanley, HighTower Advisors, LLC, LPL Financial LLC, UBS Group AG, Cetera Investment Advisers, First International Bank of Israel Ltd., Ameriprise Financial Inc, Two Sigma Investments, Lp, and Envestnet Asset Management Inc .
Invesco Exchange-Traded Fund Trust - Invesco S&P 500 Equal Weight Consumer Staples ETF (ARCA:RSPS) institutionel ejerskabsstruktur viser aktuelle positioner i virksomheden efter institutioner og fonde, samt seneste ændringer i positionsstørrelse. Større aktionærer kan omfatte individuelle investorer, investeringsforeninger, hedgefonde eller institutioner. Skema 13D angiver, at investoren besidder (eller besidder) mere end 5 % af virksomheden og har til hensigt (eller har til hensigt at) aktivt at forfølge en ændring i forretningsstrategi. Skema 13G indikerer en passiv investering på over 5%.
The share price as of April 17, 2026 is 29,65 / share. Previously, on April 21, 2025, the share price was 30,32 / share. This represents a decline of 2,21% over that period.
Fondens stemningsscore
Fund Sentiment Score (fka Ownership Accumulation Score) finder de aktier, der bliver mest købt af fonde. Det er resultatet af en sofistikeret, multi-faktor kvantitativ model, der identificerer virksomheder med de højeste niveauer af institutionel akkumulering. Scoringsmodellen bruger en kombination af den samlede stigning i oplyste ejere, ændringerne i porteføljeallokeringer i disse ejere og andre målinger. Tallet går fra 0 til 100, hvor højere tal indikerer et højere niveau af akkumulering for sine jævnaldrende, og 50 er gennemsnittet.
Opdateringsfrekvens: Dagligt
Se Ownership Explorer, som giver en liste over højest rangerende virksomheder.
AI+ Ask Fintel’s AI assistant about Invesco Exchange-Traded Fund Trust - Invesco S&P 500 Equal Weight Consumer Staples ETF.
Select a question to share a public post with an AI-crafted answer.
Thinking of good questions…
Institutionel Put/Call-forhold
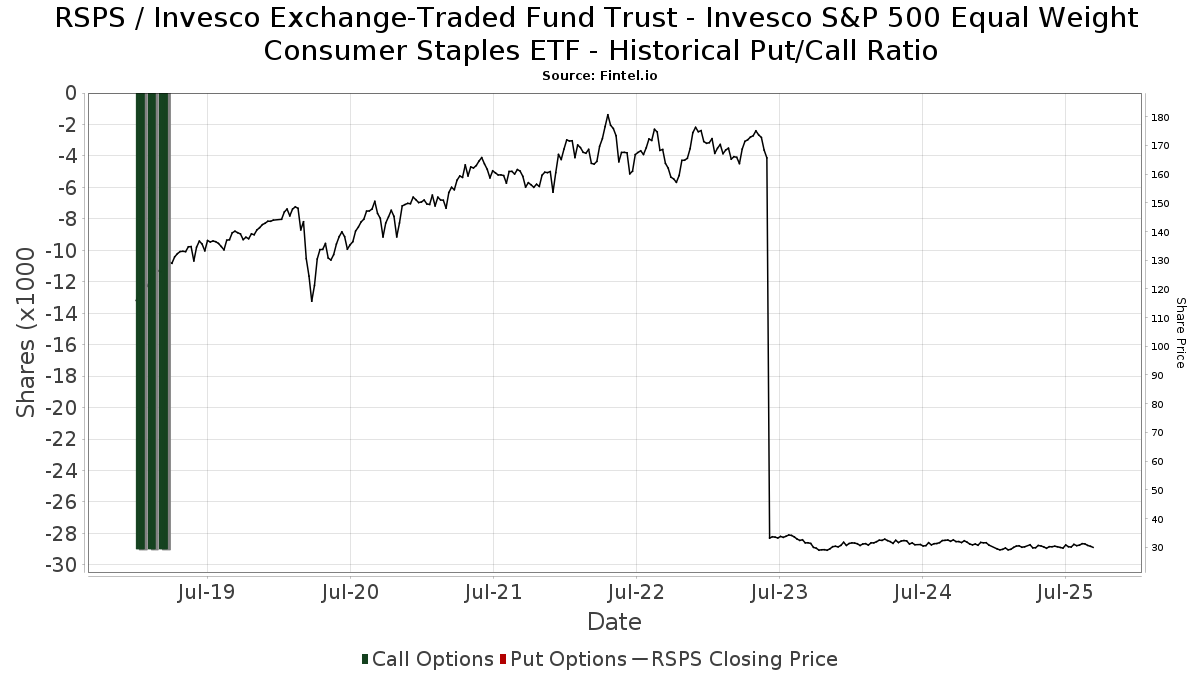
Ud over at indberette standardaktie- og gældsudstedelser skal institutter med mere end 100 mill. aktiver under forvaltning også oplyse deres put- og call-optionsbeholdninger. Da salgsoptioner generelt indikerer negativ stemning, og købsoptioner indikerer positiv stemning, kan vi få en fornemmelse af den overordnede institutionelle stemning ved at plotte forholdet mellem put og kald. Diagrammet til højre viser det historiske put/call-forhold for dette instrument.
Brug af Put/Call Ratio som en indikator for investorernes stemning overvinder en af de vigtigste mangler ved at bruge totalt institutionelt ejerskab, som er, at en betydelig mængde af aktiver under forvaltning investeres passivt for at spore indekser. Passivt forvaltede fonde køber typisk ikke optioner, så indikatoren for put/call-forholdet følger mere nøje følelsen af aktivt forvaltede fonde.
13F og NPORT arkivering
Detaljer om 13F-arkivering er gratis. Detaljer om NP-ansøgninger kræver et premium-medlemskab. Grønne rækker angiver nye positioner. Røde rækker angiver lukkede positioner. Klik på linket ikon for at se den fulde transaktionshistorik.
Opgrader
for at låse premium-data op og eksportere til Excel ![]() .
.
| Fil dato | Kilde | Investor | Type | Gennemsnitlig pris (Øst) |
Aktier | Δ Aktier (%) |
Rapporteret Værdi ($1000) |
Δ Værdi (%) |
Port Alloc (%) |
|
|---|---|---|---|---|---|---|---|---|---|---|
| 2026-02-02 | 13F | Fifth Third Bancorp | 275 | 0,00 | 8 | -12,50 | ||||
| 2026-02-06 | 13F | Pnc Financial Services Group, Inc. | 8.410 | 0,00 | 244 | -0,41 | ||||
| 2026-01-20 | 13F | Fearless Solutions, LLC dba Best Invest | 10.500 | 0,00 | 305 | -0,65 | ||||
| 2026-02-12 | 13F | Sykon Capital Llc | 42.636 | 1.238 | ||||||
| 2026-01-27 | 13F | Optas, LLC | 8.734 | 0,00 | 254 | -0,78 | ||||
| 2026-02-05 | 13F | Cambridge Investment Research Advisors, Inc. | 57.351 | -3,90 | 2 | 0,00 | ||||
| 2026-01-22 | 13F | Yoder Wealth Management, Inc. | 32.491 | 2,73 | 943 | 2,06 | ||||
| 2026-02-09 | 13F | Cary Street Partners Financial Llc | 9.017 | 22,40 | 262 | 21,40 | ||||
| 2026-02-12 | 13F | Stelac Advisory Services LLC | 52.358 | 0,00 | 1.520 | -0,72 | ||||
| 2026-02-17 | 13F | Bank Of America Corp /de/ | 258.109 | 2,58 | 7.492 | 1,88 | ||||
| 2025-11-05 | 13F | Fortune Financial Advisors, LLC | 0 | -100,00 | 0 | |||||
| 2026-02-03 | 13F | Retirement Planning Group | 7.479 | 0,00 | 217 | -0,46 | ||||
| 2026-02-17 | 13F | Cape Investment Advisory, Inc. | 343 | 10 | ||||||
| 2026-02-10 | 13F | Lido Advisors, LLC | 13.695 | 0,00 | 400 | 0,00 | ||||
| 2026-02-17 | 13F | Fmr Llc | 4.773 | -9,17 | 139 | -9,80 | ||||
| 2025-10-30 | 13F | Twin Peaks Wealth Advisors, LLC | 0 | -100,00 | 0 | |||||
| 2026-02-13 | 13F | Morgan Stanley | 203.347 | 12,07 | 5.902 | 11,32 | ||||
| 2026-01-16 | 13F | Walker Asset Management, LLC | 17.462 | 0,45 | 507 | -0,39 | ||||
| 2026-02-11 | 13F | Fortune Financial Group, Inc. | 12.794 | 0 | ||||||
| 2026-04-15 | 13F | Planning Directions Inc | 21.610 | -6,46 | 637 | -4,93 | ||||
| 2026-02-17 | 13F | Susquehanna International Group, Llp | 58.452 | 487,63 | 1.697 | 484,83 | ||||
| 2026-02-12 | 13F | Founders Financial Alliance, LLC | 242 | 0,00 | 7 | 0,00 | ||||
| 2026-01-28 | 13F | Joseph P. Lucia & Associates, LLC | 50.980 | -1,45 | 1.480 | -2,12 | ||||
| 2026-02-06 | 13F | Csenge Advisory Group | 0 | -100,00 | 0 | |||||
| 2026-02-17 | 13F | Creative Planning | 7.866 | -24,08 | 228 | -24,50 | ||||
| 2026-01-29 | 13F | Live Oak Investment Partners | 0 | -100,00 | 0 | |||||
| 2026-02-17 | 13F | Mercer Global Advisors Inc /adv | 9.105 | 0,05 | 264 | -0,38 | ||||
| 2026-02-13 | 13F | Kirtland Hills Capital Management, Llc | 0 | -100,00 | 0 | |||||
| 2026-02-05 | 13F | AlphaCore Capital LLC | 40 | -50,00 | 1 | -50,00 | ||||
| 2026-02-14 | 13F | Howe & Rusling Inc | 2.089 | 0,29 | 61 | 0,00 | ||||
| 2025-11-13 | 13F | Glenmede Investment Management, LP | 400 | 0,00 | 12 | 0,00 | ||||
| 2026-02-11 | 13F | Parallel Advisors, LLC | 145 | 0,00 | 4 | 0,00 | ||||
| 2026-02-06 | 13F | Empirical Asset Management, LLC | 7.360 | -2,71 | 214 | -3,62 | ||||
| 2026-04-17 | 13F | Weaver Capital Management LLC | 6.884 | 0,00 | 203 | 2,01 | ||||
| 2026-02-13 | 13F | Stifel Financial Corp | 16.183 | 470 | ||||||
| 2026-02-10 | 13F | Envestnet Asset Management Inc | 89.934 | -15,51 | 2.610 | -16,08 | ||||
| 2026-02-09 | 13F | Huntington National Bank | 0 | |||||||
| 2026-02-17 | 13F | Advisory Services Network, LLC | 0 | -100,00 | 0 | |||||
| 2026-04-14 | 13F | Focus Financial Network, Inc. | 11.035 | -20,59 | 326 | -19,35 | ||||
| 2025-11-12 | 13F | Blackston Financial Advisory Group, LLC | 0 | -100,00 | 0 | |||||
| 2025-11-12 | 13F | Principal Securities, Inc. | 0 | -100,00 | 0 | -100,00 | ||||
| 2026-04-20 | 13F | Friedenthal Financial | 57.517 | 4,53 | 1.697 | 6,20 | ||||
| 2025-11-10 | 13F | Avalon Trust Co | 0 | -100,00 | 0 | |||||
| 2026-02-11 | 13F | O'shaughnessy Asset Management, Llc | 2.529 | -59,49 | 73 | -59,89 | ||||
| 2026-02-13 | 13F | Atlas Capital Advisors Llc | 0 | -100,00 | 0 | |||||
| 2026-02-17 | 13F | Raymond James Financial Inc | 10.480 | 1,40 | 304 | 0,66 | ||||
| 2026-04-17 | 13F | Wealthbridge Capital Management, Llc | 58.690 | -2,07 | 1.731 | -0,46 | ||||
| 2026-04-16 | 13F | Sunbeam Capital Management, LLC | 22.423 | 661 | ||||||
| 2026-02-06 | 13F | HighTower Advisors, LLC | 190.635 | -12,21 | 5.533 | -12,81 | ||||
| 2026-02-03 | 13F | Costello Asset Management, INC | 1.176 | 0,68 | 34 | 0,00 | ||||
| 2026-02-06 | 13F | GPS Wealth Strategies Group, LLC | 0 | -100,00 | 0 | |||||
| 2026-02-17 | 13F | Ameriprise Financial Inc | 97.187 | -3,44 | 2.821 | -4,11 | ||||
| 2026-02-06 | 13F | Advisory Alpha, LLC | 0 | -100,00 | 0 | |||||
| 2026-02-13 | 13F | Mariner, LLC | 24.808 | -2,03 | 720 | -2,70 | ||||
| 2026-02-12 | 13F | CIBC Private Wealth Group, LLC | 4.935 | 0,00 | 143 | -0,69 | ||||
| 2026-02-13 | 13F | Kestra Advisory Services, LLC | 0 | -100,00 | 0 | |||||
| 2026-01-26 | 13F | AE Wealth Management LLC | 1.235 | -9,59 | 36 | -10,26 | ||||
| 2026-04-17 | 13F | HHM Wealth Advisors, LLC | 2.600 | 0,00 | 77 | 1,33 | ||||
| 2026-02-02 | 13F | Truist Financial Corp | 55.028 | -19,53 | 1.597 | -20,07 | ||||
| 2026-02-11 | 13F | LPL Financial LLC | 186.925 | -10,62 | 5.425 | -11,23 | ||||
| 2026-04-07 | 13F | Farther Finance Advisors, LLC | 45.275 | -1,41 | 1.327 | -0,38 | ||||
| 2026-02-05 | 13F | Hills Bank & Trust Co | 16.644 | 483 | ||||||
| 2026-02-06 | 13F | Global Retirement Partners, LLC | 5.626 | 0,70 | 163 | 0,00 | ||||
| 2026-02-10 | 13F/A | Northwestern Mutual Wealth Management Co | 2.438 | -8,41 | 71 | -9,09 | ||||
| 2026-02-17 | 13F | Two Sigma Investments, Lp | 95.200 | 37,57 | 2.763 | 36,65 | ||||
| 2026-02-17 | 13F | Quantinno Capital Management LP | 21.114 | 0,00 | 613 | -0,81 | ||||
| 2026-01-20 | 13F | Coastal Investment Advisors, Inc. | 166 | 0,61 | 5 | 0,00 | ||||
| 2026-02-06 | 13F | Envestnet Portfolio Solutions, Inc. | 8.762 | 254 | ||||||
| 2026-02-03 | 13F | Grimes & Company, Inc. | 0 | -100,00 | 0 | |||||
| 2026-04-20 | 13F | SILVER OAK SECURITIES, Inc | 16.150 | 0,00 | 476 | 1,06 | ||||
| 2026-02-05 | 13F | Allworth Financial LP | 7.946 | 4,22 | 231 | 3,60 | ||||
| 2026-02-04 | 13F | Ameritas Advisory Services, LLC | 0 | -100,00 | 0 | |||||
| 2026-01-28 | 13F | Geneos Wealth Management Inc. | 2.750 | 0,00 | 80 | -1,25 | ||||
| 2025-11-04 | 13F | Legend Financial Advisors, Inc. | 0 | -100,00 | 0 | |||||
| 2026-02-10 | 13F | Thoroughbred Financial Services, Llc | 11.970 | -28,52 | 0 | |||||
| 2026-02-17 | 13F | Jones Financial Companies Lllp | 8.253 | 15,85 | 240 | 16,02 | ||||
| 2026-02-12 | 13F | Jane Street Group, Llc | 12.366 | 359 | ||||||
| 2026-02-13 | 13F | Sofos Investments, Inc. | 20 | 0,00 | 1 | |||||
| 2026-02-17 | 13F | Cetera Investment Advisers | 175.768 | 66,49 | 5.102 | 65,35 | ||||
| 2026-02-12 | 13F | Kovack Advisors, Inc. | 11.039 | 12,93 | 323 | 12,98 | ||||
| 2026-04-15 | 13F | Consolidated Capital Management, Llc | 0 | -100,00 | 0 | |||||
| 2026-02-17 | 13F | Private Advisor Group, LLC | 34.084 | -8,29 | 989 | -8,93 | ||||
| 2026-02-17 | 13F | Green Harvest Asset Management LLC | 15.472 | 0,00 | 449 | -0,66 | ||||
| 2026-01-21 | 13F | Capital Investment Advisory Services, LLC | 500 | 0,00 | 15 | 0,00 | ||||
| 2025-11-20 | 13F | Asset Dedication, LLC | 0 | -100,00 | 0 | -100,00 | ||||
| 2026-04-15 | 13F | Bright Futures Wealth Management, LLC. | 7.265 | 214 | ||||||
| 2026-02-17 | 13F | Cahill Financial Advisors Inc | 41.085 | 0,20 | 1.192 | -0,50 | ||||
| 2026-02-17 | 13F | Citadel Advisors Llc | 0 | -100,00 | 0 | |||||
| 2026-02-17 | 13F | Glenmede Trust Co Na | 400 | 12 | ||||||
| 2025-11-07 | 13F | Ballast, Inc. | 0 | -100,00 | 0 | -100,00 | ||||
| 2026-02-10 | 13F | Goldman Sachs Group Inc | 0 | -100,00 | 0 | |||||
| 2025-11-14 | 13F | Eqis Capital Management, Inc. | 0 | -100,00 | 0 | |||||
| 2026-04-15 | 13F | QTR Family Wealth, LLC | 10.978 | -2,21 | 321 | -11,81 | ||||
| 2026-02-12 | 13F | Commonwealth Equity Services, Llc | 28.270 | -42,89 | 821 | 81.900,00 | ||||
| 2026-04-06 | 13F | CX Institutional | 11.840 | 202,43 | 0 | |||||
| 2026-02-09 | 13F | Harbour Investments, Inc. | 9.340 | -11,21 | 271 | -11,73 | ||||
| 2026-01-30 | 13F | Bogart Wealth, LLC | 631 | 0,80 | 18 | 0,00 | ||||
| 2026-02-17 | 13F | Advisor Group Holdings, Inc. | 43.452 | 0,97 | 1.261 | -2,17 | ||||
| 2026-02-13 | 13F | Wells Fargo & Company/mn | 12.420 | 33,48 | 361 | 32,84 | ||||
| 2026-02-18 | 13F | GWM Advisors LLC | 710 | 0,00 | 21 | 0,00 | ||||
| 2026-04-08 | 13F | First Heartland Consultants, Inc. | 17.303 | -15,63 | 510 | -14,29 | ||||
| 2026-01-29 | 13F | Comerica Bank | 210 | 0,00 | 6 | 0,00 | ||||
| 2026-02-17 | 13F | Royal Bank Of Canada | 14.323 | 11,77 | 415 | 10,96 | ||||
| 2026-04-07 | 13F | U.S. Capital Wealth Advisors, LLC | 12.497 | -11,13 | 369 | -9,80 | ||||
| 2026-01-26 | 13F | Cwm, Llc | 3.518 | 302,06 | 0 | |||||
| 2026-02-04 | 13F | Tsfg, Llc | 14.400 | -1,64 | 0 | |||||
| 2026-01-14 | 13F | Jfs Wealth Advisors, Llc | 815 | 0,87 | 24 | 0,00 | ||||
| 2026-02-17 | 13F | Tower Research Capital LLC (TRC) | 0 | -100,00 | 0 | |||||
| 2026-02-17 | 13F | Qube Research & Technologies Ltd | 272 | 0,00 | 8 | 0,00 | ||||
| 2026-04-10 | 13F | Private Wealth Group, LLC | 14.118 | 0,00 | 416 | 1,71 | ||||
| 2026-01-22 | 13F | Brookwood Investment Group LLC | 14.240 | -0,35 | 413 | -0,96 | ||||
| 2026-04-16 | 13F | Redstone Wealth Management, Llc | 21.370 | -8,46 | 630 | -6,94 | ||||
| 2026-02-14 | 13F | Rockefeller Capital Management L.P. | 318 | 0,63 | 9 | 0,00 | ||||
| 2026-02-17 | 13F | Blair William & Co/il | 175 | 0,00 | 5 | 0,00 | ||||
| 2026-01-23 | 13F | Carnegie Capital Asset Management, LLC | 8.485 | 246 | ||||||
| 2026-04-09 | 13F | DHJJ Financial Advisors, Ltd. | 31.718 | -8,74 | 936 | -7,24 | ||||
| 2026-04-15 | 13F | Sage Capital Management, LLC | 10.527 | -10,36 | 311 | -8,82 | ||||
| 2026-01-16 | 13F | Ronald Blue Trust, Inc. | 0 | -100,00 | 0 | |||||
| 2026-01-29 | 13F | Dunhill Financial, LLC | 215 | 0,00 | 6 | 0,00 | ||||
| 2026-02-05 | 13F | Pacific Sun Financial Corp | 55.895 | -9,09 | 1.622 | -9,69 | ||||
| 2026-02-27 | 13F | Strategic Investment Solutions, Inc. /IL | 145 | 0,00 | 4 | 0,00 | ||||
| 2026-01-26 | 13F | Private Trust Co Na | 6.720 | 0,00 | 195 | -0,51 | ||||
| 2026-02-11 | 13F | Capital Analysts, Inc. | 610 | 0,00 | 0 | |||||
| 2026-02-09 | 13F | Hartland & Co., LLC | 32.578 | 946 | ||||||
| 2026-04-07 | 13F | CoreCap Advisors, LLC | 3.270 | 643,18 | 96 | 700,00 | ||||
| 2026-02-11 | 13F | Jpmorgan Chase & Co | 79.015 | 0,94 | 2.293 | 0,26 | ||||
| 2026-01-29 | 13F | UBS Group AG | 177.284 | -39,13 | 5.146 | -39,55 | ||||
| 2026-01-15 | 13F | Royal Fund Management, LLC | 13.541 | 393 | ||||||
| 2025-11-10 | 13F | Koshinski Asset Management, Inc. | 0 | -100,00 | 0 | |||||
| 2026-02-12 | 13F | First International Bank of Israel Ltd. | 98.000 | 0,00 | 2.844 | -0,70 | ||||
| 2026-02-17 | 13F | Strive Financial Group ,LLC | 6.593 | 191 | ||||||
| 2026-02-17 | 13F | Vista Investment Management | 8.917 | -29,81 | 259 | -30,46 | ||||
| 2026-02-05 | 13F | Stonebridge Financial Planning Group, LLC | 13.498 | -11,89 | 392 | -12,53 | ||||
| 2026-01-27 | 13F | Elevated Capital Advisors, LLC | 80 | 2 | ||||||
| 2026-02-13 | 13F | MAI Capital Management | 1.552 | -2,63 | 45 | -2,17 |