Grundlæggende statistik
| Institutionelle ejere | 145 total, 145 long only, 0 short only, 0 long/short - change of -1,36% MRQ |
| Gennemsnitlig porteføljeallokering | 0.2949 % - change of -0,68% MRQ |
| Institutionelle aktier (lange) | 13.150.531 (ex 13D/G) - change of 4,39MM shares 50,08% MRQ |
| Institutionel værdi (lang) | $ 740.538 USD ($1000) |
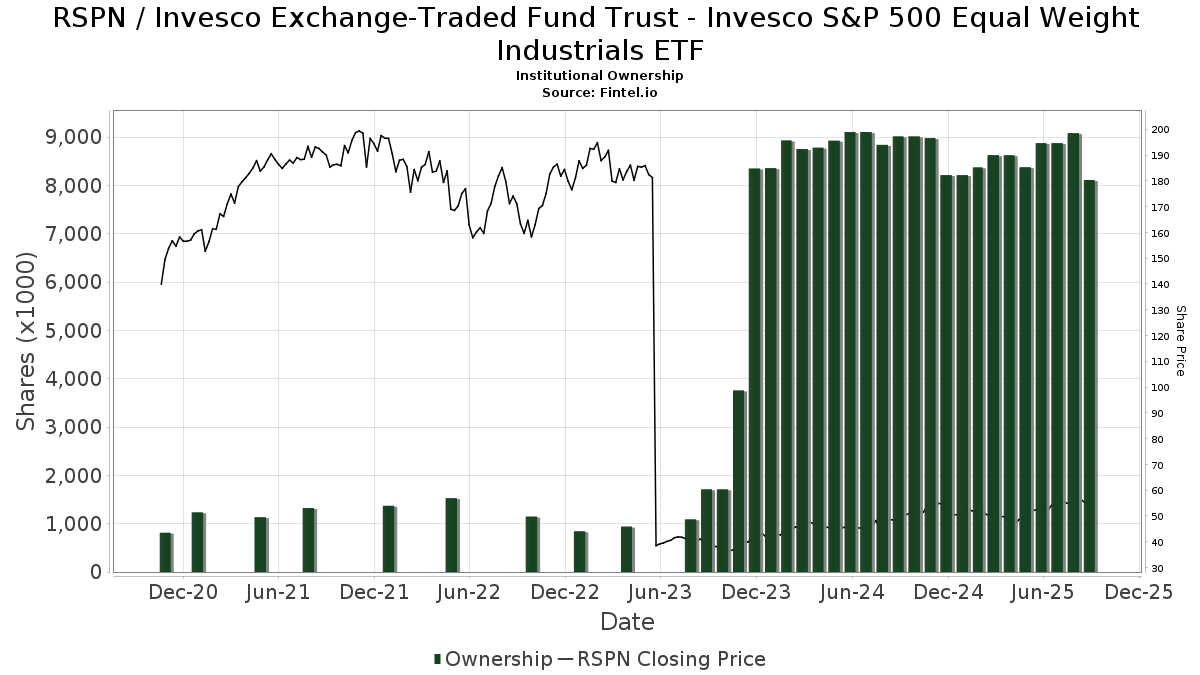
Institutionelt ejerskab og aktionærer
Invesco Exchange-Traded Fund Trust - Invesco S&P 500 Equal Weight Industrials ETF (US:RSPN) har 145 institutionelle ejere og aktionærer, der har indsendt 13D/G- eller 13F-formularer til Securities Exchange Commission (SEC). Disse institutioner har i alt 13,150,531 aktier. Største aktionærer omfatter Jpmorgan Chase & Co, Goldman Sachs Group Inc, Bank Of America Corp /de/, Meitav Dash Investments Ltd, Affinity Wealth Management Llc, Kranot Hishtalmut Le Morim Ve Gananot Havera Menahelet LTD, Morgan Stanley, LPL Financial LLC, Davis Investment Partners, LLC, and GWM Advisors LLC .
Invesco Exchange-Traded Fund Trust - Invesco S&P 500 Equal Weight Industrials ETF (ARCA:RSPN) institutionel ejerskabsstruktur viser aktuelle positioner i virksomheden efter institutioner og fonde, samt seneste ændringer i positionsstørrelse. Større aktionærer kan omfatte individuelle investorer, investeringsforeninger, hedgefonde eller institutioner. Skema 13D angiver, at investoren besidder (eller besidder) mere end 5 % af virksomheden og har til hensigt (eller har til hensigt at) aktivt at forfølge en ændring i forretningsstrategi. Skema 13G indikerer en passiv investering på over 5%.
The share price as of March 31, 2026 is 57,58 / share. Previously, on April 1, 2025, the share price was 49,19 / share. This represents an increase of 17,06% over that period.
Fondens stemningsscore
Fund Sentiment Score (fka Ownership Accumulation Score) finder de aktier, der bliver mest købt af fonde. Det er resultatet af en sofistikeret, multi-faktor kvantitativ model, der identificerer virksomheder med de højeste niveauer af institutionel akkumulering. Scoringsmodellen bruger en kombination af den samlede stigning i oplyste ejere, ændringerne i porteføljeallokeringer i disse ejere og andre målinger. Tallet går fra 0 til 100, hvor højere tal indikerer et højere niveau af akkumulering for sine jævnaldrende, og 50 er gennemsnittet.
Opdateringsfrekvens: Dagligt
Se Ownership Explorer, som giver en liste over højest rangerende virksomheder.
AI+ Ask Fintel’s AI assistant about Invesco Exchange-Traded Fund Trust - Invesco S&P 500 Equal Weight Industrials ETF.
Select a question to share a public post with an AI-crafted answer.
Thinking of good questions…
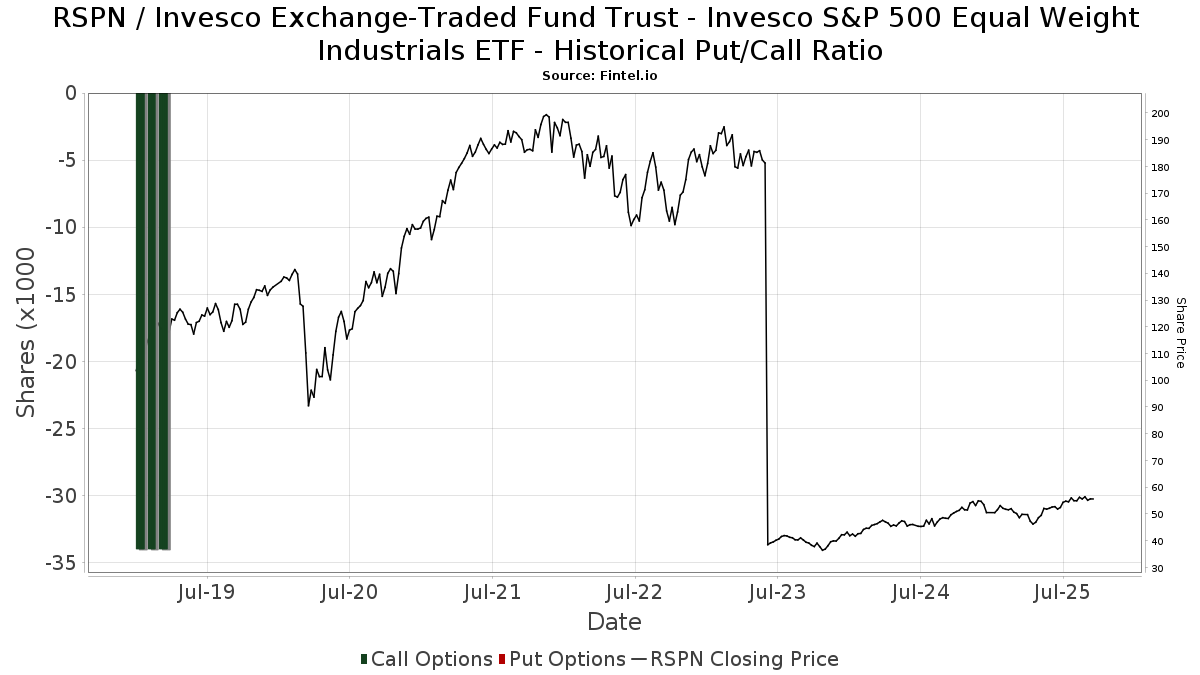
Institutionel Put/Call-forhold
Ud over at indberette standardaktie- og gældsudstedelser skal institutter med mere end 100 mill. aktiver under forvaltning også oplyse deres put- og call-optionsbeholdninger. Da salgsoptioner generelt indikerer negativ stemning, og købsoptioner indikerer positiv stemning, kan vi få en fornemmelse af den overordnede institutionelle stemning ved at plotte forholdet mellem put og kald. Diagrammet til højre viser det historiske put/call-forhold for dette instrument.
Brug af Put/Call Ratio som en indikator for investorernes stemning overvinder en af de vigtigste mangler ved at bruge totalt institutionelt ejerskab, som er, at en betydelig mængde af aktiver under forvaltning investeres passivt for at spore indekser. Passivt forvaltede fonde køber typisk ikke optioner, så indikatoren for put/call-forholdet følger mere nøje følelsen af aktivt forvaltede fonde.
13F og NPORT arkivering
Detaljer om 13F-arkivering er gratis. Detaljer om NP-ansøgninger kræver et premium-medlemskab. Grønne rækker angiver nye positioner. Røde rækker angiver lukkede positioner. Klik på linket ikon for at se den fulde transaktionshistorik.
Opgrader
for at låse premium-data op og eksportere til Excel ![]() .
.
| Fil dato | Kilde | Investor | Type | Gennemsnitlig pris (Øst) |
Aktier | Δ Aktier (%) |
Rapporteret Værdi ($1000) |
Δ Værdi (%) |
Port Alloc (%) |
|
|---|---|---|---|---|---|---|---|---|---|---|
| 2026-02-12 | 13F | Bank Of Montreal /can/ | 2.136 | 7,01 | 121 | 8,11 | ||||
| 2026-02-04 | 13F | Colonial River Wealth Management, LLC | 6.852 | -1,37 | 388 | -0,26 | ||||
| 2026-02-17 | 13F | Citadel Advisors Llc | 0 | -100,00 | 0 | |||||
| 2026-01-12 | 13F | Salem Investment Counselors Inc | 0 | -100,00 | 0 | |||||
| 2026-01-15 | 13F | Affinity Wealth Management Llc | 633.237 | 0,73 | 35.860 | 1,68 | ||||
| 2026-02-05 | 13F | Cambridge Investment Research Advisors, Inc. | 44.226 | -8,83 | 3 | 0,00 | ||||
| 2026-02-12 | 13F | IFC & Insurance Marketing, Inc. | 450 | 0 | ||||||
| 2026-02-06 | 13F | Axxcess Wealth Management, Llc | 6.852 | -1,37 | 388 | -0,26 | ||||
| 2026-02-06 | 13F | Copia Wealth Management | 65 | 0,00 | 4 | 0,00 | ||||
| 2026-02-10 | 13F | Lido Advisors, LLC | 21.066 | 0,13 | 1.182 | 0,08 | ||||
| 2026-02-17 | 13F | Mercer Global Advisors Inc /adv | 4.486 | 254 | ||||||
| 2026-01-29 | 13F | Comprehensive Financial Consultants Institutional, Inc. | 5.445 | -9,75 | 308 | -8,88 | ||||
| 2026-02-11 | 13F | Kranot Hishtalmut Le Morim Tichoniim Havera Menahelet LTD | 209.374 | 0,00 | 11.857 | 1,22 | ||||
| 2026-01-09 | 13F | Diversified Trust Co | 5.125 | 0,00 | 290 | 1,05 | ||||
| 2026-02-06 | 13F | GPS Wealth Strategies Group, LLC | 0 | -100,00 | 0 | |||||
| 2026-02-17 | 13F | Hilltop Holdings Inc. | 20.871 | -1,74 | 1.182 | -0,84 | ||||
| 2026-01-16 | 13F | Walker Asset Management, LLC | 23.804 | -2,22 | 1.348 | -1,25 | ||||
| 2026-02-17 | 13F | IHT Wealth Management, LLC | 42.840 | 2.426 | ||||||
| 2026-02-10 | 13F | Novak & Powell Financial Services, Inc. | 4.715 | 0,00 | 267 | 1,14 | ||||
| 2026-01-14 | 13F | Nova Wealth Management, Inc. | 22.245 | 9,54 | 1.260 | 10,54 | ||||
| 2026-01-12 | 13F | Focus Financial Network, Inc. | 9.262 | -6,21 | 524 | -5,24 | ||||
| 2026-02-17 | 13F | Cape Investment Advisory, Inc. | 70 | 366,67 | 4 | |||||
| 2026-01-08 | 13F | Wealth Enhancement Advisory Services, Llc | 130.360 | 0,82 | 7.682 | 6,03 | ||||
| 2026-02-12 | 13F | Federation des caisses Desjardins du Quebec | 2.725 | 0,00 | 154 | 1,32 | ||||
| 2026-02-17 | 13F | Bank Of America Corp /de/ | 943.903 | 3,89 | 53.453 | 4,87 | ||||
| 2026-02-19 | 13F | CI Private Wealth, LLC | 8.092 | 16,62 | 458 | 17,74 | ||||
| 2026-02-17 | 13F | Equitable Holdings, Inc. | 36.100 | -23,31 | 2.044 | -22,58 | ||||
| 2026-01-22 | 13F | Treasure Coast Financial Planning | 34.471 | 5,86 | 1.952 | 6,90 | ||||
| 2026-02-17 | 13F | Advisory Services Network, LLC | 0 | -100,00 | 0 | |||||
| 2026-01-29 | 13F | Live Oak Investment Partners | 23.858 | -8,56 | 1.351 | -7,66 | ||||
| 2026-01-30 | 13F | Interchange Capital Partners, LLC | 9.870 | -13,61 | 559 | -12,81 | ||||
| 2026-01-20 | 13F | Steel Peak Wealth Management LLC | 0 | -100,00 | 0 | |||||
| 2026-02-17 | 13F | Fmr Llc | 25.510 | 6,13 | 1.445 | 7,12 | ||||
| 2026-02-06 | 13F | Signature Estate & Investment Advisors Llc | 12.532 | 1,32 | 710 | 2,31 | ||||
| 2026-01-28 | 13F | Joseph P. Lucia & Associates, LLC | 48.013 | -0,11 | 2.719 | 0,82 | ||||
| 2026-01-30 | 13F | Financial Services Advisory Inc | 0 | -100,00 | 0 | |||||
| 2026-01-09 | 13F | First Heartland Consultants, Inc. | 10.923 | -0,18 | 619 | 0,82 | ||||
| 2026-02-17 | 13F | North Capital, Inc. | 0 | -100,00 | 0 | |||||
| 2026-02-10 | 13F | CIBC World Markets Inc. | 18.295 | 49,54 | 1.036 | 51,02 | ||||
| 2026-01-16 | 13F | Trust Co Of Vermont | 50 | 0,00 | 3 | 0,00 | ||||
| 2026-01-15 | 13F | SILVER OAK SECURITIES, Inc | 13.725 | 0,23 | 784 | 2,08 | ||||
| 2026-02-04 | 13F | Ameritas Advisory Services, LLC | 0 | -100,00 | 0 | |||||
| 2025-11-12 | 13F | Steward Partners Investment Advisory, Llc | 0 | -100,00 | 0 | |||||
| 2026-02-12 | 13F | Sykon Capital Llc | 15.628 | 885 | ||||||
| 2026-02-05 | 13F | AlphaCore Capital LLC | 139 | 0,00 | 8 | 0,00 | ||||
| 2026-02-11 | 13F | Kranot Hishtalmut Le Morim Ve Gananot Havera Menahelet LTD | 591.126 | 0,00 | 33.475 | 1,22 | ||||
| 2026-02-17 | 13F | Raymond James Financial Inc | 217.014 | -7,52 | 12.290 | -6,65 | ||||
| 2025-12-09 | 13F | Painted Porch Advisors LLC | 0 | -100,00 | 0 | |||||
| 2025-11-10 | 13F | Private Advisory Group LLC | 0 | -100,00 | 0 | |||||
| 2026-02-02 | 13F | Oppenheimer & Co Inc | 8.190 | -1,21 | 464 | -0,43 | ||||
| 2026-02-05 | 13F | Western Wealth Management, LLC | 7.431 | 0,68 | 421 | 1,45 | ||||
| 2026-02-10 | 13F/A | Northwestern Mutual Wealth Management Co | 11.174 | -1,23 | 633 | -0,32 | ||||
| 2025-11-14 | 13F | Eqis Capital Management, Inc. | 0 | -100,00 | 0 | |||||
| 2026-02-11 | 13F | Parallel Advisors, LLC | 800 | 0,00 | 45 | 2,27 | ||||
| 2026-02-12 | 13F | Brinker Capital Investments, LLC | 13.711 | 776 | ||||||
| 2026-01-29 | 13F | Calamos Wealth Management LLC | 4.387 | 0,00 | 248 | 0,81 | ||||
| 2026-02-03 | 13F | Financial Partners Group, Inc | 3.855 | 0,00 | 231 | 6,94 | ||||
| 2026-02-10 | 13F | Envestnet Asset Management Inc | 8.898 | 8,59 | 504 | 9,59 | ||||
| 2026-02-09 | 13F | MTM Investment Management, LLC | 0 | -100,00 | 0 | |||||
| 2025-11-19 | 13F | Captrust Financial Advisors | 0 | -100,00 | 0 | |||||
| 2026-01-29 | 13F | Traction Financial Partners, LLC | 31.702 | -7,51 | 1.795 | -6,61 | ||||
| 2026-02-02 | 13F | Benjamin Edwards Inc | 4.825 | 0,00 | 273 | 1,11 | ||||
| 2026-02-13 | 13F | SRS Capital Advisors, Inc. | 4.633 | 262 | ||||||
| 2026-02-13 | 13F | Resources Investment Advisors, LLC. | 5.355 | -20,73 | 303 | -19,84 | ||||
| 2026-02-06 | 13F | HighTower Advisors, LLC | 0 | -100,00 | 0 | |||||
| 2026-02-13 | 13F | Evernest Financial Advisors, LLC | 55.440 | -2,37 | 3.495 | 9,70 | ||||
| 2026-02-17 | 13F | Advisor Group Holdings, Inc. | 44.290 | -5,51 | 2.508 | -4,27 | ||||
| 2026-02-13 | 13F | Brick & Kyle, Associates | 28.440 | 0,01 | 2 | 0,00 | ||||
| 2026-01-20 | 13F | Thurston, Springer, Miller, Herd & Titak, Inc. | 141 | 8 | ||||||
| 2026-02-13 | 13F | Perryman Financial Advisory Inc /ad | 4.021 | 228 | ||||||
| 2026-02-13 | 13F | Jacobi Capital Management LLC | 6.275 | -5,64 | 355 | -4,83 | ||||
| 2026-02-02 | 13F | Truist Financial Corp | 8.358 | -12,22 | 473 | -11,42 | ||||
| 2026-02-12 | 13F | CIBC Private Wealth Group, LLC | 12 | 1 | ||||||
| 2026-02-13 | 13F | Citigroup Inc | 200 | -90,02 | 11 | -90,18 | ||||
| 2026-01-26 | 13F | AE Wealth Management LLC | 1.972 | 0,00 | 112 | 0,91 | ||||
| 2026-01-29 | 13F | TKG Advisors, LLC | 82.219 | -1,24 | 4.656 | -0,30 | ||||
| 2026-02-13 | 13F | Stifel Financial Corp | 35.280 | 10,12 | 1.998 | 11,13 | ||||
| 2026-01-14 | 13F | Wealthcare Advisory Partners LLC | 172.251 | 1,09 | 9.755 | 2,04 | ||||
| 2026-01-21 | 13F | Sound Income Strategies, LLC | 1.685 | 103 | ||||||
| 2026-02-11 | 13F | LPL Financial LLC | 380.323 | 2,88 | 21.538 | 3,85 | ||||
| 2026-02-13 | 13F | National Bank Of Canada /fi/ | 35.207 | 1,19 | 1.994 | 2,15 | ||||
| 2026-02-10 | 13F | IFG Advisory, LLC | 13.731 | 778 | ||||||
| 2026-02-09 | 13F | Atlantic Trust, LLC | 130 | 0,00 | 7 | 0,00 | ||||
| 2026-02-13 | 13F | Kestra Advisory Services, LLC | 0 | -100,00 | 0 | |||||
| 2026-02-05 | 13F | Hills Bank & Trust Co | 21.354 | 1.209 | ||||||
| 2026-02-13 | 13F | RFP Financial Group LLC | 14.352 | -90,53 | 813 | -90,45 | ||||
| 2026-01-21 | 13F | Graham Capital Wealth Management, Llc | 61.727 | 3.496 | ||||||
| 2026-01-21 | 13F | Access Financial Services, Inc. | 32.375 | -1,50 | 1.833 | -0,54 | ||||
| 2026-01-16 | 13F | YHB Investment Advisors, Inc. | 4.981 | 30,53 | 282 | 31,78 | ||||
| 2026-02-09 | 13F | Kingsview Wealth Management, LLC | 10.647 | -8,22 | 603 | -7,38 | ||||
| 2026-02-09 | 13F | Harbour Investments, Inc. | 23 | 0,00 | 1 | 0,00 | ||||
| 2026-02-12 | 13F | Principal Securities, Inc. | 3.824 | -2,15 | 217 | -1,37 | ||||
| 2026-02-02 | 13F | Montag A & Associates Inc | 535 | 0,00 | 30 | 0,00 | ||||
| 2026-02-02 | 13F | CX Institutional | 214 | -63,54 | 0 | |||||
| 2026-01-05 | 13F | Park Avenue Securities Llc | 4.789 | -11,72 | 0 | |||||
| 2026-01-23 | 13F | Farther Finance Advisors, LLC | 63.102 | 0,74 | 3.573 | 1,68 | ||||
| 2026-02-06 | 13F | One Charles Private Wealth Services, LLC | 6.217 | 0,00 | 352 | 1,15 | ||||
| 2026-02-04 | 13F | Pensionmark Financial Group, Llc | 7.000 | 0,00 | 396 | 1,02 | ||||
| 2025-11-12 | 13F | Accredited Wealth Management, LLC | 340 | 100,00 | 10 | 0,00 | ||||
| 2026-01-30 | 13F | Wagner Wealth Management, Llc | 251 | 0,40 | 14 | 0,00 | ||||
| 2026-02-14 | 13F | Rockefeller Capital Management L.P. | 4.179 | 0,10 | 237 | 0,85 | ||||
| 2026-02-17 | 13F | Ameriprise Financial Inc | 237.589 | -13,66 | 13.455 | -12,78 | ||||
| 2026-02-10 | 13F | Comprehensive Wealth Management, LLC | 44.750 | 10,63 | 2.534 | 11,68 | ||||
| 2026-02-17 | 13F | Capital Wealth Alliance, LLC | 9.498 | -2,95 | 599 | 8,93 | ||||
| 2026-01-21 | 13F | TigerOak Management, L.L.C. | 113.823 | -4,42 | 6.446 | -3,52 | ||||
| 2026-02-17 | 13F | Jones Financial Companies Lllp | 24.239 | 28,70 | 1.373 | 31,17 | ||||
| 2026-02-17 | 13F | Wiley Bros.-aintree Capital, Llc | 8.756 | -18,63 | 496 | -17,91 | ||||
| 2025-11-14 | 13F | Gts Securities Llc | 0 | -100,00 | 0 | -100,00 | ||||
| 2025-11-14 | 13F | Strategic Wealth Partners, Ltd. | 1.458 | -6,12 | 82 | -2,41 | ||||
| 2026-02-11 | 13F | Janney Montgomery Scott LLC | 7.566 | 0,00 | 0 | |||||
| 2026-02-11 | 13F | O'shaughnessy Asset Management, Llc | 580 | 0,00 | 33 | 0,00 | ||||
| 2026-01-14 | 13F | Tradewinds Capital Management, LLC | 2.969 | 0,17 | 168 | 1,20 | ||||
| 2026-01-28 | 13F | Carmel Capital Management L.L.C. | 171.635 | 1,60 | 9.720 | 2,55 | ||||
| 2026-02-13 | 13F | Brown Advisory Inc | 15.750 | 0,00 | 892 | 0,91 | ||||
| 2026-02-13 | 13F | Mariner, LLC | 5.427 | 0,06 | 307 | 0,99 | ||||
| 2026-02-17 | 13F | Green Harvest Asset Management LLC | 37.853 | -2,46 | 2.144 | -1,56 | ||||
| 2026-02-17 | 13F | Private Advisor Group, LLC | 11.984 | -66,31 | 679 | -66,02 | ||||
| 2026-02-17 | 13F | Cetera Investment Advisers | 89.963 | 20,49 | 5.095 | 21,63 | ||||
| 2025-10-30 | 13F | Envestnet Portfolio Solutions, Inc. | 0 | -100,00 | 0 | |||||
| 2026-02-10 | 13F | Bnp Paribas Arbitrage, Sa | 50.000 | 400,00 | 2.832 | 404,63 | ||||
| 2026-01-21 | 13F | Capital Investment Advisory Services, LLC | 4.697 | 0,17 | 266 | 0,76 | ||||
| 2026-01-23 | 13F | Clear Creek Financial Management, LLC | 45.586 | 0,33 | 2.582 | 1,26 | ||||
| 2026-02-11 | 13F | Hilton Head Capital Partners, LLC | 586 | 33 | ||||||
| 2026-02-12 | 13F | Commonwealth Equity Services, Llc | 7.845 | -88,26 | 444 | 14.700,00 | ||||
| 2026-02-02 | 13F | Advanced Asset Management Advisors Inc | 1.103 | 62 | ||||||
| 2026-02-17 | 13F | Tower Research Capital LLC (TRC) | 0 | -100,00 | 0 | |||||
| 2026-02-13 | 13F | McAdam, LLC | 7.905 | 0,00 | 448 | 0,90 | ||||
| 2026-01-29 | 13F | Comerica Bank | 1.685 | -1,00 | 95 | 0,00 | ||||
| 2026-02-10 | 13F | Rothschild Investment Llc | 430 | 0,00 | 24 | 0,00 | ||||
| 2026-02-18 | 13F | GWM Advisors LLC | 253.868 | -1,43 | 14.377 | -0,51 | ||||
| 2026-02-13 | 13F | Wells Fargo & Company/mn | 143.863 | 10,81 | 8.147 | 11,85 | ||||
| 2026-01-26 | 13F | Cwm, Llc | 3.218 | 24,25 | 0 | |||||
| 2026-02-17 | 13F | Qube Research & Technologies Ltd | 526 | 0,19 | 30 | 0,00 | ||||
| 2026-01-14 | 13F | Spire Wealth Management | 4.859 | 0,16 | 275 | 1,10 | ||||
| 2026-01-20 | 13F | SOA Wealth Advisors, LLC. | 2.649 | 0,15 | 150 | 1,35 | ||||
| 2026-02-11 | 13F | MCF Advisors LLC | 170 | 10 | ||||||
| 2026-01-15 | 13F | Burns Matteson Capital Management, LLC | 26.516 | -8,87 | 1.502 | -8,03 | ||||
| 2026-01-23 | 13F | Assetmark, Inc | 113 | 0,00 | 6 | 0,00 | ||||
| 2026-02-13 | 13F | Morgan Stanley | 495.219 | 22,35 | 28.044 | 23,50 | ||||
| 2026-02-06 | 13F | Advisory Alpha, LLC | 7.441 | -0,61 | 421 | 0,24 | ||||
| 2026-02-10 | 13F | Meitav Dash Investments Ltd | 848.531 | -0,34 | 48.052 | 0,60 | ||||
| 2026-01-06 | 13F | Davis Investment Partners, LLC | 273.052 | -4,38 | 15.665 | -1,99 | ||||
| 2026-01-08 | 13F | Choice Wealth Advisors, LLC | 42.002 | -0,14 | 2.379 | 0,81 | ||||
| 2026-01-20 | 13F | Stratos Wealth Partners, LTD. | 22.761 | 10,17 | 1.289 | 11,13 | ||||
| 2026-01-30 | 13F | Us Bancorp \de\ | 1.445 | 0,00 | 82 | 0,00 | ||||
| 2025-11-14 | 13F | D. E. Shaw & Co., Inc. | 0 | -100,00 | 0 | |||||
| 2026-02-09 | 13F | Hartland & Co., LLC | 1.020 | 0,20 | 58 | 0,00 | ||||
| 2026-01-27 | 13F | Richards, Merrill & Peterson, Inc. | 116 | 0,00 | 7 | 0,00 | ||||
| 2026-02-13 | 13F | Change Path, LLC | 10.875 | 0,00 | 616 | 0,82 | ||||
| 2026-01-26 | 13F | Harbor Asset Planning, Inc. | 52.240 | 4,99 | 2.958 | 5,98 | ||||
| 2026-01-26 | 13F | Mirae Asset Global Investments Co., Ltd. | 0 | -100,00 | 0 | |||||
| 2026-02-06 | 13F | Global Retirement Partners, LLC | 27.024 | 3,71 | 1.530 | 4,72 | ||||
| 2026-01-26 | 13F | Private Trust Co Na | 6.702 | -51,29 | 380 | -50,84 | ||||
| 2026-02-11 | 13F | Jpmorgan Chase & Co | 2.831.327 | 1.022.039,71 | 160.338 | 1.068.820,00 | ||||
| 2025-11-14 | 13F | Quantinno Capital Management LP | 0 | -100,00 | 0 | |||||
| 2026-01-29 | 13F | UBS Group AG | 138.834 | -9,78 | 7.862 | -8,92 | ||||
| 2026-02-12 | 13F | Grey Fox Wealth Advisors, LLC | 5.402 | 0,15 | 306 | 0,99 | ||||
| 2026-01-27 | 13F | Friedenthal Financial | 27.018 | -4,92 | 1.530 | -4,02 | ||||
| 2026-01-28 | 13F | Geneos Wealth Management Inc. | 8.288 | 0,00 | 469 | 1,08 | ||||
| 2026-02-09 | 13F | Key FInancial Inc | 2.630 | 3,95 | 149 | 4,96 | ||||
| 2026-02-10 | 13F | Goldman Sachs Group Inc | 2.422.350 | 235,34 | 137.178 | 238,52 | ||||
| 2026-02-13 | 13F | MAI Capital Management | 2.254 | 34,57 | 128 | 36,56 | ||||
| 2026-02-13 | 13F | Sofos Investments, Inc. | 36 | -66,97 | 2 | -66,67 | ||||
| 2026-02-13 | 13F | Mml Investors Services, Llc | 8.132 | 11,43 | 461 | 12,47 | ||||
| 2026-02-17 | 13F | Royal Bank Of Canada | 100.588 | 10,72 | 5.696 | 11,75 | ||||
| 2026-01-28 | 13F | G&S Capital LLC | 58.459 | -1,03 | 3.311 | -0,09 | ||||
| 2026-01-27 | 13F | TD Waterhouse Canada Inc. | 0 | -100,00 | 0 | |||||
| 2026-02-18 | 13F | Financial Advisory Service, Inc. | 1.025 | 0,00 | 58 | 1,75 |