Grundlæggende statistik
| Institutionelle ejere | 122 total, 122 long only, 0 short only, 0 long/short - change of 1,67% MRQ |
| Gennemsnitlig porteføljeallokering | 0.2638 % - change of -38,39% MRQ |
| Institutionelle aktier (lange) | 28.048.601 (ex 13D/G) - change of -1,18MM shares -4,02% MRQ |
| Institutionel værdi (lang) | $ 976.021 USD ($1000) |
Institutionelt ejerskab og aktionærer
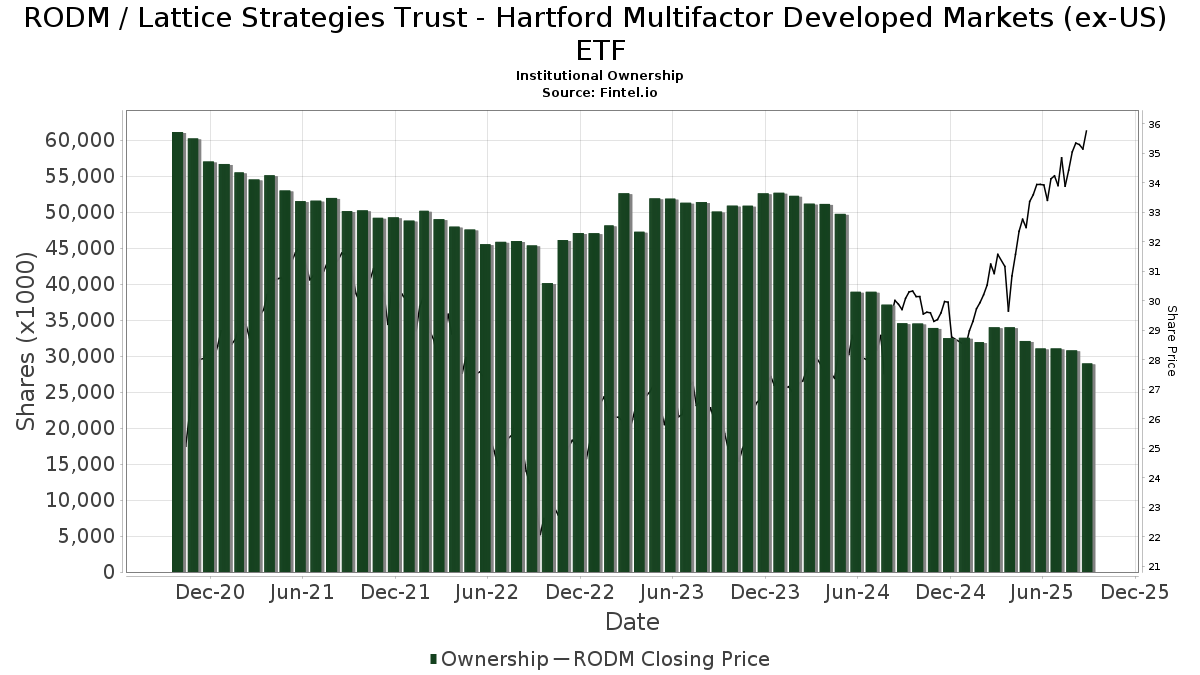
Lattice Strategies Trust - Hartford Multifactor Developed Markets (ex-US) ETF (US:RODM) har 122 institutionelle ejere og aktionærer, der har indsendt 13D/G- eller 13F-formularer til Securities Exchange Commission (SEC). Disse institutioner har i alt 28,048,601 aktier. Største aktionærer omfatter Cerity Partners LLC, Morgan Stanley, Hartford Funds Management Co LLC, Bank Of America Corp /de/, Mill Creek Capital Advisors, LLC, WCG Wealth Advisors LLC, Foster & Motley Inc, LPL Financial LLC, Intellus Advisors LLC, and Mariner, LLC .
Lattice Strategies Trust - Hartford Multifactor Developed Markets (ex-US) ETF (ARCA:RODM) institutionel ejerskabsstruktur viser aktuelle positioner i virksomheden efter institutioner og fonde, samt seneste ændringer i positionsstørrelse. Større aktionærer kan omfatte individuelle investorer, investeringsforeninger, hedgefonde eller institutioner. Skema 13D angiver, at investoren besidder (eller besidder) mere end 5 % af virksomheden og har til hensigt (eller har til hensigt at) aktivt at forfølge en ændring i forretningsstrategi. Skema 13G indikerer en passiv investering på over 5%.
The share price as of April 17, 2026 is 41,23 / share. Previously, on April 21, 2025, the share price was 31,11 / share. This represents an increase of 32,53% over that period.
Fondens stemningsscore
Fund Sentiment Score (fka Ownership Accumulation Score) finder de aktier, der bliver mest købt af fonde. Det er resultatet af en sofistikeret, multi-faktor kvantitativ model, der identificerer virksomheder med de højeste niveauer af institutionel akkumulering. Scoringsmodellen bruger en kombination af den samlede stigning i oplyste ejere, ændringerne i porteføljeallokeringer i disse ejere og andre målinger. Tallet går fra 0 til 100, hvor højere tal indikerer et højere niveau af akkumulering for sine jævnaldrende, og 50 er gennemsnittet.
Opdateringsfrekvens: Dagligt
Se Ownership Explorer, som giver en liste over højest rangerende virksomheder.
AI+ Ask Fintel’s AI assistant about Lattice Strategies Trust - Hartford Multifactor Developed Markets (ex-US) ETF.
Select a question to share a public post with an AI-crafted answer.
Thinking of good questions…
Institutionel Put/Call-forhold
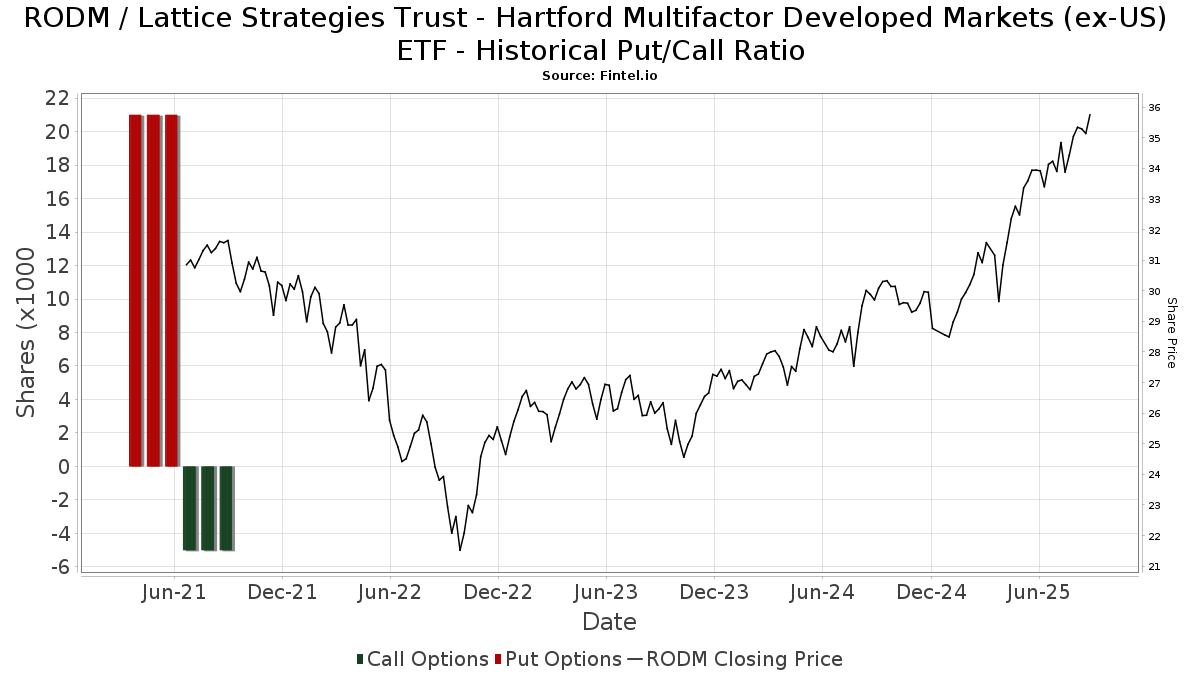
Ud over at indberette standardaktie- og gældsudstedelser skal institutter med mere end 100 mill. aktiver under forvaltning også oplyse deres put- og call-optionsbeholdninger. Da salgsoptioner generelt indikerer negativ stemning, og købsoptioner indikerer positiv stemning, kan vi få en fornemmelse af den overordnede institutionelle stemning ved at plotte forholdet mellem put og kald. Diagrammet til højre viser det historiske put/call-forhold for dette instrument.
Brug af Put/Call Ratio som en indikator for investorernes stemning overvinder en af de vigtigste mangler ved at bruge totalt institutionelt ejerskab, som er, at en betydelig mængde af aktiver under forvaltning investeres passivt for at spore indekser. Passivt forvaltede fonde køber typisk ikke optioner, så indikatoren for put/call-forholdet følger mere nøje følelsen af aktivt forvaltede fonde.
13F og NPORT arkivering
Detaljer om 13F-arkivering er gratis. Detaljer om NP-ansøgninger kræver et premium-medlemskab. Grønne rækker angiver nye positioner. Røde rækker angiver lukkede positioner. Klik på linket ikon for at se den fulde transaktionshistorik.
Opgrader
for at låse premium-data op og eksportere til Excel ![]() .
.
| Fil dato | Kilde | Investor | Type | Gennemsnitlig pris (Øst) |
Aktier | Δ Aktier (%) |
Rapporteret Værdi ($1000) |
Δ Værdi (%) |
Port Alloc (%) |
|
|---|---|---|---|---|---|---|---|---|---|---|
| 2026-01-30 | 13F | Oakworth Capital, Inc. | 1.185 | 0,00 | 44 | 2,38 | ||||
| 2026-02-10 | 13F | Lido Advisors, LLC | 246.313 | 0,00 | 8.750 | 0,00 | ||||
| 2026-01-29 | 13F | Comerica Bank | 3.066 | -1,16 | 113 | 2,73 | ||||
| 2026-01-29 | 13F | Sanctuary Advisors, LLC | 6.571 | 0,00 | 243 | 3,86 | ||||
| 2026-02-05 | 13F | Cambridge Investment Research Advisors, Inc. | 32.134 | -2,52 | 1 | 0,00 | ||||
| 2026-02-17 | 13F | Gotham Asset Management, LLC | 9.466 | -19,12 | 350 | -15,66 | ||||
| 2026-01-14 | 13F | Bennett Associates Wealth Management | 65.311 | -0,86 | 2.415 | 3,16 | ||||
| 2026-02-06 | 13F | Empirical Asset Management, LLC | 39.679 | 57,31 | 1.467 | 63,73 | ||||
| 2026-02-13 | 13F | Wells Fargo & Company/mn | 44.996 | -10,69 | 1.664 | -7,04 | ||||
| 2026-02-10 | 13F | WCG Wealth Advisors LLC | 1.698.855 | 179,22 | 62.817 | 190,63 | ||||
| 2026-01-06 | 13F | Tucker Asset Management Llc | 0 | -100,00 | 0 | |||||
| 2026-04-15 | 13F | Cranbrook Wealth Management, LLC | 14.991 | -7,07 | 591 | -1,01 | ||||
| 2026-02-11 | 13F | WESCAP Management Group, Inc. | 100.557 | -5,47 | 3.718 | -1,59 | ||||
| 2026-02-05 | 13F | WealthPlan Investment Management, LLC | 6.211 | -7,34 | 230 | -3,78 | ||||
| 2026-04-13 | 13F | Bank & Trust Co | 405 | 0,00 | 16 | 7,14 | ||||
| 2026-02-14 | 13F | Rockefeller Capital Management L.P. | 53.666 | 30,66 | 1.984 | 35,98 | ||||
| 2026-02-17 | 13F | Aqr Capital Management Llc | 10.672 | 395 | ||||||
| 2026-02-17 | 13F | Captrust Financial Advisors | 446.025 | -3,05 | 16.492 | 0,90 | ||||
| 2026-02-13 | 13F | Resources Investment Advisors, LLC. | 62.784 | -4,62 | 2.321 | -0,73 | ||||
| 2026-02-06 | 13F | Larson Financial Group LLC | 13.464 | -3,72 | 498 | 0,20 | ||||
| 2026-02-17 | 13F | Citadel Advisors Llc | 28.094 | 3,66 | 1.039 | 7,90 | ||||
| 2026-02-12 | 13F | Quadrant Capital Group Llc | 4.322 | 160 | ||||||
| 2026-02-17 | 13F | Miller Capital Partners, Inc. | 141 | 5 | ||||||
| 2026-04-07 | 13F | Farther Finance Advisors, LLC | 5.667 | 6,34 | 226 | 14,21 | ||||
| 2026-02-11 | 13F | LPL Financial LLC | 1.089.891 | 23,44 | 40.299 | 28,48 | ||||
| 2026-02-11 | 13F | Jpmorgan Chase & Co | 5.424 | -3,25 | 201 | 0,50 | ||||
| 2026-02-13 | 13F | MAI Capital Management | 35.033 | -0,71 | 1.295 | 3,35 | ||||
| 2026-01-13 | 13F | Team Financial Group, LLC | 605 | 1,51 | 22 | 4,76 | ||||
| 2026-02-12 | 13F | BlackRock, Inc. | 9.116 | 82,58 | 337 | 90,40 | ||||
| 2026-02-12 | 13F | Insigneo Advisory Services, Llc | 6.497 | 0,00 | 240 | 4,35 | ||||
| 2026-04-15 | 13F | Client 1st Advisory Group, Llc | 18.014 | 0,00 | 710 | 6,61 | ||||
| 2026-02-06 | 13F | Intellus Advisors LLC | 1.047.638 | 0,07 | 38.736 | 4,15 | ||||
| 2026-02-17 | 13F | Ancora Advisors, LLC | 114 | 0,00 | 4 | 0,00 | ||||
| 2026-02-02 | 13F | Vawter Financial, Ltd. | 97.148 | -32,00 | 3.592 | -29,22 | ||||
| 2026-01-22 | 13F | Trilogy Capital Inc. | 82.580 | -5,50 | 3.053 | -1,64 | ||||
| 2026-01-20 | 13F | Sovran Advisors, LLC | 15.999 | -11,53 | 603 | -6,81 | ||||
| 2026-01-30 | 13F | Us Bancorp \de\ | 1.220 | 0,00 | 45 | 4,65 | ||||
| 2026-02-17 | 13F | Raymond James Financial Inc | 990.612 | 11,05 | 36.628 | 15,59 | ||||
| 2026-02-17 | 13F | Bank Of America Corp /de/ | 2.609.303 | -0,89 | 96.479 | 3,15 | ||||
| 2025-11-14 | 13F | Strategic Wealth Partners, Ltd. | 1.500 | 53 | ||||||
| 2026-01-21 | 13F | Flagship Harbor Advisors, Llc | 1.337 | 49 | ||||||
| 2026-04-17 | 13F | AdvisorNet Financial, Inc | 7.871 | -6,79 | 310 | -0,64 | ||||
| 2026-02-13 | 13F | Citigroup Inc | 15.656 | 0,75 | 579 | 4,71 | ||||
| 2026-02-17 | 13F | Royal Bank Of Canada | 203.722 | 23,75 | 7.532 | 28,80 | ||||
| 2026-02-13 | 13F | Arkadios Wealth Advisors | 15.809 | 0,97 | 585 | 5,04 | ||||
| 2026-02-17 | 13F | Private Advisor Group, LLC | 613.581 | -1,27 | 22.687 | 2,76 | ||||
| 2026-02-10 | 13F | Bank of New York Mellon Corp | 5.563 | 206 | ||||||
| 2026-02-13 | 13F | Aptus Capital Advisors, LLC | 16.637 | 0,00 | 615 | 4,06 | ||||
| 2026-01-29 | 13F | D.a. Davidson & Co. | 15.145 | -0,92 | 560 | 2,95 | ||||
| 2026-01-23 | 13F | Assetmark, Inc | 93 | 0,00 | 3 | 0,00 | ||||
| 2026-02-10 | 13F | IAG Wealth Partners, LLC | 120.392 | -4,41 | 4.452 | -0,51 | ||||
| 2026-02-17 | 13F | SageView Advisory Group, LLC | 1.423 | 53 | ||||||
| 2026-02-10 | 13F/A | Northwestern Mutual Wealth Management Co | 19.693 | 6,95 | 728 | 11,31 | ||||
| 2026-02-12 | 13F | Jane Street Group, Llc | 91.692 | 78,18 | 3.390 | 85,45 | ||||
| 2026-02-17 | 13F | Jones Financial Companies Lllp | 255.241 | 39,36 | 9.438 | 45,90 | ||||
| 2026-02-11 | 13F | Cerity Partners LLC | 4.037.300 | 1,95 | 149.279 | 6,11 | ||||
| 2026-02-17 | 13F | Modern Wealth Management, LLC | 91.140 | -4,38 | 3.370 | -0,50 | ||||
| 2026-02-10 | 13F | Envestnet Asset Management Inc | 38.030 | 0,18 | 1.406 | 4,30 | ||||
| 2026-03-05 | 13F | Bayban | 382 | 14 | ||||||
| 2026-02-13 | 13F | Golden State Wealth Management, LLC | 8.364 | 1,09 | 309 | 5,46 | ||||
| 2026-02-17 | 13F | Wiley Bros.-aintree Capital, Llc | 184.033 | 18,92 | 6.811 | 23,84 | ||||
| 2026-02-17 | 13F | Advisor Group Holdings, Inc. | 15.493 | -50,69 | 573 | -48,51 | ||||
| 2026-02-04 | 13F | Ameritas Advisory Services, LLC | 0 | -100,00 | 0 | |||||
| 2026-01-23 | 13F | First PREMIER Bank | 71.020 | 1,60 | 3 | 0,00 | ||||
| 2026-02-17 | 13F | Ameriprise Financial Inc | 108.587 | 21,78 | 4.016 | 26,78 | ||||
| 2025-11-19 | 13F | Sunbelt Securities, Inc. | 0 | -100,00 | 0 | |||||
| 2026-01-22 | 13F | Apollon Financial, LLC | 32.100 | 1.187 | ||||||
| 2026-01-29 | 13F | Kestra Private Wealth Services, Llc | 9.785 | 1,79 | 362 | 5,87 | ||||
| 2025-10-22 | 13F | Geneos Wealth Management Inc. | 0 | -100,00 | 0 | -100,00 | ||||
| 2026-01-26 | 13F | Private Trust Co Na | 1.782 | 0,00 | 66 | 3,17 | ||||
| 2026-02-10 | 13F | Natixis Advisors, L.p. | 10.004 | 0 | ||||||
| 2026-04-08 | 13F | Wealth Enhancement Advisory Services, Llc | 19.387 | -9,74 | 772 | -3,74 | ||||
| 2026-02-12 | 13F | Wealthspire Advisors, LLC | 0 | -100,00 | 0 | |||||
| 2025-11-06 | 13F | Financial Advocates Investment Management | 0 | -100,00 | 0 | |||||
| 2026-02-13 | 13F | Mariner, LLC | 999.238 | 1,86 | 36.947 | 6,02 | ||||
| 2026-01-28 | 13F | White Pine Investment CO | 18.081 | 0,00 | 1 | |||||
| 2026-02-10 | 13F | Bearing Point Capital, Llc | 280.032 | 17,55 | 10.354 | 22,36 | ||||
| 2026-01-15 | 13F | Clg Llc | 21.297 | -22,96 | 787 | -19,86 | ||||
| 2026-02-13 | 13F | Gts Securities Llc | 0 | -100,00 | 0 | |||||
| 2026-02-17 | 13F | Mercer Global Advisors Inc /adv | 7.995 | -5,25 | 296 | -1,34 | ||||
| 2026-04-13 | 13F | Creative Financial Designs Inc /adv | 500 | 0,00 | 20 | 5,56 | ||||
| 2026-01-27 | 13F | Evergreen Capital Management Llc | 163.640 | -2,78 | 6.051 | 1,19 | ||||
| 2026-04-14 | 13F | Prospera Financial Services Inc | 6.296 | 0,38 | 248 | 7,36 | ||||
| 2026-02-09 | 13F | Harbour Investments, Inc. | 3.340 | 0,12 | 124 | 4,24 | ||||
| 2026-04-17 | 13F | Webster Bank, N. A. | 1.514 | 60 | ||||||
| 2026-02-10 | 13F | Root Financial Partners, LLC | 2.426 | 0,00 | 90 | 3,49 | ||||
| 2026-01-22 | 13F | Evermay Wealth Management Llc | 2.754 | -7,34 | 102 | -3,81 | ||||
| 2026-02-13 | 13F | Kestra Advisory Services, LLC | 3.033 | 112 | ||||||
| 2026-02-17 | 13F | Cetera Investment Advisers | 381.447 | 0,93 | 14.104 | 5,04 | ||||
| 2026-01-30 | 13F | Wagner Wealth Management, Llc | 23 | 0,00 | 1 | |||||
| 2026-02-06 | 13F | Global Retirement Partners, LLC | 3.964 | 0,00 | 147 | 4,29 | ||||
| 2026-02-06 | 13F | HighTower Advisors, LLC | 21.258 | -5,23 | 786 | -1,26 | ||||
| 2026-01-29 | 13F | BKM Wealth Management, LLC | 7.423 | 0,94 | 274 | 4,98 | ||||
| 2026-01-29 | 13F | UBS Group AG | 448.751 | -4,45 | 16.593 | -0,55 | ||||
| 2026-02-13 | 13F | Flow Traders U.s. Llc | 160.431 | 6 | ||||||
| 2026-02-17 | 13F | Equitable Holdings, Inc. | 45.409 | -7,72 | 1.679 | -4,00 | ||||
| 2026-01-23 | 13F | Eagle Strategies LLC | 12.895 | 0,84 | 477 | 4,85 | ||||
| 2026-02-06 | 13F | Keystone Financial Group | 0 | -100,00 | 0 | |||||
| 2026-02-13 | 13F | Morgan Stanley | 3.222.470 | -0,94 | 119.151 | 3,10 | ||||
| 2026-02-17 | 13F | Guardian Wealth Advisors, Llc / Nc | 16.637 | 0,00 | 615 | 4,06 | ||||
| 2026-02-09 | 13F | Coldstream Capital Management Inc | 36.858 | 0,01 | 1.363 | 4,05 | ||||
| 2026-02-05 | 13F | Cornerstone Wealth Management, LLC | 0 | -100,00 | 0 | |||||
| 2026-02-18 | 13F | GWM Advisors LLC | 79.920 | -3,51 | 2.955 | 0,44 | ||||
| 2026-02-12 | 13F | Hrt Financial Lp | 17.739 | 1 | ||||||
| 2026-02-06 | 13F | Hartford Funds Management Co LLC | 2.751.584 | -4,47 | 101.740 | -0,57 | ||||
| 2026-01-14 | 13F | Clarius Group, LLC | 178.572 | -7,87 | 6.603 | -4,12 | ||||
| 2026-02-13 | 13F | Stifel Financial Corp | 109.646 | 1.499,50 | 4.054 | 1.568,31 | ||||
| 2026-02-11 | 13F | Parallel Advisors, LLC | 5.243 | 0,00 | 194 | 3,76 | ||||
| 2026-02-12 | 13F | Commonwealth Equity Services, Llc | 57.001 | -3,27 | 2.108 | 105.250,00 | ||||
| 2026-02-13 | 13F | Ubs Asset Management Americas Inc | 1.989 | 74 | ||||||
| 2026-01-22 | 13F | Yarger Wealth Strategies, Llc | 6.609 | -2,91 | 244 | 1,24 | ||||
| 2026-02-02 | 13F | Truist Financial Corp | 110.323 | -22,92 | 4.079 | -19,77 | ||||
| 2026-02-11 | 13F | GW&K Investment Management, LLC | 724 | 0 | ||||||
| 2026-04-07 | 13F | CoreCap Advisors, LLC | 279 | 0,00 | 11 | 10,00 | ||||
| 2026-01-21 | 13F | Crux Wealth Advisors | 42.695 | -26,09 | 1.579 | -23,10 | ||||
| 2026-02-11 | 13F | Janney Montgomery Scott LLC | 6.282 | -5,92 | 0 | |||||
| 2026-04-08 | 13F | Fermata Advisors, LLC | 27.965 | -5,90 | 1.102 | 0,36 | ||||
| 2026-02-12 | 13F | Steward Partners Investment Advisory, Llc | 5.999 | -1,86 | 222 | 1,84 | ||||
| 2026-04-13 | 13F | IFP Advisors, Inc | 5.831 | 1,90 | 230 | 8,53 | ||||
| 2026-02-04 | 13F | Pensionmark Financial Group, Llc | 78.140 | 0,58 | 2.889 | 4,71 | ||||
| 2026-01-22 | 13F | Encompass Wealth Advisors, Llc | 5.816 | 0,00 | 215 | 4,37 | ||||
| 2026-04-15 | 13F | Sowa Financial Group, Inc. | 17.371 | -19,28 | 1 | |||||
| 2026-01-13 | 13F | Signature Securities Group Corporation | 49.772 | 1,36 | 1.840 | 5,50 | ||||
| 2026-01-15 | 13F | Foster & Motley Inc | 1.319.339 | -33,23 | 49 | -31,43 | ||||
| 2025-11-12 | 13F | Close Asset Management Ltd | 0 | -100,00 | 0 | |||||
| 2026-02-13 | 13F | Mill Creek Capital Advisors, LLC | 1.818.166 | -0,94 | 67.227 | 3,10 | ||||
| 2026-02-10 | 13F | Goldstein Advisors, LLC | 441.849 | -0,65 | 16.337 | 3,41 | ||||
| 2026-01-26 | 13F | Cwm, Llc | 3.283 | 0,00 | 0 | |||||
| 2026-04-14 | 13F | Thurston, Springer, Miller, Herd & Titak, Inc. | 6.497 | -15,43 | 256 | -9,86 | ||||
| 2026-02-05 | 13F | Allworth Financial LP | 21.664 | -0,48 | 801 | 3,62 | ||||
| 2026-02-17 | 13F | Susquehanna International Group, Llp | 0 | -100,00 | 0 | |||||
| 2026-02-17 | 13F | Fmr Llc | 5.856 | 22,10 | 217 | 27,06 | ||||
| 2026-04-07 | 13F | Howard Financial Services, Ltd. | 88.204 | -5,88 | 3.477 | 0,38 |