Grundlæggende statistik
| Institutionelle ejere | 119 total, 119 long only, 0 short only, 0 long/short - change of 4,39% MRQ |
| Gennemsnitlig porteføljeallokering | 0.4051 % - change of 0,83% MRQ |
| Institutionelle aktier (lange) | 16.389.304 (ex 13D/G) - change of 1,30MM shares 8,63% MRQ |
| Institutionel værdi (lang) | $ 385.789 USD ($1000) |
Institutionelt ejerskab og aktionærer
SSGA Active Trust - SPDR SSGA Multi-Asset Real Return ETF (US:RLY) har 119 institutionelle ejere og aktionærer, der har indsendt 13D/G- eller 13F-formularer til Securities Exchange Commission (SEC). Disse institutioner har i alt 16,389,304 aktier. Største aktionærer omfatter Hantz Financial Services, Inc., Envestnet Asset Management Inc, D.a. Davidson & Co., Corrigan Financial, Inc., Savant Capital, LLC, First International Bank & Trust, Morgan Stanley, Bank Of America Corp /de/, Capital Analysts, Inc., and New England Capital Financial Advisors LLC .
SSGA Active Trust - SPDR SSGA Multi-Asset Real Return ETF (ARCA:RLY) institutionel ejerskabsstruktur viser aktuelle positioner i virksomheden efter institutioner og fonde, samt seneste ændringer i positionsstørrelse. Større aktionærer kan omfatte individuelle investorer, investeringsforeninger, hedgefonde eller institutioner. Skema 13D angiver, at investoren besidder (eller besidder) mere end 5 % af virksomheden og har til hensigt (eller har til hensigt at) aktivt at forfølge en ændring i forretningsstrategi. Skema 13G indikerer en passiv investering på over 5%.
The share price as of September 10, 2025 is 30,51 / share. Previously, on September 11, 2024, the share price was 27,42 / share. This represents an increase of 11,27% over that period.

Fondens stemningsscore
Fund Sentiment Score (fka Ownership Accumulation Score) finder de aktier, der bliver mest købt af fonde. Det er resultatet af en sofistikeret, multi-faktor kvantitativ model, der identificerer virksomheder med de højeste niveauer af institutionel akkumulering. Scoringsmodellen bruger en kombination af den samlede stigning i oplyste ejere, ændringerne i porteføljeallokeringer i disse ejere og andre målinger. Tallet går fra 0 til 100, hvor højere tal indikerer et højere niveau af akkumulering for sine jævnaldrende, og 50 er gennemsnittet.
Opdateringsfrekvens: Dagligt
Se Ownership Explorer, som giver en liste over højest rangerende virksomheder.
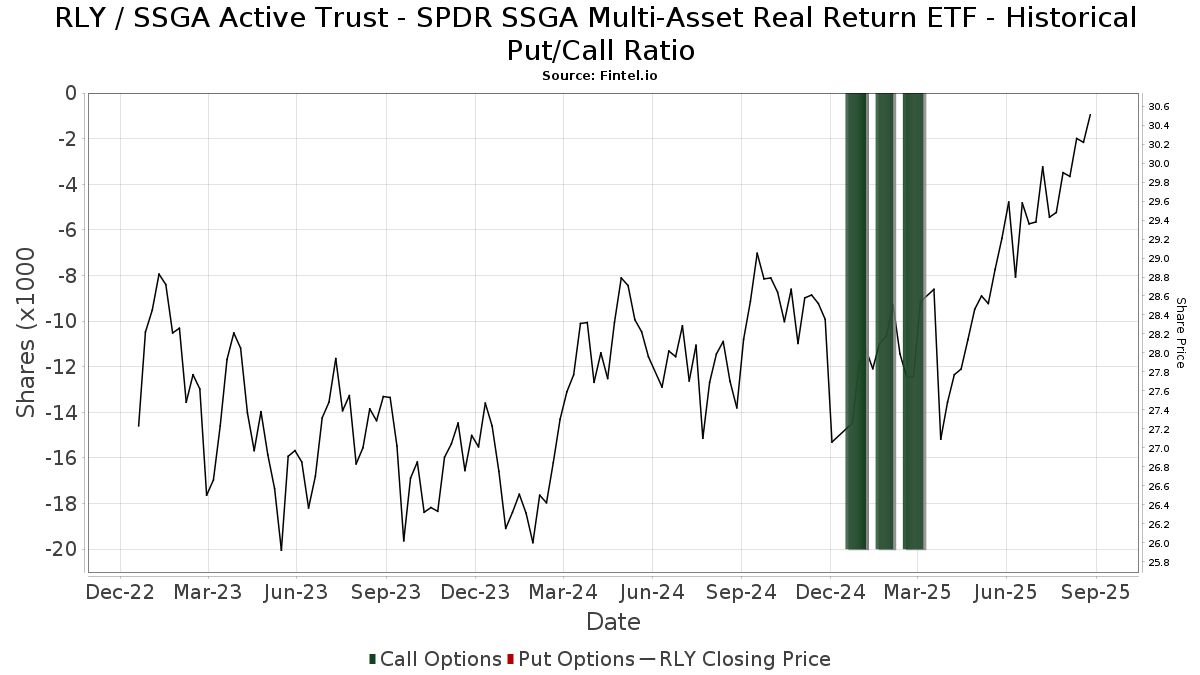
Institutionel Put/Call-forhold
Ud over at indberette standardaktie- og gældsudstedelser skal institutter med mere end 100 mill. aktiver under forvaltning også oplyse deres put- og call-optionsbeholdninger. Da salgsoptioner generelt indikerer negativ stemning, og købsoptioner indikerer positiv stemning, kan vi få en fornemmelse af den overordnede institutionelle stemning ved at plotte forholdet mellem put og kald. Diagrammet til højre viser det historiske put/call-forhold for dette instrument.
Brug af Put/Call Ratio som en indikator for investorernes stemning overvinder en af de vigtigste mangler ved at bruge totalt institutionelt ejerskab, som er, at en betydelig mængde af aktiver under forvaltning investeres passivt for at spore indekser. Passivt forvaltede fonde køber typisk ikke optioner, så indikatoren for put/call-forholdet følger mere nøje følelsen af aktivt forvaltede fonde.
13F og NPORT arkivering
Detaljer om 13F-arkivering er gratis. Detaljer om NP-ansøgninger kræver et premium-medlemskab. Grønne rækker angiver nye positioner. Røde rækker angiver lukkede positioner. Klik på linket ikon for at se den fulde transaktionshistorik.
Opgrader
for at låse premium-data op og eksportere til Excel ![]() .
.
| Fil dato | Kilde | Investor | Type | Gennemsnitlig pris (Øst) |
Aktier | Δ Aktier (%) |
Rapporteret Værdi ($1000) |
Δ Værdi (%) |
Port Alloc (%) |
|
|---|---|---|---|---|---|---|---|---|---|---|
| 2025-07-01 | 13F | Private Client Services, Llc | 110.787 | 45,41 | 3.223 | 48,21 | ||||
| 2025-08-11 | 13F | Strategic Wealth Partners, Ltd. | 56 | 2 | ||||||
| 2025-04-22 | 13F/A | NorthRock Partners, LLC | 0 | -100,00 | 0 | |||||
| 2025-08-08 | 13F | Principal Financial Group Inc | 18.118 | 527 | ||||||
| 2025-05-12 | 13F | Fmr Llc | 0 | -100,00 | 0 | |||||
| 2025-08-12 | 13F | Park Square Financial Group, LLC | 29 | 0,00 | 1 | |||||
| 2025-08-14 | 13F | Colony Group, LLC | 263.332 | 5,45 | 7.660 | 7,48 | ||||
| 2025-05-15 | 13F | Two Sigma Securities, Llc | 0 | -100,00 | 0 | -100,00 | ||||
| 2025-08-13 | 13F | Cheviot Value Management, LLC | 111 | 0,00 | 3 | 0,00 | ||||
| 2025-08-15 | 13F | Kestra Advisory Services, LLC | 26.110 | -0,62 | 760 | 1,34 | ||||
| 2025-08-07 | 13F | Prairieview Wealth Partners, Llc | 14.696 | 428 | ||||||
| 2025-08-14 | 13F | Comerica Bank | 1.088 | -46,54 | 32 | -46,55 | ||||
| 2025-08-05 | 13F | Bank Of Montreal /can/ | 8.474 | 0,00 | 247 | 2,07 | ||||
| 2025-08-13 | 13F | Shepherd Financial Partners LLC | 9.255 | -2,72 | 269 | -0,74 | ||||
| 2025-08-14 | 13F | Jane Street Group, Llc | 0 | -100,00 | 0 | |||||
| 2025-07-10 | 13F | Trust Point Inc. | 0 | -100,00 | 0 | |||||
| 2025-07-10 | 13F | Sovran Advisors, LLC | 0 | -100,00 | 0 | |||||
| 2025-08-06 | 13F | Horan Securities, Inc. | 42.838 | -4,13 | 1.246 | -2,27 | ||||
| 2025-08-08 | 13F | Larson Financial Group LLC | 127.870 | -37,83 | 3.720 | -36,64 | ||||
| 2025-07-28 | 13F | Private Wealth Asset Management, LLC | 125 | 4 | ||||||
| 2025-07-15 | 13F | Legacy Financial Group LLC | 20.526 | -2,46 | 597 | -0,50 | ||||
| 2025-08-14 | 13F | RMB Capital Management, LLC | 282.230 | 1,66 | 8.210 | 3,62 | ||||
| 2025-08-14 | 13F | Bank Of America Corp /de/ | 715.255 | -4,66 | 20.807 | -2,82 | ||||
| 2025-08-14 | 13F | Qube Research & Technologies Ltd | 177 | 5 | ||||||
| 2025-07-25 | 13F | Apollon Wealth Management, LLC | 80.410 | -0,49 | 2.339 | 1,43 | ||||
| 2025-08-12 | 13F | Proequities, Inc. | 0 | 0 | ||||||
| 2025-04-15 | 13F | Corrigan Financial, Inc. | 904.459 | 1,67 | 25.813 | 7,39 | ||||
| 2025-07-22 | 13F | Merit Financial Group, LLC | 18.077 | -34,22 | 526 | -33,04 | ||||
| 2025-08-14 | 13F | Coastal Bridge Advisors, LLC | 34.946 | 139,54 | 1.017 | 144,23 | ||||
| 2025-08-01 | 13F | Schmidt P J Investment Management Inc | 9.175 | 20,77 | 267 | 23,15 | ||||
| 2025-08-11 | 13F | Private Advisor Group, LLC | 16.120 | -22,70 | 469 | -21,34 | ||||
| 2025-07-08 | 13F | First International Bank & Trust | 804.999 | -6,29 | 23.417 | -4,49 | ||||
| 2025-08-28 | NP | MFUL - Mindful Conservative ETF | 55.795 | -26,07 | 1.623 | -20,40 | ||||
| 2025-08-12 | 13F | LPL Financial LLC | 303.410 | -17,10 | 8.826 | -15,51 | ||||
| 2025-07-17 | 13F | Eclectic Associates Inc /adv | 23.156 | -18,24 | 674 | -16,71 | ||||
| 2025-07-28 | 13F | Harbour Investments, Inc. | 3.159 | 14,91 | 92 | 16,67 | ||||
| 2025-08-11 | 13F | Regal Investment Advisors LLC | 78.336 | -3,20 | 2.279 | -1,34 | ||||
| 2025-08-14 | 13F | Wiley Bros.-aintree Capital, Llc | 0 | -100,00 | 0 | |||||
| 2025-08-14 | 13F | Visionary Wealth Advisors | 106.307 | -69,54 | 3.092 | -68,95 | ||||
| 2025-08-01 | 13F | Pasadena Private Wealth, LLC | 12.447 | 8,26 | 362 | 10,37 | ||||
| 2025-08-14 | 13F | Catalyst Financial Partners Llc | 37.822 | 24,93 | 1.100 | 27,31 | ||||
| 2025-05-02 | 13F | Fortress Wealth Management, Inc. | 0 | -100,00 | 0 | |||||
| 2025-08-14 | 13F | Betterment LLC | 15.254 | -61,72 | 0 | -100,00 | ||||
| 2025-08-14 | 13F | LaSalle St. Investment Advisors, LLC | 8.728 | 0,28 | 0 | |||||
| 2025-08-14 | 13F | Citadel Advisors Llc | Put | 0 | -100,00 | 0 | ||||
| 2025-07-16 | 13F/A | CX Institutional | 137 | 0,00 | 0 | |||||
| 2025-08-04 | 13F | HBK Sorce Advisory LLC | 10.261 | -44,66 | 298 | -43,67 | ||||
| 2025-08-13 | 13F | Keystone Financial Group | 19.012 | -1,21 | 553 | 0,73 | ||||
| 2025-08-04 | 13F | Hantz Financial Services, Inc. | 1.984.674 | 0,07 | 58 | 1,79 | ||||
| 2025-05-15 | 13F | Creative Planning | 0 | -100,00 | 0 | |||||
| 2025-08-04 | 13F | Flagship Harbor Advisors, Llc | 15.331 | -5,58 | 446 | -3,89 | ||||
| 2025-08-06 | 13F | Commonwealth Equity Services, Llc | 38.232 | 68,11 | 1 | |||||
| 2025-08-15 | 13F | First Heartland Consultants, Inc. | 311.211 | 18,92 | 9.053 | 21,22 | ||||
| 2025-08-14 | 13F | Royal Bank Of Canada | 8.363 | 2,85 | 244 | 5,17 | ||||
| 2025-07-21 | 13F | Ameritas Advisory Services, LLC | 2.115 | 62 | ||||||
| 2025-05-14 | 13F | Orion Portfolio Solutions, LLC | 27.370 | 0,00 | 740 | 0,00 | ||||
| 2025-07-14 | 13F | Harbor Group, Inc. | 298.862 | -0,30 | 8.694 | 1,61 | ||||
| 2025-08-26 | 13F/A | Thrivent Financial For Lutherans | 74.308 | 145,20 | 2 | |||||
| 2025-08-01 | 13F | Envestnet Asset Management Inc | 1.332.162 | 4,89 | 38.753 | 6,91 | ||||
| 2025-07-16 | 13F | Twelve Points Wealth Management LLC | 50.592 | 2,58 | 1.472 | 4,55 | ||||
| 2025-08-04 | 13F | Atria Investments Llc | 69.258 | 2,87 | 2.015 | 4,84 | ||||
| 2025-07-09 | 13F | Fermata Advisors, LLC | 8.653 | -0,93 | 252 | 0,80 | ||||
| 2025-08-05 | 13F | Aviance Capital Partners, LLC | 29.857 | -4,27 | 869 | -2,47 | ||||
| 2025-08-27 | 13F/A | Brinker Capital Investments, LLC | 14.009 | 408 | ||||||
| 2025-07-16 | 13F | MBE Wealth Management, LLC | 86.710 | 0,11 | 2.522 | 2,02 | ||||
| 2025-07-16 | 13F | Register Financial Advisors LLC | 39.715 | 6,11 | 1.155 | 8,15 | ||||
| 2025-08-06 | 13F | Golden State Wealth Management, LLC | 79 | 0,00 | 2 | 0,00 | ||||
| 2025-08-12 | 13F | Steward Partners Investment Advisory, Llc | 400 | 0,00 | 12 | 0,00 | ||||
| 2025-08-15 | 13F | Captrust Financial Advisors | 62.206 | 13,70 | 1.810 | 15,89 | ||||
| 2025-04-15 | 13F | Ellenbecker Investment Group | 0 | -100,00 | 0 | |||||
| 2025-08-12 | 13F | Auxano Advisors, LLC | 7.244 | -28,27 | 211 | -27,08 | ||||
| 2025-08-14 | 13F | Wells Fargo & Company/mn | 296.665 | 2,64 | 8.630 | 4,61 | ||||
| 2025-05-14 | 13F | TD Capital Management LLC | 0 | -100,00 | 0 | |||||
| 2025-08-12 | 13F | Barnes Pettey Financial Advisors, Llc | 17.961 | 18,20 | 522 | 20,55 | ||||
| 2025-08-13 | 13F | Jones Financial Companies Lllp | 1.072 | 62,42 | 31 | 72,22 | ||||
| 2025-08-04 | 13F | Creative Financial Designs Inc /adv | 19.053 | -3,39 | 554 | -1,42 | ||||
| 2025-08-13 | 13F | Capital Analysts, Inc. | 660.306 | 2,18 | 19 | 5,56 | ||||
| 2025-07-18 | 13F | Trilogy Capital Inc. | 398.184 | -3,15 | 11.583 | -1,29 | ||||
| 2025-08-14 | 13F | CoreCap Advisors, LLC | 0 | -100,00 | 0 | |||||
| 2025-08-07 | 13F | Tilson Financial Group, Inc. | 258.999 | -3,34 | 8 | 0,00 | ||||
| 2025-08-11 | 13F | Brass Tax Wealth Management, Inc | 9.444 | 0,00 | 275 | 1,86 | ||||
| 2025-07-28 | 13F | Davidson Trust Co | 8.414 | 245 | ||||||
| 2025-08-07 | 13F | Illumine Investment Management, LLC | 52.656 | 1,38 | 1.532 | 3,31 | ||||
| 2025-07-09 | 13F | Veracity Capital LLC | 14.813 | 17,53 | 431 | 19,78 | ||||
| 2025-08-11 | 13F | HighTower Advisors, LLC | 364.177 | 18,02 | 10.594 | 20,29 | ||||
| 2025-07-14 | 13F | Matrix Trust Co | 48.058 | -4,65 | 1 | 0,00 | ||||
| 2025-07-28 | 13F | Cornerstone Wealth Group, LLC | 7.936 | 0,00 | 231 | 1,77 | ||||
| 2025-07-23 | 13F | L.K. Benson & Company, P.C. | 9.132 | 0,37 | 266 | 2,32 | ||||
| 2025-07-25 | 13F | Cwm, Llc | 147 | 0 | ||||||
| 2025-08-14 | 13F | Raymond James Financial Inc | 315.239 | 52,37 | 9.170 | 55,32 | ||||
| 2025-08-11 | 13F | United Advisor Group, LLC | 35.194 | 32,59 | 1.024 | 35,14 | ||||
| 2025-07-10 | 13F | Wealth Enhancement Advisory Services, Llc | 53.089 | -18,73 | 1.567 | -15,99 | ||||
| 2025-08-13 | 13F | Continuum Advisory, LLC | 0 | -100,00 | 0 | |||||
| 2025-08-12 | 13F | Cornerstone Wealth Management, LLC | 15.464 | 12,23 | 450 | 14,25 | ||||
| 2025-08-11 | 13F | Principal Securities, Inc. | 458 | 49,67 | 13 | 62,50 | ||||
| 2025-08-12 | 13F | Eldridge Investment Advisors, Inc. | 333.177 | 4,12 | 9.692 | 6,13 | ||||
| 2025-08-05 | 13F | Bank of New York Mellon Corp | 41.627 | 103,93 | 1.211 | 107,90 | ||||
| 2025-07-16 | 13F | ORG Partners LLC | 758 | 0,80 | 22 | 4,76 | ||||
| 2025-08-08 | 13F | Intrua Financial, LLC | 118.354 | 165,92 | 3.443 | 171,02 | ||||
| 2025-08-14 | 13F | Freedom Financial Partners LLC | 299.579 | 6,17 | 8.715 | 8,23 | ||||
| 2025-08-14 | 13F/A | Skopos Labs, Inc. | 5.309 | 154 | ||||||
| 2025-08-14 | 13F | GWM Advisors LLC | 165 | 0,00 | 5 | 0,00 | ||||
| 2025-08-04 | 13F | Capital Performance Advisors Llp | 228.667 | 24,57 | 6.652 | 26,98 | ||||
| 2025-08-12 | 13F | Advisors Asset Management, Inc. | 16.794 | 52,58 | 489 | 55,41 | ||||
| 2025-08-14 | 13F | Susquehanna International Group, Llp | 10.074 | 24,89 | 293 | 27,39 | ||||
| 2025-05-13 | 13F | Equitable Holdings, Inc. | 0 | -100,00 | 0 | |||||
| 2025-08-08 | 13F | Cetera Investment Advisers | 19.930 | 3,14 | 580 | 5,08 | ||||
| 2025-09-04 | 13F/A | Advisor Group Holdings, Inc. | 25.648 | 26,50 | 746 | 29,07 | ||||
| 2025-08-14 | 13F | Citadel Advisors Llc | Call | 0 | -100,00 | 0 | ||||
| 2025-07-17 | 13F | KWB Wealth | 45.733 | 1.305 | ||||||
| 2025-05-12 | 13F | Jpmorgan Chase & Co | 0 | -100,00 | 0 | |||||
| 2025-08-28 | NP | NDOW - Anydrus Advantage ETF | 23.216 | 675 | ||||||
| 2025-05-15 | 13F | Citadel Advisors Llc | 0 | -100,00 | 0 | -100,00 | ||||
| 2025-07-15 | 13F | Retireful, LLC | 79.011 | 2.298 | ||||||
| 2025-08-08 | 13F | SBI Securities Co., Ltd. | 2.140 | -0,97 | 62 | 1,64 | ||||
| 2025-09-02 | 13F/A | FSC Wealth Advisors, LLC | 9.835 | -3,08 | 286 | -1,04 | ||||
| 2025-07-29 | 13F | Private Trust Co Na | 600 | 0,00 | 17 | 0,00 | ||||
| 2025-08-08 | 13F | New England Capital Financial Advisors LLC | 481.954 | -0,53 | 14.020 | 1,39 | ||||
| 2025-05-16 | 13F/A | Goldman Sachs Group Inc | 0 | -100,00 | 0 | -100,00 | ||||
| 2025-07-17 | 13F | XML Financial, LLC | 24.428 | 711 | ||||||
| 2025-07-17 | 13F | XY Planning Network, Inc. | 27.972 | 814 | ||||||
| 2025-07-31 | 13F | Cambridge Investment Research Advisors, Inc. | 20.622 | 34,01 | 1 | |||||
| 2025-08-20 | 13F/A | Coppell Advisory Solutions LLC | 10.467 | 304 | ||||||
| 2025-08-13 | 13F | Scotia Capital Inc. | 40.119 | -3,56 | 1.167 | -1,68 | ||||
| 2025-08-18 | NP | A3 Alternative Credit Fund | 0 | -100,00 | 0 | -100,00 | ||||
| 2025-08-12 | 13F | Global Retirement Partners, LLC | 5.029 | 527,06 | 146 | 595,24 | ||||
| 2025-07-22 | 13F | Miracle Mile Advisors, LLC | 16.858 | -0,28 | 490 | 1,66 | ||||
| 2025-08-11 | 13F | Advisor Resource Council | 0 | -100,00 | 0 | |||||
| 2025-08-14 | 13F | Federation des caisses Desjardins du Quebec | 4.000 | 0,00 | 116 | 1,75 | ||||
| 2025-08-15 | 13F | Morgan Stanley | 798.709 | 36,11 | 23.234 | 38,74 | ||||
| 2025-08-08 | 13F | Cornerstone Advisors Asset Management, Inc | 53.649 | 0,59 | 1.561 | 2,50 | ||||
| 2025-08-13 | 13F | Northwestern Mutual Wealth Management Co | 9 | -94,58 | 0 | -100,00 | ||||
| 2025-08-18 | 13F | Geneos Wealth Management Inc. | 102.091 | 53,68 | 2.970 | 56,68 | ||||
| 2025-07-08 | 13F | Parallel Advisors, LLC | 54 | 0,00 | 2 | 0,00 | ||||
| 2025-08-04 | 13F | IFG Advisory, LLC | 22.998 | 3,59 | 669 | 5,69 | ||||
| 2025-08-12 | 13F | MAI Capital Management | 1.518 | -10,44 | 44 | -8,33 | ||||
| 2025-08-14 | 13F | UBS Group AG | 77.850 | -43,04 | 2.265 | -41,95 | ||||
| 2025-08-13 | 13F | Independent Family Office, LLC | 39.611 | -6,35 | 1.152 | -4,56 | ||||
| 2025-07-30 | 13F | D.a. Davidson & Co. | 1.259.697 | 5,43 | 36.645 | 7,46 | ||||
| 2025-08-14 | 13F | Smartleaf Asset Management LLC | 0 | -100,00 | 0 | |||||
| 2025-08-06 | 13F | Savant Capital, LLC | 902.347 | 26.249 | ||||||
| 2025-07-11 | 13F | Farther Finance Advisors, LLC | 7.806 | 70.863,64 | 227 |