Grundlæggende statistik
| Institutionelle ejere | 123 total, 117 long only, 1 short only, 5 long/short - change of -0,81% MRQ |
| Gennemsnitlig porteføljeallokering | 0.3258 % - change of -12,34% MRQ |
| Institutionelle aktier (lange) | 274.935.796 (ex 13D/G) - change of 1,67MM shares 0,61% MRQ |
| Institutionel værdi (lang) | $ 563.981 USD ($1000) |
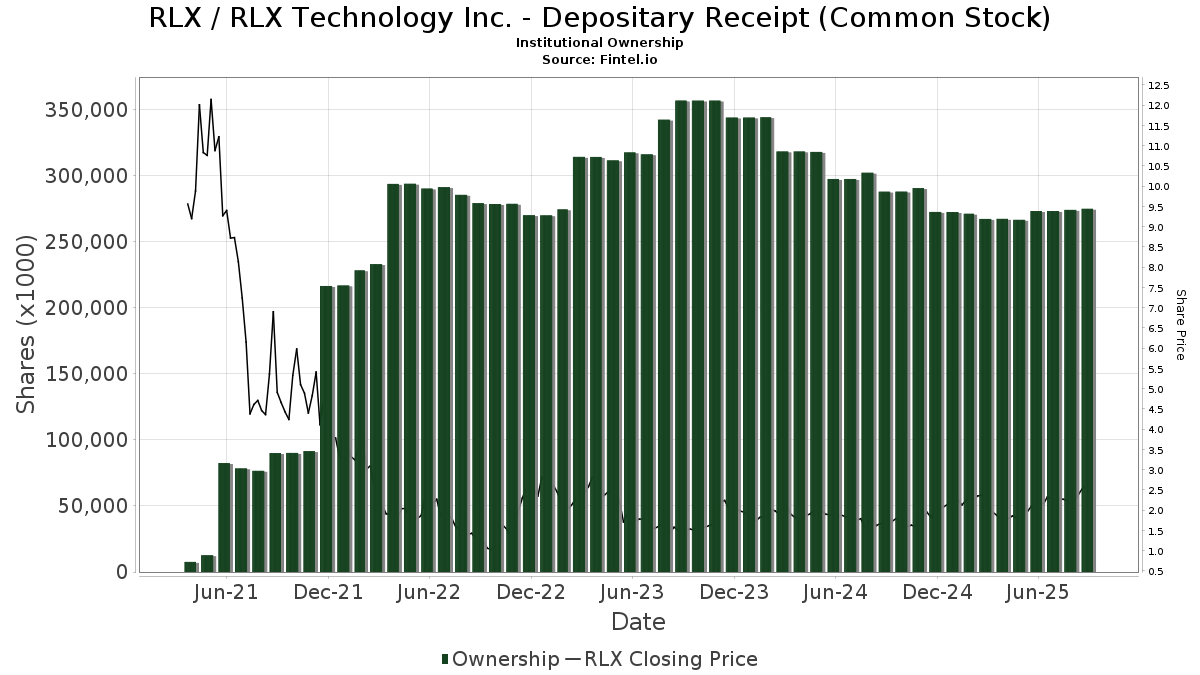
Institutionelt ejerskab og aktionærer
RLX Technology Inc. - Depositary Receipt (Common Stock) (US:RLX) har 123 institutionelle ejere og aktionærer, der har indsendt 13D/G- eller 13F-formularer til Securities Exchange Commission (SEC). Disse institutioner har i alt 274,963,174 aktier. Største aktionærer omfatter First Beijing Investment Ltd, IDG China Venture Capital Fund V Associates L.P., Vanguard Group Inc, Wildcat Capital Management, LLC, Aspex Management (HK) Ltd, Jane Street Group, Llc, VGTSX - Vanguard Total International Stock Index Fund Investor Shares, VEIEX - Vanguard Emerging Markets Stock Index Fund Investor Shares, BlackRock, Inc., and Goldman Sachs Group Inc .
RLX Technology Inc. - Depositary Receipt (Common Stock) (NYSE:RLX) institutionel ejerskabsstruktur viser aktuelle positioner i virksomheden efter institutioner og fonde, samt seneste ændringer i positionsstørrelse. Større aktionærer kan omfatte individuelle investorer, investeringsforeninger, hedgefonde eller institutioner. Skema 13D angiver, at investoren besidder (eller besidder) mere end 5 % af virksomheden og har til hensigt (eller har til hensigt at) aktivt at forfølge en ændring i forretningsstrategi. Skema 13G indikerer en passiv investering på over 5%.
The share price as of September 12, 2025 is 2,61 / share. Previously, on September 16, 2024, the share price was 1,65 / share. This represents an increase of 58,18% over that period.
Fondens stemningsscore
Fund Sentiment Score (fka Ownership Accumulation Score) finder de aktier, der bliver mest købt af fonde. Det er resultatet af en sofistikeret, multi-faktor kvantitativ model, der identificerer virksomheder med de højeste niveauer af institutionel akkumulering. Scoringsmodellen bruger en kombination af den samlede stigning i oplyste ejere, ændringerne i porteføljeallokeringer i disse ejere og andre målinger. Tallet går fra 0 til 100, hvor højere tal indikerer et højere niveau af akkumulering for sine jævnaldrende, og 50 er gennemsnittet.
Opdateringsfrekvens: Dagligt
Se Ownership Explorer, som giver en liste over højest rangerende virksomheder.
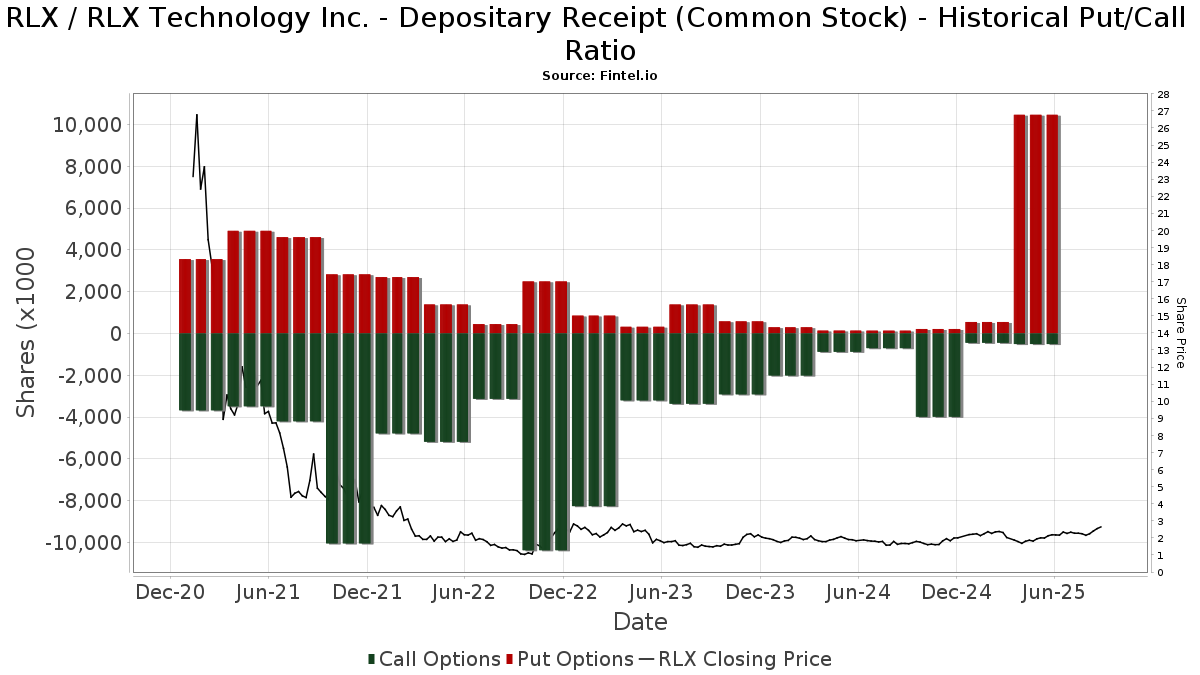
Institutionel Put/Call-forhold
Ud over at indberette standardaktie- og gældsudstedelser skal institutter med mere end 100 mill. aktiver under forvaltning også oplyse deres put- og call-optionsbeholdninger. Da salgsoptioner generelt indikerer negativ stemning, og købsoptioner indikerer positiv stemning, kan vi få en fornemmelse af den overordnede institutionelle stemning ved at plotte forholdet mellem put og kald. Diagrammet til højre viser det historiske put/call-forhold for dette instrument.
Brug af Put/Call Ratio som en indikator for investorernes stemning overvinder en af de vigtigste mangler ved at bruge totalt institutionelt ejerskab, som er, at en betydelig mængde af aktiver under forvaltning investeres passivt for at spore indekser. Passivt forvaltede fonde køber typisk ikke optioner, så indikatoren for put/call-forholdet følger mere nøje følelsen af aktivt forvaltede fonde.
13F og NPORT arkivering
Detaljer om 13F-arkivering er gratis. Detaljer om NP-ansøgninger kræver et premium-medlemskab. Grønne rækker angiver nye positioner. Røde rækker angiver lukkede positioner. Klik på linket ikon for at se den fulde transaktionshistorik.
Opgrader
for at låse premium-data op og eksportere til Excel ![]() .
.
| Fil dato | Kilde | Investor | Type | Gennemsnitlig pris (Øst) |
Aktier | Δ Aktier (%) |
Rapporteret Værdi ($1000) |
Δ Værdi (%) |
Port Alloc (%) |
|
|---|---|---|---|---|---|---|---|---|---|---|
| 2025-08-13 | 13F | Invesco Ltd. | 555.756 | -5,84 | 1.228 | 10,73 | ||||
| 2025-06-27 | NP | PGJ - Invesco Golden Dragon China ETF This fund is a listed as child fund of Invesco Ltd. and if that institution has disclosed ownership in this security, then these positions will not be double counted when calculating total shares and total value | 586.875 | 9,88 | 1.092 | -7,93 | ||||
| 2025-08-27 | NP | TIFF INVESTMENT PROGRAM - TIFF Multi-Asset Fund | Short | -27.378 | 1,05 | -61 | 20,00 | |||
| 2025-08-05 | 13F | Simplex Trading, Llc | Put | 6.000 | -93,40 | 0 | ||||
| 2025-08-14 | 13F | Fmr Llc | 732 | -13,88 | 2 | 0,00 | ||||
| 2025-08-14 | 13F | Point72 Hong Kong Ltd | 0 | -100,00 | 0 | |||||
| 2025-05-15 | 13F | Bayesian Capital Management, LP | 0 | -100,00 | 0 | |||||
| 2025-08-26 | NP | AZBAX - AllianzGI Small-Cap Fund Class A | 43.796 | 97 | ||||||
| 2025-08-14 | 13F | Royal Bank Of Canada | 12.197 | 21,97 | 27 | 42,11 | ||||
| 2025-08-07 | 13F | Allworth Financial LP | 3.057 | 0,00 | 7 | 20,00 | ||||
| 2025-08-05 | 13F | Simplex Trading, Llc | 238.373 | 119,33 | 1 | |||||
| 2025-08-08 | 13F | Creative Planning | 72.419 | -6,17 | 160 | 10,34 | ||||
| 2025-05-15 | 13F | Caption Management, LLC | Call | 0 | -100,00 | 0 | -100,00 | |||
| 2025-08-05 | 13F | Simplex Trading, Llc | Call | 10.600 | -33,75 | 0 | ||||
| 2025-04-17 | 13F | Vista Wealth Management Group, LLC | 2.061.263 | 0,00 | 3.875 | -12,96 | ||||
| 2025-08-08 | 13F | Police & Firemen's Retirement System of New Jersey | 130.114 | 0,00 | 288 | 17,62 | ||||
| 2025-08-12 | 13F | XTX Topco Ltd | 333.267 | 242,08 | 737 | 302,19 | ||||
| 2025-08-14 | 13F | Jain Global LLC | 22.900 | 51 | ||||||
| 2025-08-14 | 13F | Susquehanna Fundamental Investments, Llc | 0 | -100,00 | 0 | |||||
| 2025-06-26 | NP | FTIHX - Fidelity Total International Index Fund This fund is a listed as child fund of Fmr Llc and if that institution has disclosed ownership in this security, then these positions will not be double counted when calculating total shares and total value | 176.446 | -9,73 | 328 | -24,25 | ||||
| 2025-08-13 | 13F | EverSource Wealth Advisors, LLC | 3.143 | 7 | ||||||
| 2025-08-14 | 13F | Point72 Asset Management, L.P. | 0 | -100,00 | 0 | |||||
| 2025-07-21 | 13F | Mirae Asset Global Investments Co., Ltd. | 22.087 | 7,29 | 49 | 23,08 | ||||
| 2025-04-23 | 13F | Continuum Advisory, LLC | 0 | -100,00 | 0 | |||||
| 2025-08-14 | 13F | Oasis Management Co Ltd. | 6.037.031 | 5,49 | 13.342 | 24,01 | ||||
| 2025-05-15 | 13F | Lazard Asset Management Llc | 0 | -100,00 | 0 | |||||
| 2025-07-25 | 13F | JustInvest LLC | 40.168 | 73,83 | 89 | 104,65 | ||||
| 2025-08-12 | 13F | Proequities, Inc. | Put | 0 | 0 | |||||
| 2025-05-14 | 13F | Walleye Trading LLC | Call | 0 | -100,00 | 0 | ||||
| 2025-08-12 | 13F | Proequities, Inc. | Call | 0 | 0 | |||||
| 2025-08-18 | 13F | Wolverine Trading, Llc | Call | 27.500 | -17,91 | 61 | -3,17 | |||
| 2025-05-15 | 13F | Boothbay Fund Management, Llc | 0 | -100,00 | 0 | |||||
| 2025-08-12 | 13F | Proequities, Inc. | 0 | 0 | ||||||
| 2025-08-14 | 13F | Point72 Asia (Singapore) Pte. Ltd. | 0 | -100,00 | 0 | |||||
| 2025-05-12 | 13F | Pinpoint Asset Management Ltd | 49.850 | -71,99 | 94 | -75,78 | ||||
| 2025-08-28 | NP | GXC - SPDR(R) S&P(R) CHINA ETF | 112.832 | -10,17 | 249 | 5,51 | ||||
| 2025-08-14 | 13F | Susquehanna International Group, Llp | Put | 48.300 | 20,45 | 107 | 41,33 | |||
| 2025-08-12 | 13F | IDG China Venture Capital Fund V Associates L.P. | 60.068.870 | 0,00 | 132.752 | 17,55 | ||||
| 2025-08-14 | 13F | Susquehanna International Group, Llp | 603.723 | 5.794,01 | 1.334 | 6.921,05 | ||||
| 2025-08-14 | 13F | Ubs Asset Management Americas Inc | 624.467 | -6,39 | 1.380 | 10,05 | ||||
| 2025-07-31 | 13F | Ground Swell Capital, LLC | 0 | -100,00 | 0 | -100,00 | ||||
| 2025-08-14 | 13F | Susquehanna International Group, Llp | Call | 81.600 | -59,32 | 180 | -52,25 | |||
| 2025-07-31 | 13F | Caitong International Asset Management Co., Ltd | 1.255 | 1.083,96 | 3 | |||||
| 2025-08-13 | 13F | Quadrant Capital Group Llc | 50.078 | -35,31 | 111 | -24,14 | ||||
| 2025-08-28 | NP | SPGM - SPDR(R) Portfolio MSCI Global Stock Market ETF | 37.407 | 2,96 | 83 | 20,59 | ||||
| 2025-08-12 | 13F | Clear Street Markets Llc | 19.288 | 156,49 | 43 | 200,00 | ||||
| 2025-08-28 | NP | QCSTRX - Stock Account Class R1 | 275.300 | -13,29 | 608 | 2,01 | ||||
| 2025-07-25 | 13F | Apollon Wealth Management, LLC | 13.000 | 0,00 | 29 | 16,67 | ||||
| 2025-04-15 | 13F | Ameliora Wealth Management Ltd. | 0 | -100,00 | 0 | |||||
| 2025-07-16 | 13F | Signaturefd, Llc | 58.136 | -6,61 | 128 | 9,40 | ||||
| 2025-07-14 | 13F | Ridgewood Investments LLC | 16.000 | 0,00 | 35 | 16,67 | ||||
| 2025-08-11 | 13F | Citigroup Inc | 5.870 | 13 | ||||||
| 2025-08-11 | 13F | Vanguard Group Inc | 27.035.683 | -3,22 | 59.749 | 13,77 | ||||
| 2025-08-01 | 13F | Y-Intercept (Hong Kong) Ltd | 44.757 | 99 | ||||||
| 2025-08-14 | 13F | Headlands Technologies LLC | 1.225 | -95,25 | 3 | -95,83 | ||||
| 2025-05-09 | 13F | Pnc Financial Services Group, Inc. | 0 | -100,00 | 0 | |||||
| 2025-08-14 | 13F | Optiver Holding B.V. | 1 | -100,00 | 0 | -100,00 | ||||
| 2025-07-25 | NP | ECNS - iShares MSCI China Small-Cap ETF | 155.216 | -6,19 | 320 | -22,38 | ||||
| 2025-08-15 | 13F | Tower Research Capital LLC (TRC) | 54.064 | 308,18 | 119 | 395,83 | ||||
| 2025-08-12 | 13F | Rhumbline Advisers | 9.185 | 0,00 | 20 | 17,65 | ||||
| 2025-08-28 | NP | SSGVX - State Street Global Equity ex-U.S. Index Portfolio State Street Global All Cap Equity ex-U.S. Index Portfolio This fund is a listed as child fund of State Street Corp and if that institution has disclosed ownership in this security, then these positions will not be double counted when calculating total shares and total value | 89.100 | -66,12 | 197 | -60,32 | ||||
| 2025-07-25 | NP | SCHE - Schwab Emerging Markets Equity ETF This fund is a listed as child fund of Charles Schwab Investment Management Inc and if that institution has disclosed ownership in this security, then these positions will not be double counted when calculating total shares and total value | 866.827 | 0,00 | 1.786 | -17,28 | ||||
| 2025-06-23 | NP | UGPIX - UltraChina ProFund Investor Class | 27.007 | -30,41 | 50 | -41,86 | ||||
| 2025-08-13 | 13F | Pictet Asset Management Holding SA | 198.067 | -24,07 | 438 | -10,82 | ||||
| 2025-08-14 | 13F | Barometer Capital Management Inc. | 0 | -100,00 | 0 | |||||
| 2025-08-13 | 13F | West Family Investments, Inc. | 41.577 | 0,00 | 92 | 16,67 | ||||
| 2025-08-13 | 13F | Russell Investments Group, Ltd. | 150.038 | 0,00 | 332 | 17,38 | ||||
| 2025-08-07 | 13F | Connor, Clark & Lunn Investment Management Ltd. | 1.603.605 | 15,30 | 3.544 | 35,54 | ||||
| 2025-08-26 | NP | FLAX - Franklin FTSE Asia ex Japan ETF | 2.466 | -11,80 | 5 | 0,00 | ||||
| 2025-08-14 | 13F | Cache Advisors, LLC | 71.777 | 0,00 | 159 | 17,91 | ||||
| 2025-08-15 | 13F | Morgan Stanley | 4.111.174 | -26,78 | 9.086 | -13,94 | ||||
| 2025-04-22 | NP | APIE - ActivePassive International Equity ETF | 0 | -100,00 | 0 | -100,00 | ||||
| 2025-05-15 | 13F | Parallax Volatility Advisers, L.P. | Call | 0 | -100,00 | 0 | ||||
| 2025-08-13 | 13F | Quadrature Capital Ltd | 88.297 | 229,00 | 195 | 290,00 | ||||
| 2025-08-14 | 13F | Orland Properties Ltd | 4.612.138 | -17,82 | 10.193 | -3,39 | ||||
| 2025-07-15 | 13F | Public Employees Retirement System Of Ohio | 323.016 | 9,22 | 714 | 28,24 | ||||
| 2025-08-14 | 13F | Aqr Capital Management Llc | 0 | -100,00 | 0 | |||||
| 2025-08-14 | 13F | Mariner, LLC | 21.770 | -15,45 | 48 | 0,00 | ||||
| 2025-08-14 | 13F | State Street Corp | 3.477.238 | -4,10 | 7.685 | 12,73 | ||||
| 2025-05-13 | 13F | Quantbot Technologies LP | 0 | -100,00 | 0 | -100,00 | ||||
| 2025-08-04 | 13F | Assetmark, Inc | 147 | 0 | ||||||
| 2025-07-29 | NP | RBB FUND, INC. - Aquarius International Fund | 23.295 | 0,00 | 48 | -18,97 | ||||
| 2025-07-11 | 13F | Assenagon Asset Management S.A. | 580.015 | 1.282 | ||||||
| 2025-08-07 | 13F | Profund Advisors Llc | 33.299 | -12,42 | 74 | 2,82 | ||||
| 2025-08-14 | 13F | Susquehanna Portfolio Strategies, LLC | 301.058 | 665 | ||||||
| 2025-06-30 | NP | VEU - Vanguard FTSE All-World ex-US Index Fund ETF Shares | 1.498.147 | 3,99 | 2.787 | -12,88 | ||||
| 2025-08-08 | 13F | Geode Capital Management, Llc | 183.824 | -5,65 | 406 | 10,93 | ||||
| 2025-08-14 | 13F | GWM Advisors LLC | 1.000 | 0,00 | 2 | 100,00 | ||||
| 2025-08-05 | 13F | NewSquare Capital LLC | 150 | 0 | ||||||
| 2025-08-14 | 13F | Polymer Capital Management (HK) LTD | 859.867 | 1.900 | ||||||
| 2025-07-25 | NP | EEMS - iShares MSCI Emerging Markets Small-Cap ETF | 91.509 | 3,51 | 189 | -14,55 | ||||
| 2025-08-14 | 13F | Colony Group, LLC | 1.946.802 | 4.302 | ||||||
| 2025-08-14 | 13F | Wetherby Asset Management Inc | 49.890 | -4,33 | 110 | -1,79 | ||||
| 2025-05-19 | 13F/A | Jane Street Group, Llc | Call | 0 | -100,00 | 0 | -100,00 | |||
| 2025-05-09 | 13F | GeoWealth Management, LLC | 0 | -100,00 | 0 | |||||
| 2025-07-24 | 13F | Us Bancorp \de\ | 13.823 | -48,13 | 31 | -40,00 | ||||
| 2025-08-13 | 13F | Northern Trust Corp | 679.951 | -7,04 | 1.503 | 9,24 | ||||
| 2025-08-15 | 13F | First Beijing Investment Ltd | 62.864.424 | 53,19 | 138.930 | 80,08 | ||||
| 2025-08-14 | 13F | Boston Private Wealth Llc | 0 | -100,00 | 0 | |||||
| 2025-07-15 | 13F | Ballentine Partners, LLC | 14.745 | 0,00 | 33 | 18,52 | ||||
| 2025-06-30 | NP | VT - Vanguard Total World Stock Index Fund ETF Shares | 467.145 | 0,00 | 869 | -16,30 | ||||
| 2025-08-07 | 13F | Hosking Partners LLP | 2.025.895 | -3,24 | 4.477 | 13,74 | ||||
| 2025-05-12 | 13F | Virtu Financial LLC | 0 | -100,00 | 0 | |||||
| 2025-08-08 | 13F | SG Americas Securities, LLC | 263.907 | -1,67 | 1 | |||||
| 2025-06-30 | NP | VGTSX - Vanguard Total International Stock Index Fund Investor Shares | 10.137.501 | -0,61 | 18.856 | -16,73 | ||||
| 2025-08-27 | 13F | Abn Amro Investment Solutions | 0 | -100,00 | 0 | -100,00 | ||||
| 2025-08-27 | 13F/A | Squarepoint Ops LLC | Call | 0 | -100,00 | 0 | -100,00 | |||
| 2025-08-13 | 13F | Pinpoint Asset Management (Singapore) Pte. Ltd. | 49.850 | 110 | ||||||
| 2025-08-14 | 13F | Bank Of America Corp /de/ | 1.131.096 | -43,21 | 2.500 | -33,25 | ||||
| 2025-07-28 | 13F | BRYN MAWR TRUST Co | 720 | 0,00 | 2 | 0,00 | ||||
| 2025-08-12 | 13F | MAI Capital Management | 9.379 | 21 | ||||||
| 2025-08-14 | 13F | Canada Pension Plan Investment Board | 3.804.284 | 53,72 | 8.407 | 80,72 | ||||
| 2025-08-14 | 13F | Two Sigma Investments, Lp | 0 | -100,00 | 0 | |||||
| 2025-05-14 | 13F | Smartleaf Asset Management LLC | 0 | -100,00 | 0 | |||||
| 2025-08-14 | 13F/A | Barclays Plc | 6.155.466 | -2,99 | 14 | 18,18 | ||||
| 2025-08-14 | 13F | Hrt Financial Lp | 32.084 | -56,44 | 0 | |||||
| 2025-08-14 | 13F | D. E. Shaw & Co., Inc. | 6.017.137 | 35,22 | 13.298 | 58,96 | ||||
| 2025-08-12 | 13F | Nuveen, LLC | 208.700 | -34,27 | 461 | -22,65 | ||||
| 2025-05-15 | 13F | Cubist Systematic Strategies, LLC | 0 | -100,00 | 0 | |||||
| 2025-08-13 | 13F | Hsbc Holdings Plc | 201.947 | 2,18 | 446 | 20,22 | ||||
| 2025-08-14 | 13F | Alliancebernstein L.p. | 128.240 | 0,00 | 283 | 17,43 | ||||
| 2025-07-18 | 13F | Wildcat Capital Management, LLC | 18.046.195 | 0,00 | 39.882 | 17,56 | ||||
| 2025-05-05 | 13F | Lindbrook Capital, Llc | 3.149 | -18,82 | 6 | -37,50 | ||||
| 2025-05-12 | 13F | FIL Ltd | 0 | -100,00 | 0 | |||||
| 2025-07-08 | 13F | Parallel Advisors, LLC | 17.193 | -15,18 | 38 | -2,63 | ||||
| 2025-08-14 | 13F | Group One Trading, L.p. | 4.276 | 9 | ||||||
| 2025-07-22 | 13F | Gsa Capital Partners Llp | 181.488 | 0 | ||||||
| 2025-08-14 | 13F | Group One Trading, L.p. | Put | 142.300 | -10,39 | 314 | 5,37 | |||
| 2025-08-14 | 13F | Goldman Sachs Group Inc | 8.479.968 | 0,83 | 18.741 | 18,53 | ||||
| 2025-08-14 | 13F | Group One Trading, L.p. | Call | 365.600 | 127,36 | 808 | 167,22 | |||
| 2025-06-26 | NP | IXUS - iShares Core MSCI Total International Stock ETF | 729.181 | 0,83 | 1.356 | -15,51 | ||||
| 2025-08-08 | 13F | SBI Securities Co., Ltd. | 4.786 | -0,27 | 11 | 11,11 | ||||
| 2025-08-13 | 13F | Wealthquest Corp | 0 | -100,00 | 0 | -100,00 | ||||
| 2025-08-13 | 13F | Aspex Management (HK) Ltd | 12.123.409 | 0,00 | 27 | 18,18 | ||||
| 2025-08-14 | 13F | Two Sigma Advisers, Lp | 18.100 | -51,34 | 40 | -42,03 | ||||
| 2025-08-14 | 13F | Jane Street Group, Llc | 4.286.183 | 186,92 | 9.472 | 237,32 | ||||
| 2025-07-23 | 13F | Shell Asset Management Co | 28.411 | 0,00 | 0 | |||||
| 2025-08-12 | 13F | BlackRock, Inc. | 8.893.303 | -5,86 | 19.654 | 10,66 | ||||
| 2025-08-26 | NP | FLCH - Franklin FTSE China ETF | 46.736 | 1,23 | 103 | 19,77 | ||||
| 2025-04-21 | 13F | Catalina Capital Group, LLC | 0 | -100,00 | 0 | |||||
| 2025-08-27 | 13F/A | Squarepoint Ops LLC | Put | 0 | -100,00 | 0 | -100,00 | |||
| 2025-08-14 | 13F | Citadel Advisors Llc | Put | 49.000 | 2,73 | 108 | 21,35 | |||
| 2025-08-14 | 13F | Perseverance Asset Management International | 6.643.226 | -24,04 | 14.682 | -10,71 | ||||
| 2025-08-14 | 13F | Citadel Advisors Llc | 2.359.964 | -12,44 | 5.216 | 2,94 | ||||
| 2025-08-14 | 13F | Man Group plc | 0 | -100,00 | 0 | |||||
| 2025-08-14 | 13F | Citadel Advisors Llc | Call | 20.800 | -42,22 | 46 | -32,84 | |||
| 2025-06-24 | NP | TLTE - FlexShares Morningstar Emerging Markets Factor Tilt Index Fund | 14.168 | 684,06 | 26 | 550,00 | ||||
| 2025-06-30 | NP | VEIEX - Vanguard Emerging Markets Stock Index Fund Investor Shares | 9.134.015 | 0,77 | 16.989 | -15,57 | ||||
| 2025-08-28 | NP | SPEM - SPDR(R) Portfolio Emerging Markets ETF | 1.054.403 | 9,52 | 2.330 | 28,80 | ||||
| 2025-08-12 | 13F | Charles Schwab Investment Management Inc | 866.827 | 0,00 | 1.916 | 17,56 | ||||
| 2025-07-17 | 13F | Janney Montgomery Scott LLC | 10.000 | 0,00 | 0 | |||||
| 2025-07-24 | 13F | Ronald Blue Trust, Inc. | 122 | 0,00 | 0 | |||||
| 2025-08-12 | 13F | Legal & General Group Plc | 761.154 | -1,90 | 1.684 | 15,27 | ||||
| 2025-08-14 | 13F | Jane Street Group, Llc | Put | 10.216.500 | 4.687,49 | 22.578 | 5.530,42 | |||
| 2025-08-13 | 13F | Renaissance Technologies Llc | 886.100 | -0,02 | 1.958 | 17,53 | ||||
| 2025-08-14 | 13F | Engineers Gate Manager LP | 0 | -100,00 | 0 | |||||
| 2025-08-14 | 13F | Vident Advisory, LLC | 53.831 | -5,44 | 119 | 10,28 | ||||
| 2025-08-14 | 13F | LMR Partners LLP | 29.358 | 0,00 | 65 | 16,36 | ||||
| 2025-08-14 | 13F | Point72 (DIFC) Ltd | 0 | -100,00 | 0 | |||||
| 2025-08-13 | 13F | BRIGHT VALLEY CAPITAL Ltd | 0 | -100,00 | 0 | |||||
| 2025-08-14 | 13F | Millennium Management Llc | 894.411 | -70,00 | 1.977 | -64,74 | ||||
| 2025-08-18 | 13F/A | Nomura Holdings Inc | 2.590.622 | -53,37 | 5.725 | -45,18 | ||||
| 2025-08-27 | 13F/A | Squarepoint Ops LLC | 112.078 | -45,05 | 248 | -35,51 | ||||
| 2025-08-13 | 13F | Marshall Wace, Llp | 1.133.093 | 29,35 | 2.504 | 52,13 | ||||
| 2025-08-14 | 13F | UBS Group AG | 526.467 | -57,09 | 1.163 | -49,57 | ||||
| 2025-07-25 | NP | IEMG - iShares Core MSCI Emerging Markets ETF | 3.663.205 | 1,30 | 7.546 | -16,19 | ||||
| 2025-08-12 | 13F | Franklin Resources Inc | 472.256 | -4,06 | 1.044 | 12,76 | ||||
| 2025-08-12 | 13F | Jpmorgan Chase & Co | 7.225 | -99,73 | 16 | -99,70 | ||||
| 2025-08-07 | 13F | Sierra Ocean, Llc | 534 | 0,00 | 1 | 0,00 | ||||
| 2025-08-28 | NP | GMF - SPDR(R) S&P(R) EMERGING ASIA PACIFIC ETF | 37.602 | -6,51 | 83 | 10,67 |
Other Listings
| DE:3CM | 2,22 € |