Grundlæggende statistik
| Institutionelle ejere | 174 total, 174 long only, 0 short only, 0 long/short - change of 12,99% MRQ |
| Gennemsnitlig porteføljeallokering | 0.1328 % - change of 10,23% MRQ |
| Institutionelle aktier (lange) | 7.500.090 (ex 13D/G) - change of 1,47MM shares 24,44% MRQ |
| Institutionel værdi (lang) | $ 262.256 USD ($1000) |
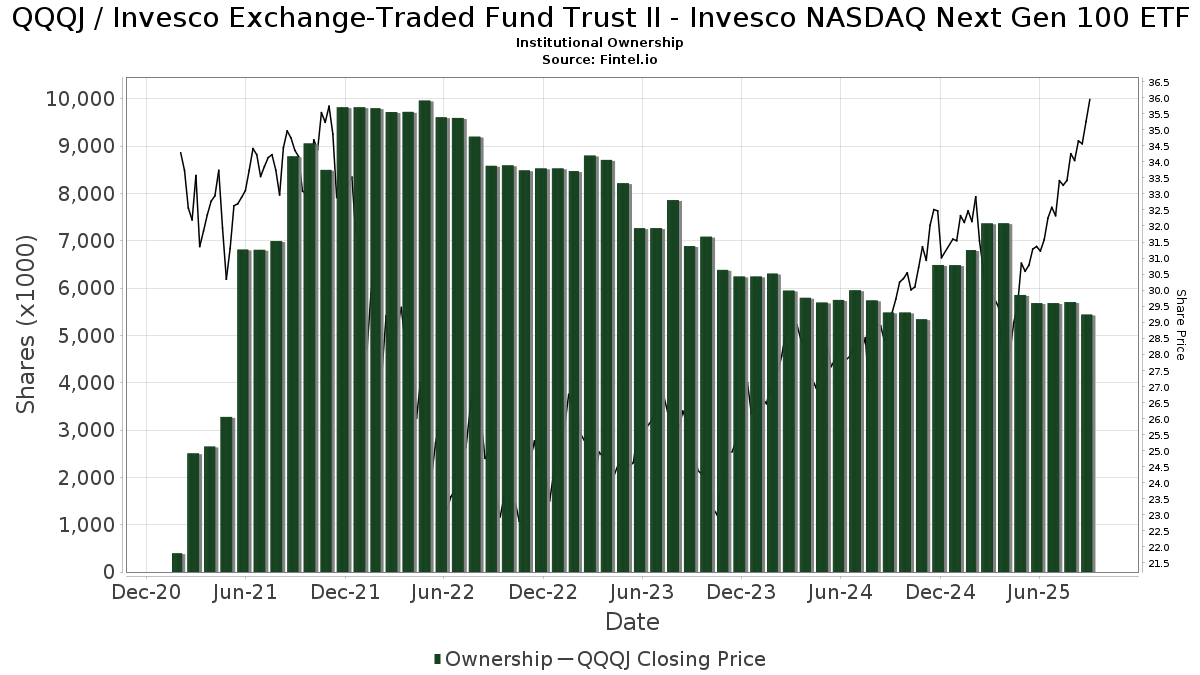
Institutionelt ejerskab og aktionærer
Invesco Exchange-Traded Fund Trust II - Invesco NASDAQ Next Gen 100 ETF (US:QQQJ) har 174 institutionelle ejere og aktionærer, der har indsendt 13D/G- eller 13F-formularer til Securities Exchange Commission (SEC). Disse institutioner har i alt 7,500,090 aktier. Største aktionærer omfatter Raymond James Financial Inc, Advisor Group Holdings, Inc., LRI Investments, LLC, Systelligence, LLC, LPL Financial LLC, Retirement Financial Solutions, Llc, Jones Financial Companies Lllp, Wells Fargo & Company/mn, Morgan Stanley, and Erickson Financial Group, LLC .
Invesco Exchange-Traded Fund Trust II - Invesco NASDAQ Next Gen 100 ETF (NasdaqGM:QQQJ) institutionel ejerskabsstruktur viser aktuelle positioner i virksomheden efter institutioner og fonde, samt seneste ændringer i positionsstørrelse. Større aktionærer kan omfatte individuelle investorer, investeringsforeninger, hedgefonde eller institutioner. Skema 13D angiver, at investoren besidder (eller besidder) mere end 5 % af virksomheden og har til hensigt (eller har til hensigt at) aktivt at forfølge en ændring i forretningsstrategi. Skema 13G indikerer en passiv investering på over 5%.
The share price as of April 14, 2026 is 39,90 / share. Previously, on April 15, 2025, the share price was 27,59 / share. This represents an increase of 44,62% over that period.
Fondens stemningsscore
Fund Sentiment Score (fka Ownership Accumulation Score) finder de aktier, der bliver mest købt af fonde. Det er resultatet af en sofistikeret, multi-faktor kvantitativ model, der identificerer virksomheder med de højeste niveauer af institutionel akkumulering. Scoringsmodellen bruger en kombination af den samlede stigning i oplyste ejere, ændringerne i porteføljeallokeringer i disse ejere og andre målinger. Tallet går fra 0 til 100, hvor højere tal indikerer et højere niveau af akkumulering for sine jævnaldrende, og 50 er gennemsnittet.
Opdateringsfrekvens: Dagligt
Se Ownership Explorer, som giver en liste over højest rangerende virksomheder.
AI+ Ask Fintel’s AI assistant about Invesco Exchange-Traded Fund Trust II - Invesco NASDAQ Next Gen 100 ETF.
Select a question to share a public post with an AI-crafted answer.
Thinking of good questions…
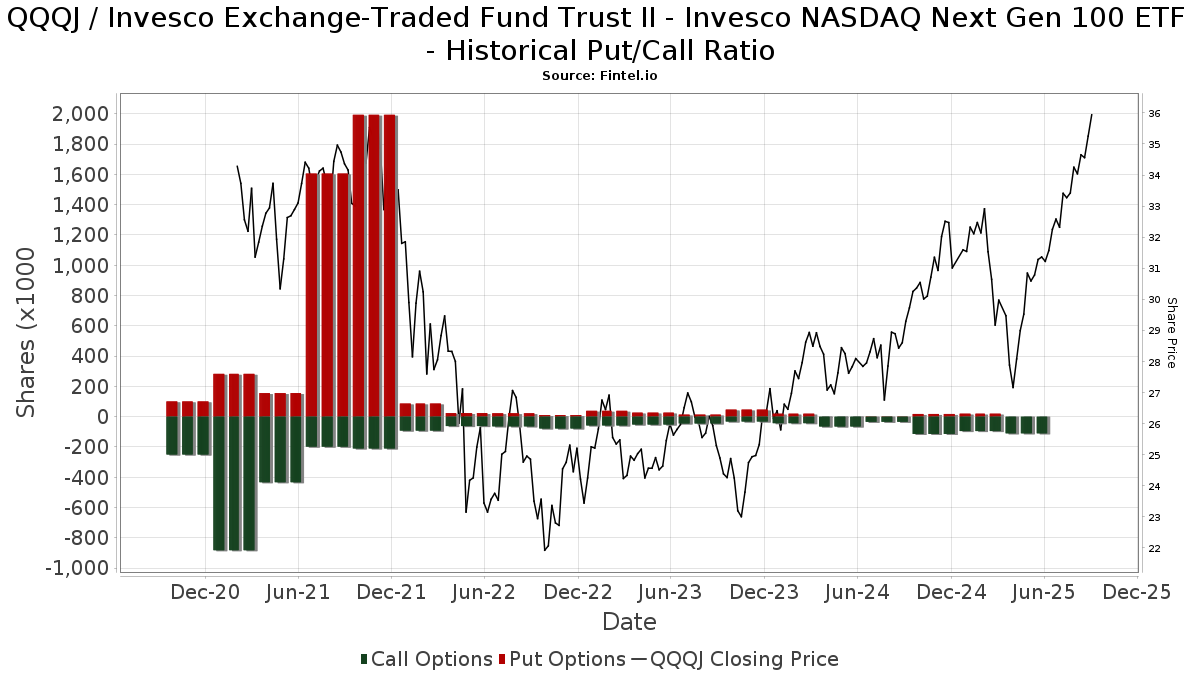
Institutionel Put/Call-forhold
Ud over at indberette standardaktie- og gældsudstedelser skal institutter med mere end 100 mill. aktiver under forvaltning også oplyse deres put- og call-optionsbeholdninger. Da salgsoptioner generelt indikerer negativ stemning, og købsoptioner indikerer positiv stemning, kan vi få en fornemmelse af den overordnede institutionelle stemning ved at plotte forholdet mellem put og kald. Diagrammet til højre viser det historiske put/call-forhold for dette instrument.
Brug af Put/Call Ratio som en indikator for investorernes stemning overvinder en af de vigtigste mangler ved at bruge totalt institutionelt ejerskab, som er, at en betydelig mængde af aktiver under forvaltning investeres passivt for at spore indekser. Passivt forvaltede fonde køber typisk ikke optioner, så indikatoren for put/call-forholdet følger mere nøje følelsen af aktivt forvaltede fonde.
13F og NPORT arkivering
Detaljer om 13F-arkivering er gratis. Detaljer om NP-ansøgninger kræver et premium-medlemskab. Grønne rækker angiver nye positioner. Røde rækker angiver lukkede positioner. Klik på linket ikon for at se den fulde transaktionshistorik.
Opgrader
for at låse premium-data op og eksportere til Excel ![]() .
.
| Fil dato | Kilde | Investor | Type | Gennemsnitlig pris (Øst) |
Aktier | Δ Aktier (%) |
Rapporteret Værdi ($1000) |
Δ Værdi (%) |
Port Alloc (%) |
|
|---|---|---|---|---|---|---|---|---|---|---|
| 2026-04-14 | 13F | Wealthcare Advisory Partners LLC | 156.545 | 1,40 | 5.668 | -0,37 | ||||
| 2026-02-13 | 13F | Quattro Advisors LLC | 30 | 1 | ||||||
| 2025-10-21 | 13F | Steel Peak Wealth Management LLC | 0 | -100,00 | 0 | |||||
| 2026-01-29 | 13F | Financial Life Planners | 0 | -100,00 | 0 | |||||
| 2026-02-02 | 13F | Ellis Investment Partners, LLC | 8.611 | -1,84 | 317 | 1,28 | ||||
| 2026-02-06 | 13F | GPS Wealth Strategies Group, LLC | 128 | -86,94 | 5 | -88,57 | ||||
| 2026-02-17 | 13F | Cape Investment Advisory, Inc. | 100 | 0,00 | 4 | 0,00 | ||||
| 2026-01-14 | 13F | Clarius Group, LLC | 20.601 | 0,00 | 759 | 2,99 | ||||
| 2026-01-21 | 13F | Crews Bank & Trust | 240 | 0,00 | 9 | 0,00 | ||||
| 2026-02-11 | 13F | Tradition Wealth Management, LLC | 51.182 | -3,10 | 1.886 | -0,21 | ||||
| 2026-02-17 | 13F | Citadel Advisors Llc | Call | 0 | -100,00 | 0 | ||||
| 2026-02-17 | 13F | Mercer Global Advisors Inc /adv | 7.049 | -29,40 | 260 | -27,45 | ||||
| 2026-01-20 | 13F | AdvisorNet Financial, Inc | 213 | 0,00 | 8 | 0,00 | ||||
| 2026-02-11 | 13F | Modus Advisors, LLC | 2.250 | 83 | ||||||
| 2026-02-13 | 13F | MAI Capital Management | 1.376 | 0,15 | 51 | 2,04 | ||||
| 2026-02-13 | 13F | Truvestments Capital Llc | 700 | 0,00 | 26 | 0,00 | ||||
| 2026-02-17 | 13F | Jones Financial Companies Lllp | 364.381 | 41,24 | 13.427 | 46,53 | ||||
| 2026-02-13 | 13F | Centaurus Financial, Inc. | 7.080 | -0,65 | 0 | |||||
| 2026-02-17 | 13F | Ameriprise Financial Inc | 138.418 | 11,91 | 5.104 | 15,30 | ||||
| 2026-02-05 | 13F | Granite Bay Wealth Management, LLC | 38.095 | 19,81 | 1.404 | 23,29 | ||||
| 2026-02-13 | 13F | National Bank Of Canada /fi/ | 2.448 | 2,51 | 90 | 5,88 | ||||
| 2026-02-12 | 13F | BlackRock, Inc. | 2 | -99,00 | 0 | -100,00 | ||||
| 2026-02-12 | 13F | CIBC Private Wealth Group, LLC | 9.242 | 2,33 | 341 | 5,26 | ||||
| 2026-01-20 | 13F | Nvwm, Llc | 135 | 0,00 | 5 | 0,00 | ||||
| 2026-04-13 | 13F | St Germain D J Co Inc | 103 | 0,00 | 4 | 0,00 | ||||
| 2026-03-04 | 13F | SHP Wealth Management | 8.560 | 315 | ||||||
| 2026-02-17 | 13F | Ancora Advisors, LLC | 6.300 | 0,00 | 232 | 3,11 | ||||
| 2026-02-17 | 13F | Ameriflex Group, Inc. | 50 | -50,00 | 2 | -66,67 | ||||
| 2026-02-17 | 13F | Bank Of America Corp /de/ | 177.409 | 0,98 | 6.538 | 3,96 | ||||
| 2026-01-30 | 13F | Jackson Hole Capital Partners, LLC | 0 | -100,00 | 0 | |||||
| 2026-01-12 | 13F | Roble, Belko & Company, Inc | 1.248 | -3,33 | 0 | |||||
| 2026-04-08 | 13F | Red Reef Advisors Llc | 8 | 0 | ||||||
| 2025-11-04 | 13F | Cornerstone Wealth Management, LLC | 0 | -100,00 | 0 | |||||
| 2025-11-14 | 13F | Goldman Sachs Group Inc | 0 | -100,00 | 0 | |||||
| 2026-02-09 | 13F | Ellerson Group Inc /adv | 27.421 | 1.010 | ||||||
| 2026-01-22 | 13F | HHM Wealth Advisors, LLC | 309 | 0,00 | 11 | 0,00 | ||||
| 2026-02-09 | 13F | Harbour Investments, Inc. | 786 | 32,77 | 29 | 33,33 | ||||
| 2026-02-03 | 13F | Winch Advisory Services, LLC | 984 | 0,20 | 36 | 2,86 | ||||
| 2026-01-29 | 13F | Quest 10 Wealth Builders, Inc. | 70 | 0,00 | 3 | 0,00 | ||||
| 2026-02-17 | 13F | United Capital Financial Advisers, Llc | 20.598 | 758 | ||||||
| 2026-01-20 | 13F | Coastal Investment Advisors, Inc. | 780 | 29 | ||||||
| 2026-04-07 | 13F | Farther Finance Advisors, LLC | 649 | 0,00 | 24 | 0,00 | ||||
| 2026-02-02 | 13F | Oppenheimer & Co Inc | 9.998 | 7,21 | 368 | 10,51 | ||||
| 2025-11-14 | 13F | Tower Research Capital LLC (TRC) | 0 | -100,00 | 0 | -100,00 | ||||
| 2025-11-14 | 13F | Strategic Wealth Partners, Ltd. | 100 | 0,00 | 4 | 0,00 | ||||
| 2026-02-11 | 13F | Capital Analysts, Inc. | 200 | 0,00 | 0 | |||||
| 2026-02-05 | 13F | Triton Wealth Management, PLLC | 5.368 | 205 | ||||||
| 2025-10-21 | 13F | Optimum Investment Advisors | 50 | 0,00 | 2 | 0,00 | ||||
| 2026-01-21 | 13F | Newbridge Financial Services Group, Inc. | 200 | 0,00 | 7 | 0,00 | ||||
| 2026-02-11 | 13F | Hughes Financial Services, LLC | 4 | 0,00 | 0 | |||||
| 2026-02-05 | 13F | Pinnacle Financial Group, LLC / IL | 5.796 | 214 | ||||||
| 2026-04-14 | 13F | Beacon Investment Advisory Services, Inc. | 130 | 5 | ||||||
| 2026-02-17 | 13F | Tannin Capital LLC | 27.230 | 1.003 | ||||||
| 2026-01-21 | 13F | Gerber, Llc | 45.356 | 0,00 | 1.671 | 2,96 | ||||
| 2026-01-26 | 13F | Cwm, Llc | 511 | 437,89 | 0 | |||||
| 2026-01-26 | 13F | Mirae Asset Global Investments Co., Ltd. | 28.059 | 0,00 | 1.034 | 2,89 | ||||
| 2026-02-06 | 13F | HighTower Advisors, LLC | 6.607 | 3,92 | 243 | 7,05 | ||||
| 2026-02-03 | 13F | SBI Securities Co., Ltd. | 281 | -29,93 | 10 | -28,57 | ||||
| 2026-02-17 | 13F | Coppell Advisory Solutions LLC | 14.738 | -21,36 | 9.129 | -18,64 | ||||
| 2026-02-13 | 13F | Aptus Capital Advisors, LLC | 584 | 0,00 | 22 | 5,00 | ||||
| 2026-02-17 | 13F | Optiver Holding B.V. | 0 | -100,00 | 0 | |||||
| 2026-01-26 | 13F | AE Wealth Management LLC | 128 | -7,25 | 5 | 0,00 | ||||
| 2026-01-28 | 13F | Retirement Planning Co of New England, Inc. | 7.477 | -13,04 | 276 | -10,42 | ||||
| 2026-02-13 | 13F | Kestra Advisory Services, LLC | 0 | -100,00 | 0 | |||||
| 2026-01-29 | 13F | RMR Wealth Builders | 13.318 | -14,56 | 491 | -12,03 | ||||
| 2026-02-11 | 13F | LPL Financial LLC | 467.342 | 22,80 | 17.222 | 26,44 | ||||
| 2026-02-12 | 13F | Steward Partners Investment Advisory, Llc | 13.417 | 0,00 | 494 | 2,92 | ||||
| 2026-02-13 | 13F | Pacific Center for Financial Services | 378 | 0,00 | 14 | 0,00 | ||||
| 2026-02-14 | 13F | Rockefeller Capital Management L.P. | 9.159 | 24,87 | 338 | 28,63 | ||||
| 2026-01-21 | 13F | Flagship Harbor Advisors, Llc | 5.020 | -19,86 | 185 | -17,86 | ||||
| 2026-01-27 | 13F | Jackson, Grant Investment Advisers, Inc. | 246 | 0,00 | 9 | 12,50 | ||||
| 2026-02-12 | 13F | Rossby Financial, LCC | 3.115 | 0,00 | 115 | 1,79 | ||||
| 2026-02-06 | 13F | Pnc Financial Services Group, Inc. | 781 | 178,93 | 29 | 180,00 | ||||
| 2026-02-12 | 13F | Hollencrest Capital Management | 138 | 0,00 | 5 | 25,00 | ||||
| 2026-02-06 | 13F | McKinley Carter Wealth Services, Inc. | 30.584 | -1,55 | 1.127 | 1,44 | ||||
| 2026-01-07 | 13F | Aventura Private Wealth, LLC | 700 | -11,84 | 26 | -10,71 | ||||
| 2026-02-02 | 13F | Cornerstone Planning Group LLC | 156 | 6 | ||||||
| 2026-02-10 | 13F | Natixis Advisors, L.p. | 12.097 | 0 | ||||||
| 2026-02-11 | 13F | Jpmorgan Chase & Co | 6.363 | 96,69 | 234 | 103,48 | ||||
| 2026-02-13 | 13F | Retirement Financial Solutions, Llc | 443.924 | -0,84 | 16.359 | 2,10 | ||||
| 2026-02-04 | 13F | Topsail Wealth Management, LLC | 3.455 | 7,80 | 127 | 11,40 | ||||
| 2026-01-13 | 13F | Stephens Consulting, LLC | 528 | 0,00 | 19 | 5,56 | ||||
| 2026-02-17 | 13F | Raymond James Financial Inc | 1.169.290 | 1,90 | 43.088 | 4,92 | ||||
| 2026-01-27 | 13F | TD Waterhouse Canada Inc. | 9.583 | -32,45 | 353 | -30,98 | ||||
| 2026-02-09 | 13F | Kingsview Wealth Management, LLC | 8.693 | 9,26 | 320 | 12,68 | ||||
| 2026-02-10 | 13F | Essex Financial Services, Inc. | 77.040 | -0,94 | 2.839 | 1,98 | ||||
| 2026-04-09 | 13F | DHJJ Financial Advisors, Ltd. | 14 | 0,00 | 1 | |||||
| 2026-02-03 | 13F | Legacy Wealth Managment, LLC/ID | 0 | -100,00 | 0 | |||||
| 2026-02-09 | 13F | Smithfield Trust Co | 657 | 0,00 | 0 | |||||
| 2026-04-08 | 13F | DiNuzzo Private Wealth, Inc. | 175 | 0,00 | 6 | 0,00 | ||||
| 2026-02-04 | 13F | Atlantic Union Bankshares Corp | 305 | 0,00 | 11 | 10,00 | ||||
| 2026-02-10 | 13F/A | Northwestern Mutual Wealth Management Co | 12.665 | 4,52 | 467 | 7,62 | ||||
| 2026-02-13 | 13F | Ubs Asset Management Americas Inc | 26 | 1 | ||||||
| 2026-02-03 | 13F | International Assets Investment Management, Llc | 700 | 26 | ||||||
| 2026-01-23 | 13F | Guidance Capital, Inc | 16.964 | 669 | ||||||
| 2026-02-03 | 13F | Sequoia Financial Advisors, LLC | 5.566 | 205 | ||||||
| 2026-02-12 | 13F | Federation des caisses Desjardins du Quebec | 611 | 0,00 | 23 | 4,76 | ||||
| 2026-02-02 | 13F | Truist Financial Corp | 8.782 | 13,83 | 324 | 17,03 | ||||
| 2026-02-17 | 13F | Creative Planning | 13.930 | 1,62 | 513 | 4,69 | ||||
| 2026-02-13 | 13F | Mariner, LLC | 32.441 | 4,22 | 1.195 | 7,37 | ||||
| 2025-11-14 | 13F/A | NorthRock Partners, LLC | 0 | -100,00 | 0 | |||||
| 2026-02-05 | 13F | AlphaCore Capital LLC | 300 | -66,25 | 11 | -64,52 | ||||
| 2026-02-13 | 13F | Goldstone Financial Group, LLC | 40.955 | 29,80 | 1.509 | 33,66 | ||||
| 2026-01-30 | 13F | Cannon Capital Management, Inc. | 21.562 | 795 | ||||||
| 2026-02-12 | 13F | Commonwealth Equity Services, Llc | 77.523 | 38,53 | 2.857 | 142.700,00 | ||||
| 2025-11-18 | 13F | Apexium Financial, Lp | 22.190 | -1,33 | 794 | 10,43 | ||||
| 2026-02-10 | 13F | Texas Yale Capital Corp. | 45.340 | 0,72 | 1.671 | 3,66 | ||||
| 2026-02-11 | 13F | Fortune Financial Group, Inc. | 8.175 | 0 | ||||||
| 2026-04-08 | 13F | Erickson Financial Group, LLC | 210.801 | 0,92 | 7.633 | -0,83 | ||||
| 2026-01-29 | 13F | Comerica Bank | 1.175 | 43 | ||||||
| 2026-02-12 | 13F | Wedbush Securities Inc | 17.641 | -3,33 | 1 | |||||
| 2026-02-06 | 13F | Global Retirement Partners, LLC | 4.606 | 0,13 | 170 | 3,05 | ||||
| 2025-11-17 | 13F | FSA Wealth Management LLC | 549 | -9,26 | 20 | 0,00 | ||||
| 2026-02-12 | 13F | Bank Of Montreal /can/ | 2.785 | -34,66 | 103 | -32,89 | ||||
| 2025-11-14 | 13F | Cardiff Park Advisors, Llc | 0 | -100,00 | 0 | |||||
| 2026-02-17 | 13F | Private Advisor Group, LLC | 9.939 | 2,19 | 366 | 5,17 | ||||
| 2026-02-19 | 13F | Invesco Ltd. | 45.332 | -8,55 | 1.670 | -5,86 | ||||
| 2026-02-17 | 13F | Russell Investments Group, Ltd. | 10 | 0 | ||||||
| 2026-02-09 | 13F | Key FInancial Inc | 335 | 0,00 | 12 | 0,00 | ||||
| 2026-01-27 | 13F | Purus Wealth Management, LLC | 123.414 | 4,42 | 4.548 | 7,52 | ||||
| 2026-04-08 | 13F | Wealth Enhancement Advisory Services, Llc | 18.230 | -8,43 | 676 | -12,34 | ||||
| 2025-11-12 | 13F | Angeles Wealth Management, Llc | 0 | -100,00 | 0 | |||||
| 2026-01-20 | 13F | Stratos Wealth Partners, LTD. | 7.628 | 2,93 | 281 | 6,04 | ||||
| 2026-02-13 | 13F | Wells Fargo & Company/mn | 294.519 | 99,45 | 10.853 | 105,39 | ||||
| 2025-11-14 | 13F | Guardian Wealth Advisors, Llc / Nc | 0 | -100,00 | 0 | |||||
| 2026-04-07 | 13F | U.S. Capital Wealth Advisors, LLC | 0 | -100,00 | 0 | |||||
| 2026-02-13 | 13F | Mml Investors Services, Llc | 11.548 | -13,04 | 426 | -10,53 | ||||
| 2026-02-17 | 13F | Cetera Investment Advisers | 43.271 | 12,22 | 1.595 | 15,51 | ||||
| 2026-02-17 | 13F | Susquehanna International Group, Llp | Call | 28.300 | 58,99 | 1.043 | 63,58 | |||
| 2026-04-08 | 13F | WealthCare Investment Partners, LLC | 23.840 | 1,04 | 882 | -0,45 | ||||
| 2026-02-02 | 13F | CX Institutional | 0 | -100,00 | 0 | |||||
| 2026-01-28 | 13F | Mystic Asset Management, Inc. | 13.765 | -3,84 | 507 | -0,98 | ||||
| 2026-01-30 | 13F | Wealthfront Advisers Llc | 75.673 | 7,26 | 2.789 | 10,42 | ||||
| 2026-02-17 | 13F | Susquehanna International Group, Llp | 33.895 | 3,60 | 1.249 | 6,75 | ||||
| 2026-01-22 | 13F | Spirepoint Private Client, Llc | 25.814 | 2,61 | 951 | 5,67 | ||||
| 2026-02-11 | 13F | Parallel Advisors, LLC | 388 | -49,54 | 14 | -48,15 | ||||
| 2026-02-12 | 13F | Gerber Kawasaki Wealth & Investment Management | 169.107 | -0,63 | 6.232 | 2,32 | ||||
| 2026-02-26 | 13F | TD Capital Management LLC | 3.265 | 4,11 | 120 | 7,14 | ||||
| 2025-11-14 | 13F | Citadel Advisors Llc | 0 | -100,00 | 0 | -100,00 | ||||
| 2026-02-17 | 13F | Advisor Group Holdings, Inc. | 669.793 | 68,31 | 24.682 | 73,65 | ||||
| 2026-02-17 | 13F | SageView Advisory Group, LLC | 470 | 17 | ||||||
| 2026-02-17 | 13F | Fmr Llc | 2.469 | 38,09 | 91 | 42,86 | ||||
| 2026-02-12 | 13F | Brinker Capital Investments, LLC | 6.949 | 256 | ||||||
| 2026-04-13 | 13F | Gill Capital Partners, Llc | 7.643 | 0,00 | 277 | -1,78 | ||||
| 2026-01-29 | 13F | UBS Group AG | 106.391 | 116,26 | 3.921 | 122,73 | ||||
| 2025-11-14 | 13F | Gts Securities Llc | 0 | -100,00 | 0 | -100,00 | ||||
| 2026-02-13 | 13F | Arkadios Wealth Advisors | 19.050 | 0,00 | 702 | 2,94 | ||||
| 2026-02-17 | 13F | Edmond De Rothschild Holding S.a. | 250 | 0,00 | 9 | 12,50 | ||||
| 2025-11-07 | 13F | Rothschild Investment Llc | 0 | -100,00 | 0 | |||||
| 2026-02-14 | 13F | Pointe Capital Management LLC | 9.864 | -5,34 | 363 | -2,42 | ||||
| 2026-02-13 | 13F | Morgan Stanley | 281.512 | 11,62 | 10.374 | 14,92 | ||||
| 2026-02-12 | 13F | Principal Securities, Inc. | 0 | -100,00 | 0 | |||||
| 2026-01-22 | 13F | Pinnacle Bancorp, Inc. | 200 | 0,00 | 7 | 0,00 | ||||
| 2026-01-15 | 13F | Brookstone Capital Management | 33.148 | -1,15 | 1.222 | 1,75 | ||||
| 2026-02-04 | 13F | Fourth Dimension Wealth, LLC | 500 | 0,00 | 18 | 5,88 | ||||
| 2026-02-17 | 13F | IHT Wealth Management, LLC | 5.815 | -62,01 | 214 | -60,88 | ||||
| 2026-04-14 | 13F | Prospera Financial Services Inc | 17.379 | 630 | ||||||
| 2026-02-18 | 13F | GWM Advisors LLC | 31.509 | 35,65 | 1.345 | 61,85 | ||||
| 2026-01-12 | 13F | CVA Family Office, LLC | 20 | 0,00 | 1 | |||||
| 2026-01-26 | 13F | Mountain Hill Investment Partners Corp. | 52 | 0,00 | 2 | 0,00 | ||||
| 2026-02-02 | 13F | Fullerton Advisors, LLC | 7.345 | 271 | ||||||
| 2026-02-13 | 13F | Baird Financial Group, Inc. | 18.077 | 0,70 | 666 | 3,74 | ||||
| 2026-01-21 | 13F | Capital Investment Advisory Services, LLC | 9.427 | 1,08 | 347 | 4,20 | ||||
| 2026-02-17 | 13F | Wiley Bros.-aintree Capital, Llc | 13.315 | -0,71 | 491 | 2,30 | ||||
| 2026-04-06 | 13F | GAMMA Investing LLC | 401 | 0,00 | 15 | 0,00 | ||||
| 2026-02-06 | 13F | New Millennium Group LLC | 20 | 1 | ||||||
| 2025-11-06 | 13F | Ameritas Advisory Services, LLC | 0 | -100,00 | 0 | -100,00 | ||||
| 2026-01-30 | 13F | Bogart Wealth, LLC | 1.349 | 50 | ||||||
| 2026-02-13 | 13F | Colony Group, LLC | 20.965 | -7,85 | 773 | -5,16 | ||||
| 2026-03-13 | 13F/A | Pensionmark Financial Group, Llc | 6.256 | 231 | ||||||
| 2026-02-04 | 13F | LRI Investments, LLC | 562.679 | 0,00 | 563 | 0,00 | ||||
| 2026-04-13 | 13F | Massmutual Trust Co Fsb/adv | 400 | 0,00 | 14 | 0,00 | ||||
| 2026-02-13 | 13F | Greenline Wealth Management LLC | 72 | 3 | ||||||
| 2026-02-05 | 13F | Allworth Financial LP | 850 | 183,33 | 31 | 210,00 | ||||
| 2026-02-09 | 13F | Hartland & Co., LLC | 3 | 0,00 | 0 | |||||
| 2026-02-17 | 13F | Cresset Asset Management, LLC | 12.829 | -2,37 | 473 | 0,43 | ||||
| 2026-01-14 | 13F | Jfs Wealth Advisors, Llc | 3.787 | 0,00 | 140 | 2,96 | ||||
| 2026-02-12 | 13F | Jane Street Group, Llc | Call | 7.200 | 26,32 | 265 | 29,90 | |||
| 2026-01-22 | 13F | Systelligence, LLC | 487.470 | 17.963 | ||||||
| 2026-01-20 | 13F | Investment Research & Advisory Group, Inc. | 1.331 | 0,23 | 49 | 4,26 | ||||
| 2026-02-17 | 13F | Equitable Holdings, Inc. | 34.135 | -1,09 | 1.258 | 1,78 | ||||
| 2026-04-13 | 13F | Salem Investment Counselors Inc | 129 | 5 | ||||||
| 2026-04-10 | 13F | Novem Group | 62.950 | 0,00 | 2.279 | -1,72 | ||||
| 2026-02-17 | 13F | Royal Bank Of Canada | 77.178 | -2,69 | 2.844 | 0,18 | ||||
| 2026-04-13 | 13F | IFP Advisors, Inc | 216 | 323,53 | 8 | 600,00 | ||||
| 2026-01-28 | 13F | Geneos Wealth Management Inc. | 1.300 | 0,00 | 48 | 2,17 | ||||
| 2026-01-26 | 13F | JNBA Financial Advisors | 16 | 1 | ||||||
| 2026-01-30 | 13F | Us Bancorp \de\ | 710 | 1,43 | 26 | 4,00 | ||||
| 2026-02-11 | 13F | Goodman Advisory Group, LLC | 738 | -12,04 | 27 | -10,00 | ||||
| 2026-02-10 | 13F | Envestnet Asset Management Inc | 13.560 | 7,50 | 500 | 10,64 | ||||
| 2025-11-12 | 13F | CIBC Bancorp USA Inc. | 9.032 | 323 | ||||||
| 2026-04-06 | 13F | WASHINGTON TRUST Co | 0 | -100,00 | 0 | |||||
| 2026-02-20 | 13F | Sunbelt Securities, Inc. | 894 | 0,11 | 33 | 3,23 | ||||
| 2026-02-05 | 13F | Cambridge Investment Research Advisors, Inc. | 16.754 | -0,17 | 1 | |||||
| 2025-10-16 | 13F | Columbus Macro, LLC | 0 | -100,00 | 0 | |||||
| 2026-02-05 | 13F | Proactive Wealth Strategies LLC | 14.019 | 0,18 | 517 | 3,20 | ||||
| 2026-02-17 | 13F | Qube Research & Technologies Ltd | 154 | 0,00 | 6 | 0,00 | ||||
| 2026-02-06 | 13F | EverSource Wealth Advisors, LLC | 59 | -63,35 | 2 | -60,00 |