Grundlæggende statistik
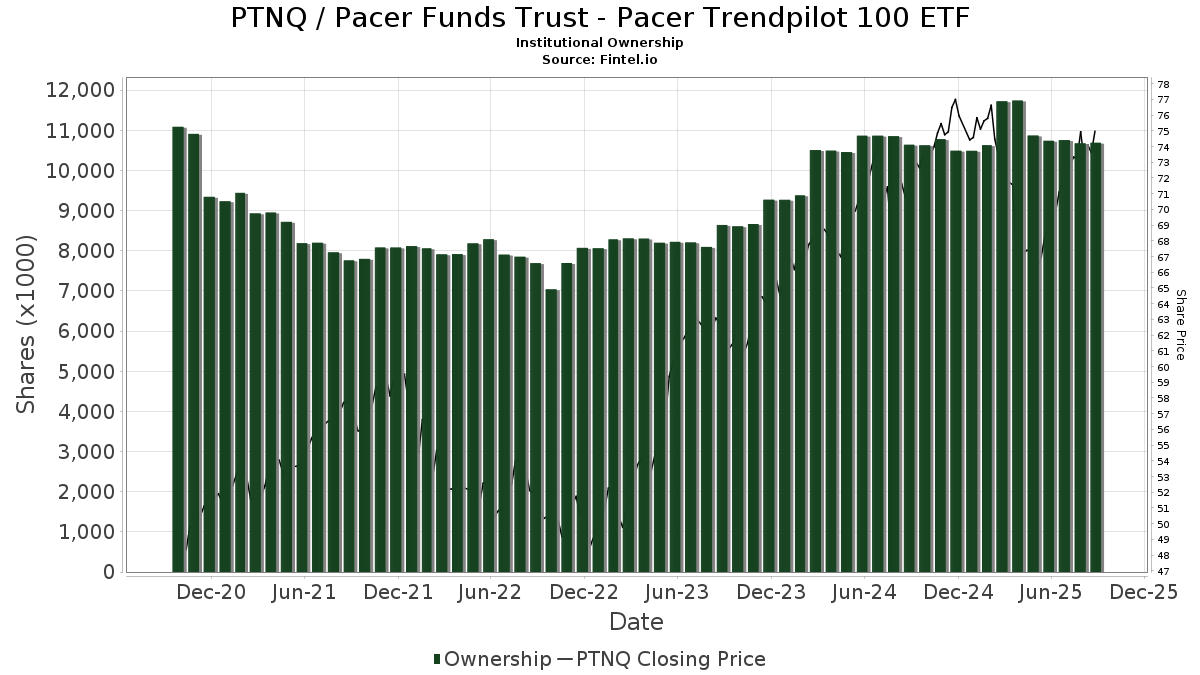
| Institutionelle ejere | 144 total, 144 long only, 0 short only, 0 long/short - change of 2,86% MRQ |
| Gennemsnitlig porteføljeallokering | 0.3730 % - change of 5,45% MRQ |
| Institutionelle aktier (lange) | 10.690.937 (ex 13D/G) - change of -0,05MM shares -0,45% MRQ |
| Institutionel værdi (lang) | $ 709.241 USD ($1000) |
Institutionelt ejerskab og aktionærer
Pacer Funds Trust - Pacer Trendpilot 100 ETF (US:PTNQ) har 144 institutionelle ejere og aktionærer, der har indsendt 13D/G- eller 13F-formularer til Securities Exchange Commission (SEC). Disse institutioner har i alt 10,690,937 aktier. Største aktionærer omfatter LPL Financial LLC, Morgan Stanley, Bank Of America Corp /de/, Raymond James Financial Inc, Wells Fargo & Company/mn, Cetera Investment Advisers, Cambridge Investment Research Advisors, Inc., Avantax Advisory Services, Inc., UBS Group AG, and ODonnell Financial Services, LLC .
Pacer Funds Trust - Pacer Trendpilot 100 ETF (NasdaqGM:PTNQ) institutionel ejerskabsstruktur viser aktuelle positioner i virksomheden efter institutioner og fonde, samt seneste ændringer i positionsstørrelse. Større aktionærer kan omfatte individuelle investorer, investeringsforeninger, hedgefonde eller institutioner. Skema 13D angiver, at investoren besidder (eller besidder) mere end 5 % af virksomheden og har til hensigt (eller har til hensigt at) aktivt at forfølge en ændring i forretningsstrategi. Skema 13G indikerer en passiv investering på over 5%.
The share price as of September 12, 2025 is 75,76 / share. Previously, on September 16, 2024, the share price was 71,83 / share. This represents an increase of 5,47% over that period.
Fondens stemningsscore
Fund Sentiment Score (fka Ownership Accumulation Score) finder de aktier, der bliver mest købt af fonde. Det er resultatet af en sofistikeret, multi-faktor kvantitativ model, der identificerer virksomheder med de højeste niveauer af institutionel akkumulering. Scoringsmodellen bruger en kombination af den samlede stigning i oplyste ejere, ændringerne i porteføljeallokeringer i disse ejere og andre målinger. Tallet går fra 0 til 100, hvor højere tal indikerer et højere niveau af akkumulering for sine jævnaldrende, og 50 er gennemsnittet.
Opdateringsfrekvens: Dagligt
Se Ownership Explorer, som giver en liste over højest rangerende virksomheder.
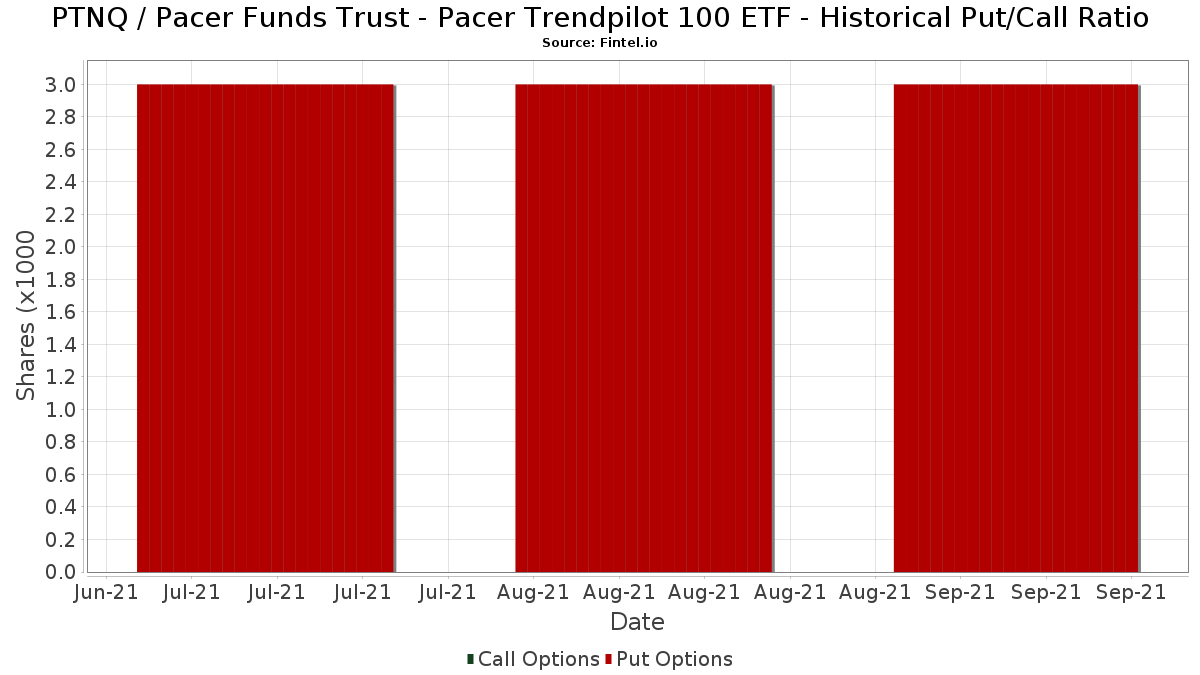
Institutionel Put/Call-forhold
Ud over at indberette standardaktie- og gældsudstedelser skal institutter med mere end 100 mill. aktiver under forvaltning også oplyse deres put- og call-optionsbeholdninger. Da salgsoptioner generelt indikerer negativ stemning, og købsoptioner indikerer positiv stemning, kan vi få en fornemmelse af den overordnede institutionelle stemning ved at plotte forholdet mellem put og kald. Diagrammet til højre viser det historiske put/call-forhold for dette instrument.
Brug af Put/Call Ratio som en indikator for investorernes stemning overvinder en af de vigtigste mangler ved at bruge totalt institutionelt ejerskab, som er, at en betydelig mængde af aktiver under forvaltning investeres passivt for at spore indekser. Passivt forvaltede fonde køber typisk ikke optioner, så indikatoren for put/call-forholdet følger mere nøje følelsen af aktivt forvaltede fonde.
13F og NPORT arkivering
Detaljer om 13F-arkivering er gratis. Detaljer om NP-ansøgninger kræver et premium-medlemskab. Grønne rækker angiver nye positioner. Røde rækker angiver lukkede positioner. Klik på linket ikon for at se den fulde transaktionshistorik.
Opgrader
for at låse premium-data op og eksportere til Excel ![]() .
.
| Fil dato | Kilde | Investor | Type | Gennemsnitlig pris (Øst) |
Aktier | Δ Aktier (%) |
Rapporteret Værdi ($1000) |
Δ Værdi (%) |
Port Alloc (%) |
|
|---|---|---|---|---|---|---|---|---|---|---|
| 2025-07-24 | 13F | Us Bancorp \de\ | 0 | -100,00 | 0 | |||||
| 2025-08-11 | 13F | Citigroup Inc | 492 | 0,00 | 35 | 2,94 | ||||
| 2025-08-06 | 13F | Mascagni Wealth Management, Inc. | 4.550 | 16,94 | 325 | 17,39 | ||||
| 2025-07-29 | 13F | Stratos Wealth Partners, LTD. | 19.743 | 0,84 | 1.409 | 1,37 | ||||
| 2025-08-14 | 13F | Bank Of America Corp /de/ | 1.098.718 | -6,05 | 78.415 | -5,58 | ||||
| 2025-08-14 | 13F | IHT Wealth Management, LLC | 2.956 | -11,12 | 211 | -11,02 | ||||
| 2025-07-14 | 13F | Golden State Equity Partners | 8.308 | 593 | ||||||
| 2025-04-21 | 13F | PSI Advisors, LLC | 0 | -100,00 | 0 | -100,00 | ||||
| 2025-04-29 | 13F | Brookstone Capital Management | 0 | -100,00 | 0 | |||||
| 2025-07-17 | 13F | SWS Partners | 3.484 | 0,00 | 249 | 0,40 | ||||
| 2025-07-25 | 13F | Midwest Capital Advisors, LLC | 858 | 0,00 | 61 | 1,67 | ||||
| 2025-07-28 | 13F | Harbour Investments, Inc. | 13.933 | 3,16 | 994 | 3,65 | ||||
| 2025-08-12 | 13F | Change Path, LLC | 18.391 | -17,61 | 1.313 | -17,22 | ||||
| 2025-08-15 | 13F | Kestra Advisory Services, LLC | 54.199 | 11,41 | 3.868 | 11,99 | ||||
| 2025-08-14 | 13F/A | Rockefeller Capital Management L.P. | 90.295 | 0,63 | 6.444 | 1,15 | ||||
| 2025-04-09 | 13F | Milestone Asset Management, Llc | 0 | -100,00 | 0 | |||||
| 2025-06-30 | NP | TRND - Pacer Trendpilot Fund of Funds ETF | 161.335 | 12,61 | 10.872 | 0,83 | ||||
| 2025-07-21 | 13F | New Century Financial Group, LLC | 3.452 | 246 | ||||||
| 2025-08-07 | 13F | PFG Advisors | 18.841 | -2,13 | 1.345 | -1,68 | ||||
| 2025-08-14 | 13F | Comerica Bank | 10.434 | 7,19 | 745 | 7,67 | ||||
| 2025-08-08 | 13F | Avantax Advisory Services, Inc. | 270.924 | 36,17 | 19.336 | 36,86 | ||||
| 2025-07-25 | 13F | Sequoia Financial Advisors, LLC | 5.135 | -0,58 | 366 | 0,00 | ||||
| 2025-08-11 | 13F | Advisor Resource Council | 17.368 | -42,20 | 1.240 | -41,91 | ||||
| 2025-05-16 | 13F/A | Kestra Investment Management, LLC | 0 | -100,00 | 0 | |||||
| 2025-08-14 | 13F | Hilltop Holdings Inc. | 6.828 | 1,46 | 487 | 2,10 | ||||
| 2025-07-16 | 13F | Register Financial Advisors LLC | 871 | 0,00 | 62 | 1,64 | ||||
| 2025-08-08 | 13F | Thoroughbred Financial Services, Llc | 5.046 | -89,89 | 0 | -100,00 | ||||
| 2025-08-12 | 13F | Jacobi Capital Management LLC | 3.040 | 0,00 | 217 | 0,47 | ||||
| 2025-08-14 | 13F | Royal Bank Of Canada | 187.798 | -4,00 | 13.403 | -3,51 | ||||
| 2025-08-12 | 13F | Marshall & Sterling Wealth Advisors Inc. | 0 | -100,00 | 0 | -100,00 | ||||
| 2025-08-11 | 13F | Oder Investment Management, LLC | 11.873 | 1,26 | 847 | 1,80 | ||||
| 2025-07-31 | 13F | Oppenheimer & Co Inc | 14.065 | -10,71 | 1.004 | -10,29 | ||||
| 2025-08-14 | 13F | UBS Group AG | 257.071 | -0,94 | 18.347 | -0,43 | ||||
| 2025-08-14 | 13F | Wells Fargo & Company/mn | 633.628 | -4,39 | 45.222 | -3,91 | ||||
| 2025-04-28 | 13F | Strategic Financial Concepts, LLC | 0 | -100,00 | 0 | -100,00 | ||||
| 2025-07-29 | 13F | Private Trust Co Na | 6.075 | 0,00 | 434 | 0,46 | ||||
| 2025-08-28 | 13F | Stark Wealth Management LLC | 4.350 | 310 | ||||||
| 2025-07-22 | 13F | Legacy Trust | 6.683 | 0,00 | 477 | 0,42 | ||||
| 2025-07-15 | 13F | Burns Matteson Capital Management, LLC | 0 | -100,00 | 0 | |||||
| 2025-08-01 | 13F | Schmidt P J Investment Management Inc | 0 | -100,00 | 0 | |||||
| 2025-07-15 | 13F | EWG Elevate Inc. | 9.933 | 4,15 | 709 | 4,58 | ||||
| 2025-08-14 | 13F | Camarda Financial Advisors, LLC | 7.701 | 14,58 | 550 | 15,09 | ||||
| 2025-07-22 | 13F | Merit Financial Group, LLC | 0 | -100,00 | 0 | |||||
| 2025-08-13 | 13F | Baird Financial Group, Inc. | 3.358 | -2,10 | 240 | -1,65 | ||||
| 2025-08-12 | 13F | Proequities, Inc. | 0 | 0 | ||||||
| 2025-05-15 | 13F/A | Orion Portfolio Solutions, LLC | 11.193 | 4,19 | 795 | -0,13 | ||||
| 2025-07-25 | 13F | Cwm, Llc | 23.568 | 0,00 | 2 | 0,00 | ||||
| 2025-08-12 | 13F | CIBC Private Wealth Group, LLC | 777 | -22,30 | 55 | -17,91 | ||||
| 2025-04-23 | 13F | International Assets Investment Management, Llc | 0 | -100,00 | 0 | |||||
| 2025-08-15 | 13F | First Heartland Consultants, Inc. | 0 | -100,00 | 0 | |||||
| 2025-08-13 | 13F | Trustmark National Bank Trust Department | 7.089 | 0,00 | 506 | 0,40 | ||||
| 2025-08-14 | 13F | Jane Street Group, Llc | 9.421 | 672 | ||||||
| 2025-08-14 | 13F | Arete Wealth Advisors, LLC | 11.833 | 11,26 | 1 | |||||
| 2025-09-04 | 13F/A | Advisor Group Holdings, Inc. | 175.193 | -6,99 | 12.504 | -6,51 | ||||
| 2025-08-04 | 13F | Arkadios Wealth Advisors | 12.834 | 0,63 | 916 | 1,10 | ||||
| 2025-08-14 | 13F | Napa Wealth Management | 26.017 | 1.857 | ||||||
| 2025-04-15 | 13F | Noble Wealth Management PBC | 1.400 | 21,74 | 99 | 16,47 | ||||
| 2025-07-10 | 13F | Financial Management Network Inc | 38.442 | -5,76 | 2.766 | 0,95 | ||||
| 2025-07-17 | 13F | Janney Montgomery Scott LLC | 27.656 | 6,91 | 2 | 0,00 | ||||
| 2025-08-12 | 13F | Insigneo Advisory Services, Llc | 4.519 | -8,09 | 323 | -7,74 | ||||
| 2025-08-12 | 13F | Calton & Associates, Inc. | 9.603 | -79,85 | 685 | -79,76 | ||||
| 2025-05-12 | 13F | Independent Advisor Alliance | 0 | -100,00 | 0 | |||||
| 2025-08-13 | 13F | Proactive Wealth Strategies LLC | 19.802 | -6,69 | 1 | 0,00 | ||||
| 2025-04-17 | 13F | FNY Investment Advisers, LLC | 0 | -100,00 | 0 | |||||
| 2025-07-14 | 13F | GAMMA Investing LLC | 80 | 0,00 | 6 | 0,00 | ||||
| 2025-08-14 | 13F | Susquehanna International Group, Llp | 20.198 | 1.442 | ||||||
| 2025-08-14 | 13F | Mml Investors Services, Llc | 44.892 | -21,13 | 3 | -25,00 | ||||
| 2025-08-11 | 13F | Anfield Capital Management, LLC | 130 | 0,00 | 9 | 0,00 | ||||
| 2025-08-14 | 13F | Mariner, LLC | 7.691 | 2,27 | 549 | 2,62 | ||||
| 2025-08-14 | 13F | Old Mission Capital Llc | 4.338 | 310 | ||||||
| 2025-07-18 | 13F | Truist Financial Corp | 50.074 | -10,81 | 3.574 | -10,36 | ||||
| 2025-08-05 | 13F | GPS Wealth Strategies Group, LLC | 8.580 | 0,00 | 612 | 0,49 | ||||
| 2025-08-14 | 13F | Wiley Bros.-aintree Capital, Llc | 10.717 | -11,20 | 765 | -10,75 | ||||
| 2025-08-14 | 13F | CoreCap Advisors, LLC | 746 | 4,04 | 53 | 6,00 | ||||
| 2025-07-17 | 13F | XML Financial, LLC | 10.724 | -15,57 | 765 | -15,09 | ||||
| 2025-07-21 | 13F | Ameriflex Group, Inc. | 2.588 | -33,64 | 183 | -34,06 | ||||
| 2025-08-05 | 13F | Sigma Planning Corp | 14.590 | -0,27 | 1.041 | 0,29 | ||||
| 2025-08-18 | 13F | Geneos Wealth Management Inc. | 183.469 | 42,46 | 13.094 | 43,18 | ||||
| 2025-07-23 | 13F | Clear Creek Financial Management, LLC | 12.169 | -60,23 | 869 | -60,04 | ||||
| 2025-07-08 | 13F | Nbc Securities, Inc. | 2.165 | 0,00 | 0 | |||||
| 2025-07-30 | 13F | Gimbal Financial | 38.461 | -27,04 | 2.745 | -26,69 | ||||
| 2025-08-14 | 13F | Vienna Asset Management LLC | 68.465 | 28,86 | 4.886 | 29,53 | ||||
| 2025-07-29 | 13F | Stratos Wealth Advisors, LLC | 0 | -100,00 | 0 | |||||
| 2025-08-13 | 13F | MONECO Advisors, LLC | 64.772 | -3,86 | 4.623 | -3,39 | ||||
| 2025-07-24 | 13F | IFP Advisors, Inc | 5.818 | 27,90 | 415 | 28,48 | ||||
| 2025-04-11 | 13F | IAM Advisory, LLC | 0 | -100,00 | 0 | -100,00 | ||||
| 2025-05-13 | 13F | Aptus Capital Advisors, LLC | 0 | -100,00 | 0 | |||||
| 2025-08-08 | 13F | Cetera Investment Advisers | 427.015 | -14,42 | 30.476 | -13,98 | ||||
| 2025-07-22 | 13F | Confluence Wealth Services, Inc. | 8.124 | -0,87 | 580 | 5,27 | ||||
| 2025-07-14 | 13F | MY Wealth Management Inc. | 131.087 | 9.356 | ||||||
| 2025-08-13 | 13F | JBR Co Financial Management Inc | 21.571 | -19,06 | 1.540 | -18,66 | ||||
| 2025-08-14 | 13F | Raymond James Financial Inc | 804.067 | -1,67 | 57.386 | -1,17 | ||||
| 2025-05-15 | 13F | StoneX Group Inc. | 0 | -100,00 | 0 | -100,00 | ||||
| 2025-08-06 | 13F | AE Wealth Management LLC | 953 | 0,00 | 68 | 1,49 | ||||
| 2025-08-13 | 13F | EverSource Wealth Advisors, LLC | 1.672 | 0,00 | 119 | 0,85 | ||||
| 2025-07-29 | 13F | ODonnell Financial Services, LLC | 219.653 | 2,27 | 15.677 | 2,79 | ||||
| 2025-08-12 | 13F | Global Retirement Partners, LLC | 47 | 3 | ||||||
| 2025-08-14 | 13F | EP Wealth Advisors, Inc. | 1.550 | 0,00 | 111 | 0,00 | ||||
| 2025-07-24 | 13F | Cyndeo Wealth Partners, LLC | 3.559 | 254 | ||||||
| 2025-07-31 | 13F | Cambridge Investment Research Advisors, Inc. | 422.624 | -15,71 | 30 | -14,29 | ||||
| 2025-08-14 | 13F | Stifel Financial Corp | 82.344 | 7,87 | 5.877 | 8,41 | ||||
| 2025-07-15 | 13F | Clarus Group, Inc. | 3.818 | 0,00 | 272 | 0,37 | ||||
| 2025-08-12 | 13F | Pacer Advisors, Inc. | 156.854 | 3,22 | 11.195 | 3,74 | ||||
| 2025-07-25 | 13F | Atria Wealth Solutions, Inc. | 107.640 | -16,99 | 7.682 | -16,57 | ||||
| 2025-07-28 | 13F | Axxcess Wealth Management, Llc | 7.555 | -28,83 | 539 | -28,42 | ||||
| 2025-07-21 | 13F | Financial Services Advisory Inc | 22.791 | 0,92 | 1.627 | 1,43 | ||||
| 2025-08-12 | 13F | SRS Capital Advisors, Inc. | 2.754 | 14,80 | 197 | 15,29 | ||||
| 2025-08-11 | 13F | Empirical Finance, LLC | 47.352 | 0,00 | 3.380 | 0,51 | ||||
| 2025-04-23 | 13F | PBMares Wealth Management LLC | 0 | -100,00 | 0 | |||||
| 2025-07-18 | 13F | Trust Co Of Vermont | 925 | 66 | ||||||
| 2025-08-01 | 13F | Brookwood Investment Group LLC | 0 | -100,00 | 0 | |||||
| 2025-08-27 | 13F/A | Brinker Capital Investments, LLC | 12.906 | 15,30 | 921 | 15,99 | ||||
| 2025-08-11 | 13F | HighTower Advisors, LLC | 76.265 | 5.443 | ||||||
| 2025-08-12 | 13F | Jpmorgan Chase & Co | 378 | -55,05 | 27 | -54,24 | ||||
| 2025-08-14 | 13F | Elevatus Welath Management | 0 | -100,00 | 0 | |||||
| 2025-07-23 | 13F | Tyche Wealth Partners LLC | 3.256 | -19,45 | 232 | -18,88 | ||||
| 2025-08-11 | 13F | Private Advisor Group, LLC | 55.026 | 2,94 | 3.927 | 3,48 | ||||
| 2025-08-06 | 13F | Prospera Financial Services Inc | 55.913 | -20,86 | 3.996 | -20,43 | ||||
| 2025-08-13 | 13F | Quadrant Capital Group Llc | 0 | -100,00 | 0 | |||||
| 2025-08-05 | 13F | Sensible Money, LLC | 3.000 | 0,00 | 214 | 0,47 | ||||
| 2025-08-07 | 13F | Kestra Private Wealth Services, Llc | 17.402 | -9,52 | 1.242 | -9,08 | ||||
| 2025-07-07 | 13F | Nova Wealth Management, Inc. | 5.133 | -85,51 | 366 | -85,45 | ||||
| 2025-07-22 | 13F | MBL Wealth, LLC | 47.385 | 3.382 | ||||||
| 2025-08-11 | 13F | Western Wealth Management, LLC | 37.729 | -14,33 | 2.693 | -13,91 | ||||
| 2025-08-12 | 13F | Financial Advocates Investment Management | 3.991 | -2,06 | 285 | -1,73 | ||||
| 2025-08-13 | 13F | Northwestern Mutual Wealth Management Co | 811 | 58 | ||||||
| 2025-08-05 | 13F | Bank Of Montreal /can/ | 600 | 43 | ||||||
| 2025-07-29 | 13F | Stephens Inc /ar/ | 79.800 | -5,70 | 5.695 | -5,23 | ||||
| 2025-08-04 | 13F | Assetmark, Inc | 2.522 | 0,00 | 180 | 0,00 | ||||
| 2025-08-06 | 13F | Commonwealth Equity Services, Llc | 179.441 | -9,17 | 13 | -14,29 | ||||
| 2025-05-14 | 13F | Brown Brothers Harriman & Co | 0 | -100,00 | 0 | |||||
| 2025-08-13 | 13F | Level Four Advisory Services, Llc | 122.128 | 0,87 | 8.716 | 1,38 | ||||
| 2025-07-10 | 13F | Wealth Enhancement Advisory Services, Llc | 13.845 | -71,29 | 996 | -70,91 | ||||
| 2025-08-11 | 13F | CFS Investment Advisory Services, LLC | 7.450 | 1 | ||||||
| 2025-07-07 | 13F | Capital Asset Advisory Services LLC | 7.455 | -29,77 | 527 | -30,70 | ||||
| 2025-08-13 | 13F | Continuum Advisory, LLC | 0 | -100,00 | 0 | |||||
| 2025-08-14 | 13F | Ameriprise Financial Inc | 22.338 | -6,98 | 1.594 | -6,57 | ||||
| 2025-08-15 | 13F | Equitable Holdings, Inc. | 53.917 | -32,58 | 3.848 | -32,23 | ||||
| 2025-08-12 | 13F | LPL Financial LLC | 1.516.605 | 6,61 | 108.240 | 7,15 | ||||
| 2025-08-12 | 13F | J.w. Cole Advisors, Inc. | 18.676 | 0,85 | 1.333 | 1,29 | ||||
| 2025-07-17 | 13F | Tempus Wealth Planning, LLC | 3.166 | -49,63 | 226 | -49,55 | ||||
| 2025-05-06 | 13F | Venturi Wealth Management, LLC | 0 | -100,00 | 0 | |||||
| 2025-08-19 | 13F | National Asset Management, Inc. | 0 | -100,00 | 0 | |||||
| 2025-07-25 | 13F | Lion Street Advisors, LLC | 5.080 | 0,00 | 363 | 0,56 | ||||
| 2025-07-17 | 13F | Beacon Capital Management, LLC | 595 | 0,00 | 42 | 0,00 | ||||
| 2025-08-12 | 13F | Steward Partners Investment Advisory, Llc | 144.276 | 7,02 | 10.297 | 7,56 | ||||
| 2025-08-07 | 13F | Parkside Financial Bank & Trust | 2.465 | 0,00 | 176 | 0,00 | ||||
| 2025-08-14 | 13F | Citadel Advisors Llc | 9.079 | 17,51 | 648 | 18,07 | ||||
| 2025-07-22 | 13F | Unique Wealth, Llc | 3.041 | 0,00 | 217 | 0,93 | ||||
| 2025-08-19 | 13F | Asset Dedication, LLC | 3.000 | 0,00 | 214 | 0,47 | ||||
| 2025-07-02 | 13F | HBW Advisory Services LLC | 3.317 | 237 | ||||||
| 2025-07-11 | 13F | SILVER OAK SECURITIES, Inc | 6.858 | -1,15 | 489 | -0,61 | ||||
| 2025-08-12 | 13F | PKS Advisory Services, LLC | 12.162 | 3,07 | 868 | 3,70 | ||||
| 2025-07-14 | 13F | Southland Equity Partners LLC | 12.368 | 0,24 | 883 | 0,68 | ||||
| 2025-08-14 | 13F | Aft, Forsyth & Sober, LLC | 57.225 | 0,88 | 4.084 | 1,39 | ||||
| 2025-08-01 | 13F | Gwn Securities Inc. | 0 | -100,00 | 0 | |||||
| 2025-07-21 | 13F | Ameritas Advisory Services, LLC | 40.088 | -13,49 | 2.861 | -13,22 | ||||
| 2025-08-01 | 13F | Envestnet Asset Management Inc | 79.069 | -16,24 | 5.643 | -15,81 | ||||
| 2025-08-14 | 13F | Family Office Research LLC | 7.870 | -3,19 | 562 | -2,77 | ||||
| 2025-08-15 | 13F | Morgan Stanley | 1.189.468 | -4,08 | 84.892 | -3,60 | ||||
| 2025-07-22 | 13F | DAVENPORT & Co LLC | 8.344 | 2,14 | 596 | 2,59 | ||||
| 2025-08-08 | 13F | Foundations Investment Advisors, LLC | 4.893 | -61,50 | 349 | -61,31 | ||||
| 2025-08-14 | 13F | GWM Advisors LLC | 149.890 | 76,82 | 10.698 | 77,72 | ||||
| 2025-07-31 | 13F | Stegent Equity Advisors, Inc. | 3.375 | -14,86 | 241 | -14,59 | ||||
| 2025-08-14 | 13F | Kovitz Investment Group Partners, LLC | 3.927 | 0,00 | 280 | 0,72 | ||||
| 2025-08-04 | 13F | Creative Financial Designs Inc /adv | 180.961 | 11,17 | 12.915 | 11,74 | ||||
| 2025-08-04 | 13F | Integrity Alliance, Llc. | 11.062 | -18,47 | 789 | -18,07 | ||||
| 2025-08-14 | 13F | Fmr Llc | 2.970 | -11,34 | 212 | -10,97 | ||||
| 2025-08-07 | 13F | Allworth Financial LP | 1.526 | 0,00 | 109 | 5,88 | ||||
| 2025-07-25 | 13F | Concurrent Investment Advisors, LLC | 28.551 | -4,89 | 2.038 | -4,41 | ||||
| 2025-07-30 | 13F | Strategic Blueprint, LLC | 6.182 | 27,97 | 441 | 28,57 | ||||
| 2025-07-30 | 13F/A | Old Point Trust & Financial Services N A | 452 | 0,00 | 32 | 0,00 |