Grundlæggende statistik
| Institutionelle ejere | 96 total, 96 long only, 0 short only, 0 long/short - change of 0,00% MRQ |
| Gennemsnitlig porteføljeallokering | 0.1495 % - change of 13,96% MRQ |
| Institutionelle aktier (lange) | 3.082.722 (ex 13D/G) - change of -0,44MM shares -12,61% MRQ |
| Institutionel værdi (lang) | $ 171.953 USD ($1000) |
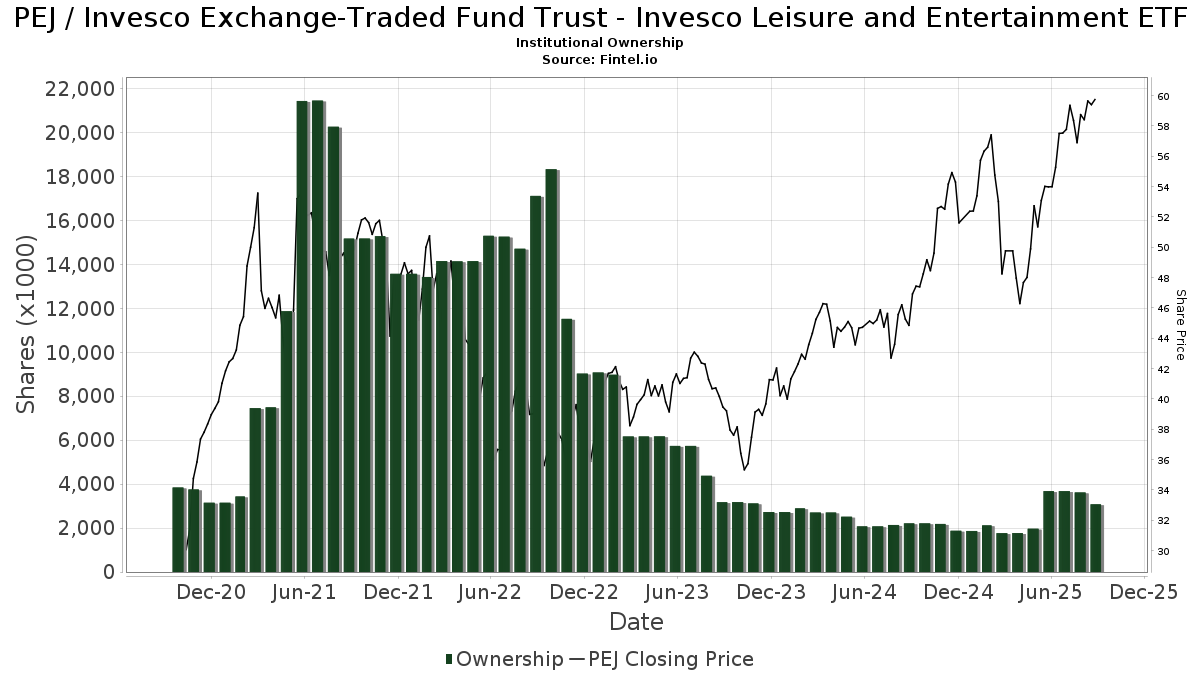
Institutionelt ejerskab og aktionærer
Invesco Exchange-Traded Fund Trust - Invesco Leisure and Entertainment ETF (US:PEJ) har 96 institutionelle ejere og aktionærer, der har indsendt 13D/G- eller 13F-formularer til Securities Exchange Commission (SEC). Disse institutioner har i alt 3,082,722 aktier. Største aktionærer omfatter HighTower Advisors, LLC, Morgan Stanley, Prudential Plc, Bank Of America Corp /de/, Raymond James Financial Inc, Kingsview Wealth Management, LLC, Wells Fargo & Company/mn, MSSS - Monarch Select Subsector Index ETF, LPL Financial LLC, and Goldman Sachs Group Inc .
Invesco Exchange-Traded Fund Trust - Invesco Leisure and Entertainment ETF (ARCA:PEJ) institutionel ejerskabsstruktur viser aktuelle positioner i virksomheden efter institutioner og fonde, samt seneste ændringer i positionsstørrelse. Større aktionærer kan omfatte individuelle investorer, investeringsforeninger, hedgefonde eller institutioner. Skema 13D angiver, at investoren besidder (eller besidder) mere end 5 % af virksomheden og har til hensigt (eller har til hensigt at) aktivt at forfølge en ændring i forretningsstrategi. Skema 13G indikerer en passiv investering på over 5%.
The share price as of September 8, 2025 is 59,88 / share. Previously, on September 9, 2024, the share price was 44,98 / share. This represents an increase of 33,13% over that period.
Fondens stemningsscore
Fund Sentiment Score (fka Ownership Accumulation Score) finder de aktier, der bliver mest købt af fonde. Det er resultatet af en sofistikeret, multi-faktor kvantitativ model, der identificerer virksomheder med de højeste niveauer af institutionel akkumulering. Scoringsmodellen bruger en kombination af den samlede stigning i oplyste ejere, ændringerne i porteføljeallokeringer i disse ejere og andre målinger. Tallet går fra 0 til 100, hvor højere tal indikerer et højere niveau af akkumulering for sine jævnaldrende, og 50 er gennemsnittet.
Opdateringsfrekvens: Dagligt
Se Ownership Explorer, som giver en liste over højest rangerende virksomheder.
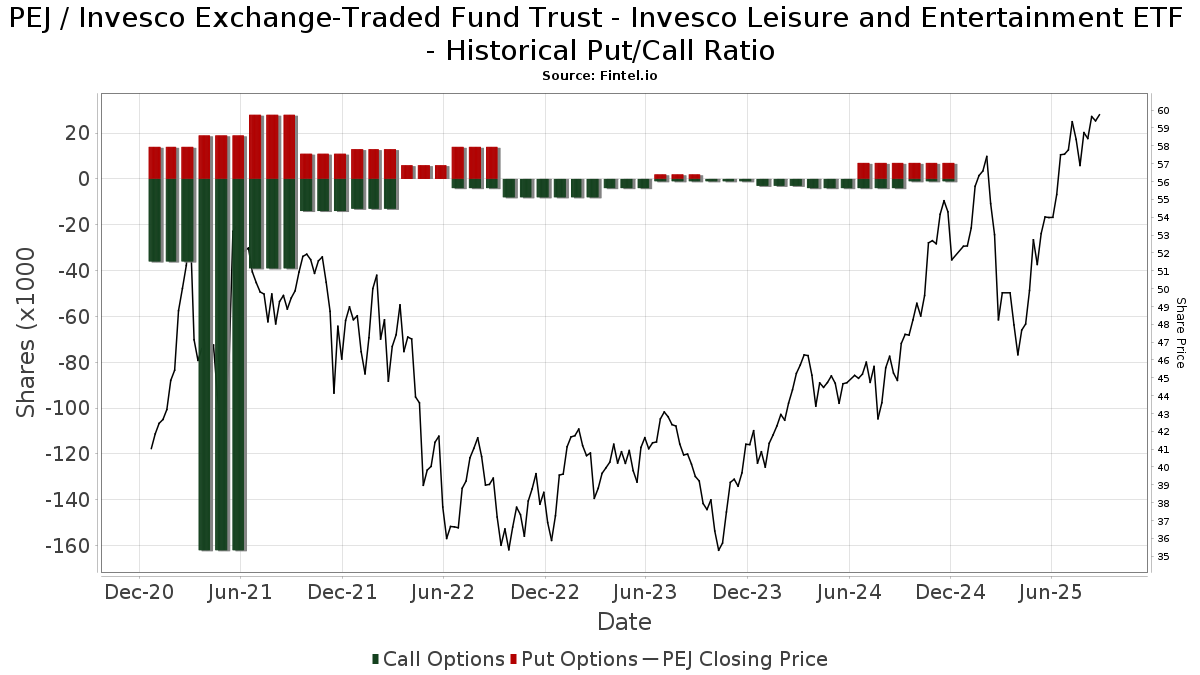
Institutionel Put/Call-forhold
Ud over at indberette standardaktie- og gældsudstedelser skal institutter med mere end 100 mill. aktiver under forvaltning også oplyse deres put- og call-optionsbeholdninger. Da salgsoptioner generelt indikerer negativ stemning, og købsoptioner indikerer positiv stemning, kan vi få en fornemmelse af den overordnede institutionelle stemning ved at plotte forholdet mellem put og kald. Diagrammet til højre viser det historiske put/call-forhold for dette instrument.
Brug af Put/Call Ratio som en indikator for investorernes stemning overvinder en af de vigtigste mangler ved at bruge totalt institutionelt ejerskab, som er, at en betydelig mængde af aktiver under forvaltning investeres passivt for at spore indekser. Passivt forvaltede fonde køber typisk ikke optioner, så indikatoren for put/call-forholdet følger mere nøje følelsen af aktivt forvaltede fonde.
13F og NPORT arkivering
Detaljer om 13F-arkivering er gratis. Detaljer om NP-ansøgninger kræver et premium-medlemskab. Grønne rækker angiver nye positioner. Røde rækker angiver lukkede positioner. Klik på linket ikon for at se den fulde transaktionshistorik.
Opgrader
for at låse premium-data op og eksportere til Excel ![]() .
.
| Fil dato | Kilde | Investor | Type | Gennemsnitlig pris (Øst) |
Aktier | Δ Aktier (%) |
Rapporteret Værdi ($1000) |
Δ Værdi (%) |
Port Alloc (%) |
|
|---|---|---|---|---|---|---|---|---|---|---|
| 2025-08-08 | 13F | Cetera Investment Advisers | 7.622 | -12,09 | 434 | 2,85 | ||||
| 2025-08-14 | 13F | Bnp Paribas Arbitrage, Sa | 30.393 | -66,38 | 1.729 | -60,68 | ||||
| 2025-05-06 | 13F | Venturi Wealth Management, LLC | 0 | -100,00 | 0 | -100,00 | ||||
| 2025-08-01 | 13F | Bessemer Group Inc | 0 | -100,00 | 0 | |||||
| 2025-08-13 | 13F | Walleye Capital LLC | 3.519 | 200 | ||||||
| 2025-07-15 | 13F | Main Street Group, LTD | 3 | 0,00 | 0 | |||||
| 2025-08-14 | 13F | Bank Of America Corp /de/ | 200.410 | -28,31 | 11.403 | -16,15 | ||||
| 2025-08-14 | 13F | Federation des caisses Desjardins du Quebec | 1.000 | 0,00 | 57 | 16,67 | ||||
| 2025-05-06 | 13F | Advisors Preferred, LLC | 0 | -100,00 | 0 | |||||
| 2025-07-22 | 13F | Wealthcare Advisory Partners LLC | 5.111 | -3,13 | 291 | 13,28 | ||||
| 2025-08-14 | 13F | Wells Fargo & Company/mn | 175.833 | 8,69 | 10.005 | 27,12 | ||||
| 2025-05-05 | 13F | Diversify Advisory Services, LLC | 0 | -100,00 | 0 | -100,00 | ||||
| 2025-07-17 | 13F | Bluesphere Advisors, LLC | 0 | -100,00 | 0 | |||||
| 2025-08-05 | 13F | Harel Insurance Investments & Financial Services Ltd. | 1 | 0,00 | 0 | |||||
| 2025-08-14 | 13F | Comerica Bank | 1.100 | 0,00 | 63 | 16,98 | ||||
| 2025-08-04 | 13F | Flagship Harbor Advisors, Llc | 7.531 | -7,09 | 429 | 8,63 | ||||
| 2025-08-14 | 13F | Abound Financial, Llc | 0 | -100,00 | 0 | |||||
| 2025-08-11 | 13F | Annis Gardner Whiting Capital Advisors, LLC | 264 | 0,00 | 15 | 25,00 | ||||
| 2025-07-16 | 13F | ORG Partners LLC | 434 | 0,00 | 25 | 14,29 | ||||
| 2025-08-14 | 13F | Susquehanna International Group, Llp | 3.817 | -85,88 | 217 | -83,50 | ||||
| 2025-08-15 | 13F | Morgan Stanley | 479.301 | 4,28 | 27.272 | 21,97 | ||||
| 2025-08-11 | 13F | HighTower Advisors, LLC | 573.381 | 0,66 | 32.625 | 17,72 | ||||
| 2025-05-13 | 13F | Lighthouse Financial LLC | 0 | -100,00 | 0 | |||||
| 2025-05-12 | 13F | Financial Services Advisory Inc | 0 | -100,00 | 0 | |||||
| 2025-07-29 | 13F | Tradewinds Capital Management, LLC | 0 | -100,00 | 0 | |||||
| 2025-08-12 | 13F | Quadcap Wealth Management, LLC | 4.062 | -15,50 | 231 | -0,86 | ||||
| 2025-05-01 | 13F | Asset Dedication, LLC | 0 | -100,00 | 0 | |||||
| 2025-05-15 | 13F | Citadel Advisors Llc | Put | 0 | -100,00 | 0 | ||||
| 2025-05-15 | 13F | Citadel Advisors Llc | Call | 0 | -100,00 | 0 | ||||
| 2025-08-12 | 13F | Steward Partners Investment Advisory, Llc | 1.830 | 2,81 | 104 | 20,93 | ||||
| 2025-07-29 | NP | MSSS - Monarch Select Subsector Index ETF | 169.381 | -12,65 | 9.030 | -14,80 | ||||
| 2025-08-14 | 13F | Goldman Sachs Group Inc | 67.168 | -63,83 | 3.822 | -57,70 | ||||
| 2025-08-13 | 13F/A | StoneX Group Inc. | 0 | -100,00 | 0 | -100,00 | ||||
| 2025-08-05 | 13F | Smith Shellnut Wilson Llc /adv | 3.639 | 207 | ||||||
| 2025-05-15 | 13F | Citadel Advisors Llc | 0 | -100,00 | 0 | |||||
| 2025-07-25 | 13F | Cwm, Llc | 2.986 | -0,60 | 0 | |||||
| 2025-08-26 | NP | LCR - Leuthold Core ETF | 7.292 | 415 | ||||||
| 2025-07-24 | 13F | Thompson Investment Management, Inc. | 4 | 0,00 | 0 | |||||
| 2025-07-31 | 13F | CNB Bank | 415 | 0,00 | 24 | 15,00 | ||||
| 2025-08-11 | 13F | Private Advisor Group, LLC | 9.172 | -3,27 | 522 | 13,02 | ||||
| 2025-08-15 | 13F | Kestra Advisory Services, LLC | 14.095 | 58,55 | 802 | 85,65 | ||||
| 2025-08-12 | 13F | LPL Financial LLC | 153.328 | -23,37 | 8.724 | -10,38 | ||||
| 2025-05-16 | 13F/A | Kestra Investment Management, LLC | 0 | -100,00 | 0 | |||||
| 2025-05-14 | 13F | Van Hulzen Asset Management, LLC | 0 | -100,00 | 0 | |||||
| 2025-07-11 | 13F | Farther Finance Advisors, LLC | 238 | 0,00 | 14 | 18,18 | ||||
| 2025-07-30 | 13F | Whittier Trust Co | 23 | 0,00 | 1 | 0,00 | ||||
| 2025-07-31 | 13F | Cambridge Investment Research Advisors, Inc. | 17.513 | -14,51 | 1 | |||||
| 2025-08-01 | 13F | Envestnet Asset Management Inc | 23.735 | 108,60 | 1.351 | 144,12 | ||||
| 2025-08-12 | 13F | Howe & Rusling Inc | 111 | 6 | ||||||
| 2025-05-09 | 13F | Belvedere Trading LLC | Put | 0 | -100,00 | 0 | -100,00 | |||
| 2025-08-12 | 13F | Ameritas Investment Partners, Inc. | 280 | 0,00 | 16 | 15,38 | ||||
| 2025-07-24 | 13F | IFP Advisors, Inc | 1.687 | 0,00 | 96 | 15,85 | ||||
| 2025-08-04 | 13F | HBK Sorce Advisory LLC | 0 | -100,00 | 0 | |||||
| 2025-08-11 | 13F | Principal Securities, Inc. | 120 | -86,00 | 7 | -86,36 | ||||
| 2025-07-21 | 13F | Ameritas Advisory Services, LLC | 1.265 | 72 | ||||||
| 2025-08-12 | 13F | Global Retirement Partners, LLC | 321 | 0,00 | 18 | 12,50 | ||||
| 2025-08-14 | 13F | Quantinno Capital Management LP | 6.417 | -2,82 | 365 | 13,71 | ||||
| 2025-08-13 | 13F | Gateway Wealth Partners, LLC | 5.016 | -10,25 | 285 | 5,17 | ||||
| 2025-08-06 | 13F | Commonwealth Equity Services, Llc | 21.610 | -6,77 | 1 | 0,00 | ||||
| 2025-08-11 | 13F | Wealthspire Advisors, LLC | 5.618 | 0,00 | 320 | 16,85 | ||||
| 2025-08-13 | 13F | Northwestern Mutual Wealth Management Co | 10.672 | 0,00 | 607 | 16,96 | ||||
| 2025-05-06 | 13F | AE Wealth Management LLC | 0 | -100,00 | 0 | -100,00 | ||||
| 2025-08-05 | 13F | Wellington Shields & Co., LLC | 5.610 | 319 | ||||||
| 2025-08-08 | 13F | New England Capital Financial Advisors LLC | 94 | 0,00 | 5 | 25,00 | ||||
| 2025-08-06 | 13F | Prospera Financial Services Inc | 6.666 | -7,57 | 379 | 8,29 | ||||
| 2025-08-14 | 13F | MGB Wealth Management, LLC | 750 | 0,00 | 43 | 16,67 | ||||
| 2025-07-25 | 13F | Hazlett, Burt & Watson, Inc. | 2.640 | 0,00 | 0 | |||||
| 2025-08-08 | 13F | Pnc Financial Services Group, Inc. | 650 | -7,14 | 37 | 5,88 | ||||
| 2025-08-12 | 13F | Stelac Advisory Services LLC | 1.880 | 107 | ||||||
| 2025-08-14 | 13F | First International Bank of Israel Ltd. | 3.712 | 211 | ||||||
| 2025-08-14 | 13F | Royal Bank Of Canada | 21.016 | -74,09 | 1.195 | -69,72 | ||||
| 2025-07-08 | 13F | Parallel Advisors, LLC | 54 | 3 | ||||||
| 2025-09-04 | 13F/A | Advisor Group Holdings, Inc. | 41.931 | 3,28 | 2.383 | 20,61 | ||||
| 2025-05-14 | 13F | Jane Street Group, Llc | 0 | -100,00 | 0 | |||||
| 2025-07-16 | 13F | Minichmacgregor Wealth Management, Llc | 7.065 | -1,30 | 402 | 15,23 | ||||
| 2025-08-08 | 13F | Larson Financial Group LLC | 0 | -100,00 | 0 | |||||
| 2025-08-12 | 13F | Prudential Plc | 202.100 | 14,50 | 11.499 | 33,93 | ||||
| 2025-08-13 | 13F | Amundi | 0 | -100,00 | 0 | |||||
| 2025-07-21 | 13F | Mirae Asset Global Investments Co., Ltd. | 1.600 | 91 | ||||||
| 2025-08-14 | 13F/A | Barclays Plc | 2.160 | 0,00 | 0 | |||||
| 2025-08-05 | 13F | Simplex Trading, Llc | 0 | -100,00 | 0 | |||||
| 2025-08-12 | 13F | Founders Financial Alliance, LLC | 400 | 0,00 | 23 | 15,79 | ||||
| 2025-08-14 | 13F | GWM Advisors LLC | 780 | 0,00 | 44 | 18,92 | ||||
| 2025-05-15 | 13F | Millennium Management Llc | 0 | -100,00 | 0 | -100,00 | ||||
| 2025-07-15 | 13F | Kwmg, Llc | 37.841 | -1,18 | 2.153 | 15,63 | ||||
| 2025-07-31 | 13F | Guardian Asset Advisors, LLC | 4.492 | -2,73 | 255 | 13,84 | ||||
| 2025-08-13 | 13F | Custom Index Systems, Llc | 4.897 | 5,04 | 279 | 23,01 | ||||
| 2025-08-14 | 13F | Ameriprise Financial Inc | 17.410 | 18,92 | 991 | 39,04 | ||||
| 2025-07-14 | 13F | UMA Financial Services, Inc. | 1.966 | 0,00 | 112 | 16,84 | ||||
| 2025-07-29 | 13F | Private Trust Co Na | 55 | 0,00 | 3 | 50,00 | ||||
| 2025-05-19 | 13F | Heck Capital Advisors, LLC | 0 | 0 | ||||||
| 2025-08-13 | 13F | Navis Wealth Advisors, LLC | 7.627 | 0,00 | 434 | 16,71 | ||||
| 2025-04-21 | 13F | Nelson, Van Denburg & Campbell Wealth Management Group, LLC | 0 | -100,00 | 0 | |||||
| 2025-05-15 | 13F | Creative Planning | 0 | -100,00 | 0 | |||||
| 2025-08-13 | 13F | Summit Financial, LLC | 0 | -100,00 | 0 | |||||
| 2025-08-19 | 13F | Anchor Investment Management, LLC | 158 | 0,00 | 9 | 14,29 | ||||
| 2025-08-13 | 13F | Thomist Capital Management, LP | 24.600 | 1.396 | ||||||
| 2025-07-17 | 13F | Beacon Capital Management, LLC | 50 | 0,00 | 3 | 0,00 | ||||
| 2025-07-22 | 13F | Iron Horse Wealth Management, LLC | 0 | -100,00 | 0 | -100,00 | ||||
| 2025-08-13 | 13F | Leuthold Group, Llc | 7.846 | 446 | ||||||
| 2025-07-23 | 13F | Ironwood Financial, llc | 15.131 | 0,00 | 736 | 0,00 | ||||
| 2025-08-14 | 13F | Fmr Llc | 6.584 | 117,51 | 375 | 154,42 | ||||
| 2025-08-12 | 13F | Heritage Trust Co | 5.045 | 0,00 | 287 | 17,14 | ||||
| 2025-08-12 | 13F | Jpmorgan Chase & Co | 30.000 | -88,46 | 1.707 | -86,50 | ||||
| 2025-08-14 | 13F | UBS Group AG | 66.930 | -8,83 | 3.808 | 6,64 | ||||
| 2025-08-14 | 13F | CoreCap Advisors, LLC | 17 | 0,00 | 1 | |||||
| 2025-05-16 | 13F | Coppell Advisory Solutions LLC | 0 | -100,00 | 0 | -100,00 | ||||
| 2025-07-29 | 13F | Harbor Asset Planning, Inc. | 3 | 0 | ||||||
| 2025-08-12 | 13F | Proequities, Inc. | 0 | 0 | ||||||
| 2025-08-11 | 13F | Nations Financial Group Inc, /ia/ /adv | 4.133 | -2,39 | 235 | 14,63 | ||||
| 2025-08-14 | 13F | Boston Private Wealth Llc | 0 | -100,00 | 0 | |||||
| 2025-08-11 | 13F | Citigroup Inc | 2.429 | 138 | ||||||
| 2025-08-18 | 13F/A | National Bank Of Canada /fi/ | 2.268 | 0,00 | 129 | 17,27 | ||||
| 2025-07-31 | 13F | Nilsine Partners, LLC | 26.660 | 0,27 | 1.517 | 17,25 | ||||
| 2025-05-15 | 13F | Glenmede Trust Co Na | 18 | -92,59 | 1 | -100,00 | ||||
| 2025-07-28 | 13F | Harbour Investments, Inc. | 1.178 | -33,75 | 67 | -22,09 | ||||
| 2025-08-15 | 13F | Tower Research Capital LLC (TRC) | 0 | -100,00 | 0 | |||||
| 2025-07-07 | 13F | Thurston, Springer, Miller, Herd & Titak, Inc. | 416 | 0,00 | 24 | 15,00 | ||||
| 2025-08-08 | 13F | Kingsview Wealth Management, LLC | 182.877 | -19,14 | 10.406 | -5,43 | ||||
| 2025-08-14 | 13F | Integrated Wealth Concepts LLC | 29.891 | -4,40 | 1.701 | 11,77 | ||||
| 2025-05-02 | 13F | Wealthfront Advisers Llc | 0 | -100,00 | 0 | -100,00 | ||||
| 2025-08-06 | 13F | Golden State Wealth Management, LLC | 500 | 0,00 | 28 | 16,67 | ||||
| 2025-07-24 | 13F | Bernard Wealth Management Corp. | 750 | 0,00 | 43 | 16,67 | ||||
| 2025-08-13 | 13F | Jones Financial Companies Lllp | 6.310 | 26,78 | 358 | 47,93 | ||||
| 2025-07-17 | 13F | Western Financial Corp/CA | 6.018 | -17,05 | 342 | -2,84 | ||||
| 2025-08-06 | 13F | Black Swift Group, LLC | 55.120 | 3.136 | ||||||
| 2025-08-05 | 13F | Bank Of Montreal /can/ | 150 | 0,00 | 9 | 14,29 | ||||
| 2025-08-14 | 13F | Raymond James Financial Inc | 197.308 | -6,87 | 11.227 | 8,92 | ||||
| 2025-08-07 | 13F | Hennion & Walsh Asset Management, Inc. | 8.945 | 0,00 | 509 | 16,78 | ||||
| 2025-08-14 | 13F | Stifel Financial Corp | 10.273 | -6,84 | 585 | 8,96 | ||||
| 2025-08-13 | 13F | VestGen Advisors, LLC | 0 | -100,00 | 0 | |||||
| 2025-04-10 | 13F | EWG Elevate Inc. | 0 | -100,00 | 0 | |||||
| 2025-08-05 | 13F | Huntington National Bank | 8 | 14,29 |