Grundlæggende statistik
| Institutionelle ejere | 99 total, 99 long only, 0 short only, 0 long/short - change of 5,21% MRQ |
| Gennemsnitlig porteføljeallokering | 0.0577 % - change of -19,88% MRQ |
| Institutionelle aktier (lange) | 8.515.879 (ex 13D/G) - change of -0,03MM shares -0,34% MRQ |
| Institutionel værdi (lang) | $ 106.920 USD ($1000) |
Institutionelt ejerskab og aktionærer
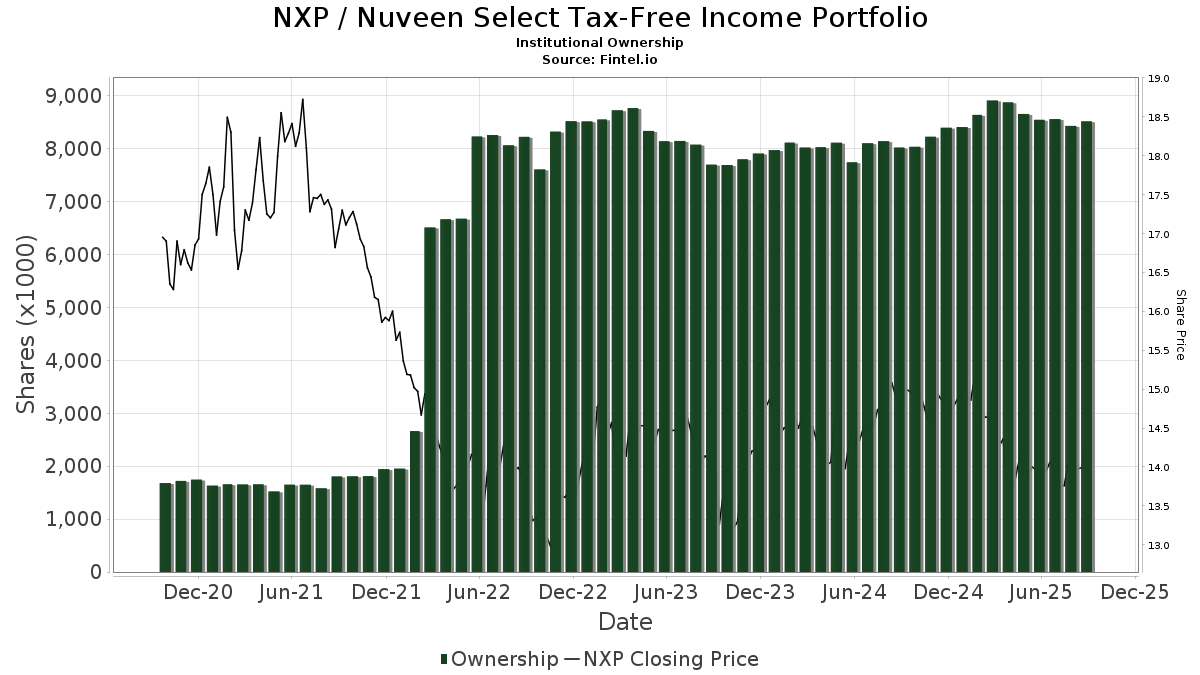
Nuveen Select Tax-Free Income Portfolio (US:NXP) har 99 institutionelle ejere og aktionærer, der har indsendt 13D/G- eller 13F-formularer til Securities Exchange Commission (SEC). Disse institutioner har i alt 8,515,879 aktier. Største aktionærer omfatter UBS Group AG, Hennion & Walsh Asset Management, Inc., Guggenheim Capital Llc, Stephens Inc /ar/, Cambridge Investment Research Advisors, Inc., Bank Of America Corp /de/, Morgan Stanley, Wells Fargo & Company/mn, Raymond James Financial Inc, and Commonwealth Equity Services, Llc .
Nuveen Select Tax-Free Income Portfolio (NYSE:NXP) institutionel ejerskabsstruktur viser aktuelle positioner i virksomheden efter institutioner og fonde, samt seneste ændringer i positionsstørrelse. Større aktionærer kan omfatte individuelle investorer, investeringsforeninger, hedgefonde eller institutioner. Skema 13D angiver, at investoren besidder (eller besidder) mere end 5 % af virksomheden og har til hensigt (eller har til hensigt at) aktivt at forfølge en ændring i forretningsstrategi. Skema 13G indikerer en passiv investering på over 5%.
The share price as of September 9, 2025 is 14,24 / share. Previously, on September 10, 2024, the share price was 15,02 / share. This represents a decline of 5,19% over that period.
Fondens stemningsscore
Fund Sentiment Score (fka Ownership Accumulation Score) finder de aktier, der bliver mest købt af fonde. Det er resultatet af en sofistikeret, multi-faktor kvantitativ model, der identificerer virksomheder med de højeste niveauer af institutionel akkumulering. Scoringsmodellen bruger en kombination af den samlede stigning i oplyste ejere, ændringerne i porteføljeallokeringer i disse ejere og andre målinger. Tallet går fra 0 til 100, hvor højere tal indikerer et højere niveau af akkumulering for sine jævnaldrende, og 50 er gennemsnittet.
Opdateringsfrekvens: Dagligt
Se Ownership Explorer, som giver en liste over højest rangerende virksomheder.
Institutionel Put/Call-forhold
Ud over at indberette standardaktie- og gældsudstedelser skal institutter med mere end 100 mill. aktiver under forvaltning også oplyse deres put- og call-optionsbeholdninger. Da salgsoptioner generelt indikerer negativ stemning, og købsoptioner indikerer positiv stemning, kan vi få en fornemmelse af den overordnede institutionelle stemning ved at plotte forholdet mellem put og kald. Diagrammet til højre viser det historiske put/call-forhold for dette instrument.
Brug af Put/Call Ratio som en indikator for investorernes stemning overvinder en af de vigtigste mangler ved at bruge totalt institutionelt ejerskab, som er, at en betydelig mængde af aktiver under forvaltning investeres passivt for at spore indekser. Passivt forvaltede fonde køber typisk ikke optioner, så indikatoren for put/call-forholdet følger mere nøje følelsen af aktivt forvaltede fonde.
13F og NPORT arkivering
Detaljer om 13F-arkivering er gratis. Detaljer om NP-ansøgninger kræver et premium-medlemskab. Grønne rækker angiver nye positioner. Røde rækker angiver lukkede positioner. Klik på linket ikon for at se den fulde transaktionshistorik.
Opgrader
for at låse premium-data op og eksportere til Excel ![]() .
.
| Fil dato | Kilde | Investor | Type | Gennemsnitlig pris (Øst) |
Aktier | Δ Aktier (%) |
Rapporteret Værdi ($1000) |
Δ Værdi (%) |
Port Alloc (%) |
|
|---|---|---|---|---|---|---|---|---|---|---|
| 2025-08-11 | 13F | Elequin Capital Lp | 10.774 | 83,79 | 151 | 79,76 | ||||
| 2025-06-25 | NP | XMPT - VanEck Vectors CEF Municipal Income ETF | 182.240 | 7,64 | 2.550 | 0,99 | ||||
| 2025-08-18 | 13F | Geneos Wealth Management Inc. | 855 | 200,00 | 12 | 200,00 | ||||
| 2025-07-17 | 13F | Nelson, Van Denburg & Campbell Wealth Management Group, LLC | 17.800 | -31,75 | 250 | -33,16 | ||||
| 2025-08-14 | 13F | Balyasny Asset Management Llc | 24.607 | 346 | ||||||
| 2025-08-12 | 13F | Wealth Dimensions Group, Ltd. | 11.521 | 0,00 | 162 | -2,42 | ||||
| 2025-07-11 | 13F | Lantz Financial LLC | 12.040 | 0,00 | 169 | -2,31 | ||||
| 2025-07-14 | 13F | AdvisorNet Financial, Inc | 63.810 | 3,65 | 897 | 1,36 | ||||
| 2025-07-22 | 13F | Wealthcare Advisory Partners LLC | 10.000 | 0,00 | 140 | -2,10 | ||||
| 2025-05-12 | 13F | Hirtle Callaghan & Co LLC | 909 | -5,11 | ||||||
| 2025-07-24 | 13F | IFP Advisors, Inc | 1.496 | 0,00 | 21 | 0,00 | ||||
| 2025-08-14 | 13F | Icon Wealth Advisors, LLC | 9.808 | 1,10 | 138 | -1,44 | ||||
| 2025-07-22 | 13F | Fortitude Advisory Group L.L.C. | 31.826 | 0,00 | 447 | 2,29 | ||||
| 2025-08-11 | 13F | Nations Financial Group Inc, /ia/ /adv | 11.360 | -0,61 | 160 | -3,05 | ||||
| 2025-08-13 | 13F | Jones Financial Companies Lllp | 158.104 | 3,26 | 2.207 | 0,46 | ||||
| 2025-05-14 | 13F | Summit Financial Wealth Advisors, LLC | 21.212 | 0,00 | 305 | -3,80 | ||||
| 2025-07-15 | 13F | Financial Management Professionals, Inc. | 666 | 0,00 | 9 | 0,00 | ||||
| 2025-07-24 | 13F | Trust Co Of Toledo Na /oh/ | 55 | 1 | ||||||
| 2025-07-17 | 13F | Janney Montgomery Scott LLC | 34.794 | -4,29 | 0 | |||||
| 2025-08-12 | 13F | Advisors Asset Management, Inc. | 97.587 | -24,44 | 1.371 | -26,09 | ||||
| 2025-08-12 | 13F | Wealthbridge Capital Management, Llc | 20.071 | 0,10 | 282 | -2,08 | ||||
| 2025-07-17 | 13F | Sound Income Strategies, LLC | 3.316 | 47 | ||||||
| 2025-07-25 | 13F | Cwm, Llc | 1.554 | 0,00 | 0 | |||||
| 2025-07-18 | 13F | Truist Financial Corp | 58.784 | 0,17 | 826 | -2,14 | ||||
| 2025-08-14 | 13F | Van Eck Associates Corp | 184.906 | 2,08 | 3 | 0,00 | ||||
| 2025-08-14 | 13F | Broyhill Asset Management | 39.464 | -25,27 | 554 | -26,91 | ||||
| 2025-07-16 | 13F | Essex Financial Services, Inc. | 29.000 | 0,00 | 407 | -2,16 | ||||
| 2025-07-29 | 13F | Stratos Wealth Partners, LTD. | 41.511 | 3,83 | 583 | 1,57 | ||||
| 2025-07-17 | 13F | Clean Yield Group | 6.653 | 0,00 | 93 | -2,11 | ||||
| 2025-08-13 | 13F | Guggenheim Capital Llc | 822.807 | 30,64 | 11.560 | 27,73 | ||||
| 2025-07-17 | 13F/A | Capital Investment Advisors, LLC | 49.707 | -5,24 | 698 | -7,30 | ||||
| 2025-08-05 | 13F | Carolinas Wealth Consulting Llc | 0 | -100,00 | 0 | -100,00 | ||||
| 2025-07-24 | 13F | Thompson Investment Management, Inc. | 375 | 0,00 | 5 | 0,00 | ||||
| 2025-08-14 | 13F | Ameriprise Financial Inc | 99.978 | -6,85 | 1.405 | -8,95 | ||||
| 2025-08-06 | 13F | Prospera Financial Services Inc | 197.536 | 1,03 | 2.775 | -1,21 | ||||
| 2025-08-04 | 13F | Wolverine Asset Management Llc | 13.790 | 10,54 | 194 | 7,82 | ||||
| 2025-07-09 | 13F | Breakwater Capital Group | 22.292 | -57,71 | 313 | -58,65 | ||||
| 2025-07-18 | 13F | Access Financial Services, Inc. | 58.951 | -45,05 | 828 | -46,27 | ||||
| 2025-07-31 | 13F | CVA Family Office, LLC | 1.285 | 0,00 | 18 | 0,00 | ||||
| 2025-08-07 | 13F | King Luther Capital Management Corp | 182 | -2,15 | ||||||
| 2025-08-12 | 13F | LPL Financial LLC | 130.674 | -4,52 | 1.836 | -6,66 | ||||
| 2025-08-08 | 13F | Cetera Investment Advisers | 26.700 | -5,14 | 375 | -7,18 | ||||
| 2025-07-22 | 13F | Diligent Investors, LLC | 10.000 | 140 | ||||||
| 2025-08-12 | 13F | Steward Partners Investment Advisory, Llc | 4.263 | -21,27 | 60 | -23,38 | ||||
| 2025-07-28 | 13F | Deroy & Devereaux Private Investment Counsel Inc | 11.591 | 0,00 | 0 | |||||
| 2025-08-14 | 13F | Susquehanna International Group, Llp | 10.865 | 153 | ||||||
| 2025-07-31 | 13F | Cambridge Investment Research Advisors, Inc. | 453.799 | -6,09 | 6 | 0,00 | ||||
| 2025-07-11 | 13F | Farther Finance Advisors, LLC | 0 | -100,00 | 0 | |||||
| 2025-08-12 | 13F | Global Retirement Partners, LLC | 0 | -100,00 | 0 | |||||
| 2025-07-16 | 13F | ORG Wealth Partners, LLC | 788 | 0,00 | 11 | 0,00 | ||||
| 2025-08-15 | 13F | Kestra Advisory Services, LLC | 13.619 | 14,58 | 191 | 12,35 | ||||
| 2025-07-08 | 13F | Parallel Advisors, LLC | 334 | 0,00 | 5 | 0,00 | ||||
| 2025-08-14 | 13F | Raymond James Financial Inc | 256.934 | 1,12 | 3.610 | -1,15 | ||||
| 2025-07-22 | 13F | Valley National Advisers Inc | 317 | 0 | ||||||
| 2025-05-13 | 13F | United Capital Financial Advisers, Llc | 0 | -100,00 | 0 | |||||
| 2025-07-07 | 13F | Trust Co | 255 | 0,00 | 4 | 0,00 | ||||
| 2025-07-17 | 13F | Melfa Wealth Management, Llc | 90.037 | 0,00 | 1.265 | -2,17 | ||||
| 2025-08-13 | 13F | Northwestern Mutual Wealth Management Co | 1.778 | -41,47 | 25 | -44,19 | ||||
| 2025-07-31 | 13F | City State Bank | 354 | 0,00 | 5 | -20,00 | ||||
| 2025-07-22 | 13F | Visionary Horizons, LLC | 15.550 | -6,16 | 218 | -8,40 | ||||
| 2025-08-11 | 13F | HighTower Advisors, LLC | 12.149 | 0,45 | 171 | -1,73 | ||||
| 2025-08-14 | 13F | Ancora Advisors, LLC | 17.677 | -2,10 | 248 | -4,25 | ||||
| 2025-08-04 | 13F | Pinnacle Associates Ltd | 30.501 | 0,00 | 429 | -2,28 | ||||
| 2025-07-16 | 13F | ORG Partners LLC | 829 | 0,00 | 12 | 0,00 | ||||
| 2025-07-10 | 13F | Wealth Enhancement Advisory Services, Llc | 13.571 | 190 | ||||||
| 2025-07-29 | 13F | Tradewinds Capital Management, LLC | 2.394 | 0,00 | 34 | -2,94 | ||||
| 2025-07-29 | 13F | Stephens Inc /ar/ | 508.084 | 0,10 | 7.139 | -2,13 | ||||
| 2025-08-19 | 13F | National Asset Management, Inc. | 0 | -100,00 | 0 | |||||
| 2025-08-06 | 13F | Commonwealth Equity Services, Llc | 215.593 | 0,89 | 3 | 0,00 | ||||
| 2025-08-14 | 13F | Wells Fargo & Company/mn | 417.432 | -5,33 | 5.865 | -7,45 | ||||
| 2025-07-16 | 13F | Midwest Heritage Bank, FSB | 11.487 | 1,11 | 161 | -1,23 | ||||
| 2025-07-22 | 13F | Coastal Investment Advisors, Inc. | 12.250 | 0,00 | 172 | -2,27 | ||||
| 2025-08-14 | 13F | Glenmede Investment Management, LP | 22.195 | 312 | ||||||
| 2025-07-21 | 13F | Ameritas Advisory Services, LLC | 4.020 | 56 | ||||||
| 2025-08-14 | 13F | Royal Bank Of Canada | 108.594 | 10,66 | 1.525 | 8,16 | ||||
| 2025-08-13 | 13F | StoneX Group Inc. | 0 | -100,00 | 0 | -100,00 | ||||
| 2025-07-28 | 13F | RFG Advisory, LLC | 12.160 | 16,42 | 171 | 13,33 | ||||
| 2025-07-11 | 13F | Pinnacle Bancorp, Inc. | 4.491 | 0,00 | 63 | -1,56 | ||||
| 2025-07-14 | 13F | Opal Wealth Advisors, LLC | 2.570 | 0,00 | 36 | 0,00 | ||||
| 2025-08-12 | 13F | Proequities, Inc. | 0 | 0 | ||||||
| 2025-08-13 | 13F | Capital Advisors Wealth Management, LLC | 43.029 | 20,86 | 605 | 18,20 | ||||
| 2025-05-12 | 13F | Fmr Llc | 0 | -100,00 | 0 | |||||
| 2025-07-21 | 13F | First National Bank & Trust Co Of Newtown | 23.550 | 0,00 | 331 | -2,37 | ||||
| 2025-08-13 | 13F | Plan Group Financial, LLC | 16.540 | 232 | ||||||
| 2025-08-07 | 13F | Hennion & Walsh Asset Management, Inc. | 1.015.165 | -3,24 | 14.263 | -5,39 | ||||
| 2025-08-11 | 13F | Brown Brothers Harriman & Co | 28.108 | 395 | ||||||
| 2025-07-15 | 13F | Sightline Wealth Advisors, LLC | 15.390 | -22,28 | 216 | -23,94 | ||||
| 2025-07-16 | 13F | Moisand Fitzgerald Tamayo, LLC | 5.914 | 0,00 | 83 | -1,19 | ||||
| 2025-07-30 | 13F | D.a. Davidson & Co. | 13.207 | 0,60 | 186 | -1,60 | ||||
| 2025-08-14 | 13F | Bank Of America Corp /de/ | 446.821 | 1,18 | 6.278 | -1,09 | ||||
| 2025-07-14 | 13F | U.S. Capital Wealth Advisors, LLC | 10.000 | 140 | ||||||
| 2025-07-23 | 13F | Tyche Wealth Partners LLC | 10.196 | 0,00 | 143 | -2,05 | ||||
| 2025-07-25 | 13F | Concurrent Investment Advisors, LLC | 31.581 | 16,75 | 444 | 14,18 | ||||
| 2025-08-14 | 13F | Comerica Bank | 51.976 | 0,00 | 730 | -2,14 | ||||
| 2025-07-08 | 13F | Nbc Securities, Inc. | 0 | -100,00 | 0 | |||||
| 2025-07-30 | 13F | FNY Investment Advisers, LLC | 200 | 0,00 | 0 | |||||
| 2025-08-14 | 13F | Stifel Financial Corp | 27.665 | -11,38 | 389 | -13,39 | ||||
| 2025-08-14 | 13F | UBS Group AG | 1.357.998 | -6,53 | 19.080 | -8,61 | ||||
| 2025-08-12 | 13F | Skopos Labs, Inc. | 10 | 0,00 | 0 | |||||
| 2025-08-15 | 13F | Provenance Wealth Advisors, LLC | 0 | -100,00 | 0 | -100,00 | ||||
| 2025-07-28 | 13F | Harbour Investments, Inc. | 10.156 | 0,00 | 143 | -2,07 | ||||
| 2025-09-04 | 13F/A | Advisor Group Holdings, Inc. | 51.882 | 63,62 | 729 | 60,22 | ||||
| 2025-08-14 | 13F/A | Rockefeller Capital Management L.P. | 21.893 | 16,45 | 308 | 13,70 | ||||
| 2025-08-12 | 13F | Putnam Fl Investment Management Co | 48.789 | -2,47 | 685 | -4,60 | ||||
| 2025-08-15 | 13F | Morgan Stanley | 427.541 | -3,03 | 6.007 | -5,19 | ||||
| 2025-05-15 | 13F | Glenmede Trust Co Na | 22.195 | 0,00 | 319 | -5,36 | ||||
| 2025-07-31 | 13F | Blake Schutter Theil Wealth Advisors, LLC | 17.870 | -55,11 | 251 | -56,12 | ||||
| 2025-08-11 | 13F | Rothschild Investment Llc | 8.718 | 0,00 | 122 | -2,40 | ||||
| 2025-07-11 | 13F | Annex Advisory Services, LLC | 0 | -100,00 | 0 | |||||
| 2025-08-07 | 13F | Flagship Wealth Advisors, Llc | 6.875 | 0,00 | 97 | -2,04 | ||||
| 2025-07-22 | 13F | Rocky Mountain Advisers, Llc | 510 | 0,00 | 7 | 0,00 | ||||
| 2025-08-08 | 13F | ProVise Management Group, LLC | 25.710 | 1,98 | 361 | -0,28 |