Grundlæggende statistik
| Institutionelle ejere | 96 total, 93 long only, 0 short only, 3 long/short - change of 14,12% MRQ |
| Gennemsnitlig porteføljeallokering | 0.1492 % - change of -41,20% MRQ |
| Institutionelle aktier (lange) | 10.832.460 (ex 13D/G) - change of -4,14MM shares -27,65% MRQ |
| Institutionel værdi (lang) | $ 139.222 USD ($1000) |
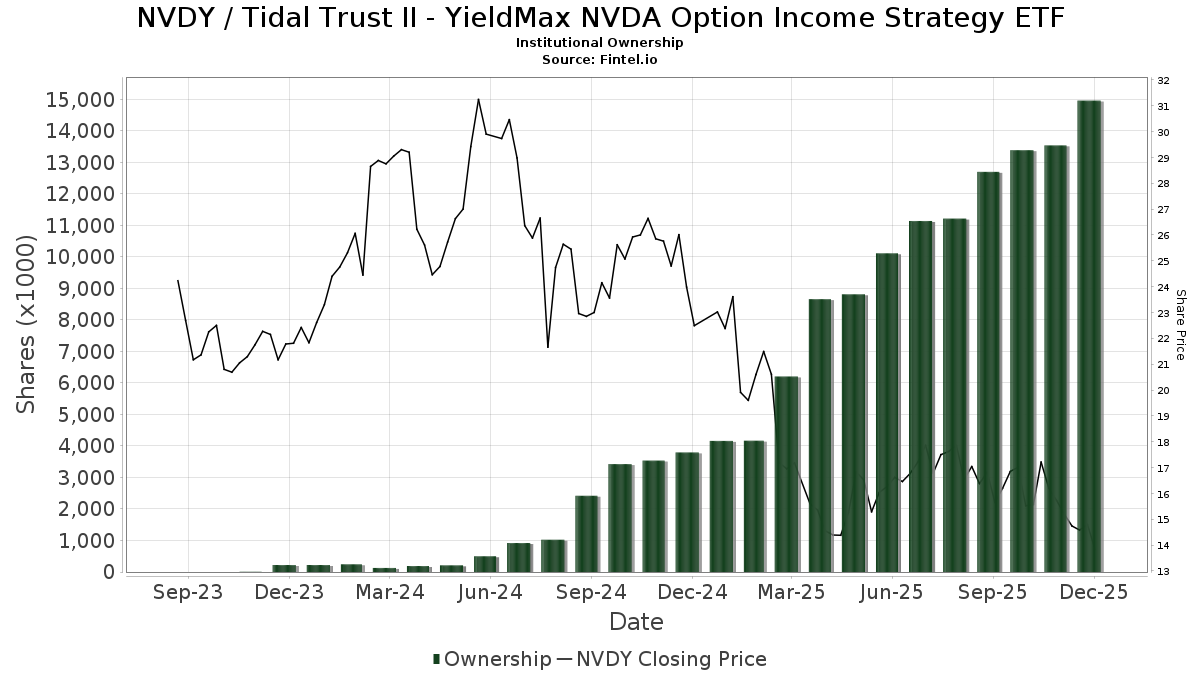
Institutionelt ejerskab og aktionærer
Tidal Trust II - YieldMax NVDA Option Income Strategy ETF (US:NVDY) har 96 institutionelle ejere og aktionærer, der har indsendt 13D/G- eller 13F-formularer til Securities Exchange Commission (SEC). Disse institutioner har i alt 10,832,460 aktier. Største aktionærer omfatter Toroso Investments, LLC, Centaurus Financial, Inc., Mcguire Capital Advisors Inc, Susquehanna International Group, Llp, Susquehanna International Group, Llp, Goldman Sachs Group Inc, Old Mission Capital Llc, Avidian Wealth Solutions, LLC, Sunbelt Securities, Inc., and Citadel Advisors Llc .
Tidal Trust II - YieldMax NVDA Option Income Strategy ETF (ARCA:NVDY) institutionel ejerskabsstruktur viser aktuelle positioner i virksomheden efter institutioner og fonde, samt seneste ændringer i positionsstørrelse. Større aktionærer kan omfatte individuelle investorer, investeringsforeninger, hedgefonde eller institutioner. Skema 13D angiver, at investoren besidder (eller besidder) mere end 5 % af virksomheden og har til hensigt (eller har til hensigt at) aktivt at forfølge en ændring i forretningsstrategi. Skema 13G indikerer en passiv investering på over 5%.
The share price as of April 14, 2026 is 13,84 / share. Previously, on April 15, 2025, the share price was 15,50 / share. This represents a decline of 10,71% over that period.
Fondens stemningsscore
Fund Sentiment Score (fka Ownership Accumulation Score) finder de aktier, der bliver mest købt af fonde. Det er resultatet af en sofistikeret, multi-faktor kvantitativ model, der identificerer virksomheder med de højeste niveauer af institutionel akkumulering. Scoringsmodellen bruger en kombination af den samlede stigning i oplyste ejere, ændringerne i porteføljeallokeringer i disse ejere og andre målinger. Tallet går fra 0 til 100, hvor højere tal indikerer et højere niveau af akkumulering for sine jævnaldrende, og 50 er gennemsnittet.
Opdateringsfrekvens: Dagligt
Se Ownership Explorer, som giver en liste over højest rangerende virksomheder.
AI+ Ask Fintel’s AI assistant about Tidal Trust II - YieldMax NVDA Option Income Strategy ETF.
Select a question to share a public post with an AI-crafted answer.
Thinking of good questions…
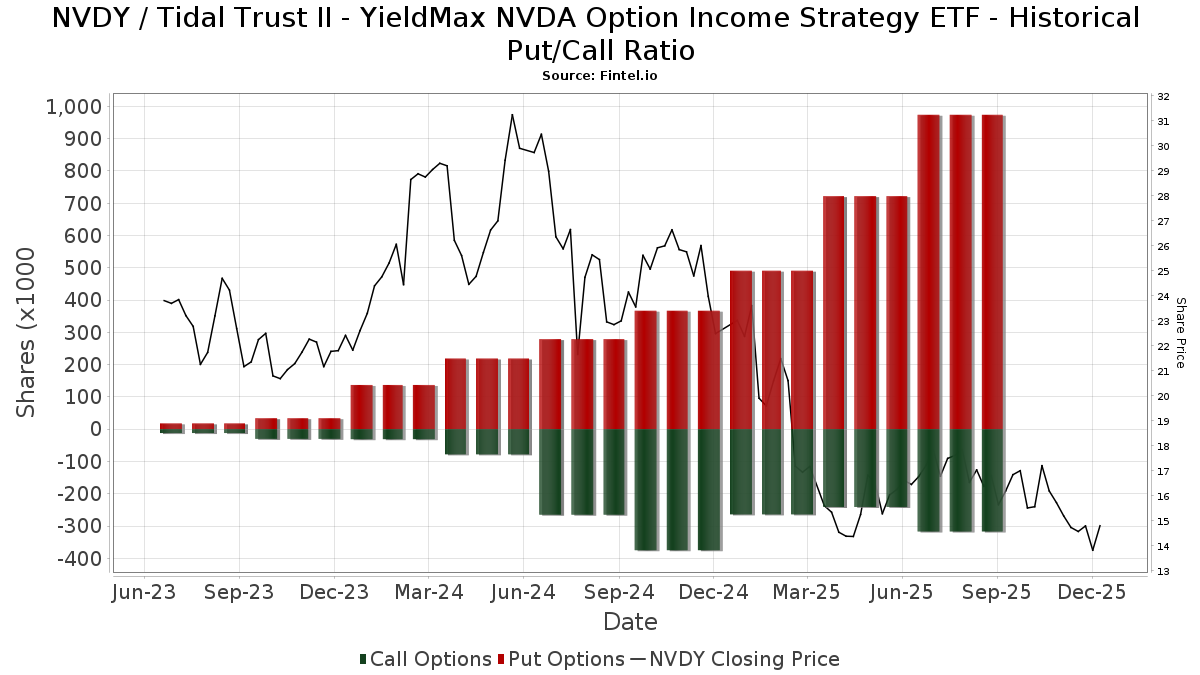
Institutionel Put/Call-forhold
Ud over at indberette standardaktie- og gældsudstedelser skal institutter med mere end 100 mill. aktiver under forvaltning også oplyse deres put- og call-optionsbeholdninger. Da salgsoptioner generelt indikerer negativ stemning, og købsoptioner indikerer positiv stemning, kan vi få en fornemmelse af den overordnede institutionelle stemning ved at plotte forholdet mellem put og kald. Diagrammet til højre viser det historiske put/call-forhold for dette instrument.
Brug af Put/Call Ratio som en indikator for investorernes stemning overvinder en af de vigtigste mangler ved at bruge totalt institutionelt ejerskab, som er, at en betydelig mængde af aktiver under forvaltning investeres passivt for at spore indekser. Passivt forvaltede fonde køber typisk ikke optioner, så indikatoren for put/call-forholdet følger mere nøje følelsen af aktivt forvaltede fonde.
13F og NPORT arkivering
Detaljer om 13F-arkivering er gratis. Detaljer om NP-ansøgninger kræver et premium-medlemskab. Grønne rækker angiver nye positioner. Røde rækker angiver lukkede positioner. Klik på linket ikon for at se den fulde transaktionshistorik.
Opgrader
for at låse premium-data op og eksportere til Excel ![]() .
.
| Fil dato | Kilde | Investor | Type | Gennemsnitlig pris (Øst) |
Aktier | Δ Aktier (%) |
Rapporteret Værdi ($1000) |
Δ Værdi (%) |
Port Alloc (%) |
|
|---|---|---|---|---|---|---|---|---|---|---|
| 2026-01-29 | 13F | IMC-Chicago, LLC | 92.423 | -82,47 | 1.350 | -84,75 | ||||
| 2026-02-17 | 13F | Susquehanna International Group, Llp | Call | 88.900 | 21,78 | 1.299 | 5,87 | |||
| 2026-01-26 | 13F | PFG Investments, LLC | 38.472 | 562 | ||||||
| 2026-04-08 | 13F | Dynamic Advisor Solutions LLC | 35.925 | -4,88 | 466 | -15,43 | ||||
| 2026-02-12 | 13F | Colonial Trust Advisors | 1 | -100,00 | 0 | -100,00 | ||||
| 2026-02-17 | 13F | Susquehanna International Group, Llp | 705.875 | -0,36 | 10.313 | -13,35 | ||||
| 2026-02-20 | 13F | Sunbelt Securities, Inc. | 242.462 | 4,69 | 3.542 | -8,97 | ||||
| 2026-02-13 | 13F | Arete Wealth Advisors, LLC | 13.845 | 25,91 | 0 | |||||
| 2026-02-17 | 13F | Susquehanna International Group, Llp | Put | 540.900 | -21,51 | 7.903 | -31,74 | |||
| 2026-02-13 | 13F | Cavalier Investments, LLC | 26.918 | 21,67 | 393 | 5,93 | ||||
| 2026-02-17 | 13F | XTX Topco Ltd | 19.868 | 290 | ||||||
| 2026-04-07 | 13F | U.S. Capital Wealth Advisors, LLC | 13.000 | 0,00 | 169 | -11,11 | ||||
| 2026-02-04 | 13F | Ameritas Advisory Services, LLC | 0 | -100,00 | 0 | |||||
| 2026-02-05 | 13F | Cambridge Investment Research Advisors, Inc. | 43.844 | 24,20 | 1 | |||||
| 2026-01-08 | 13F | Kure Advisory, LLC | 12.794 | 0,00 | 187 | -13,08 | ||||
| 2026-04-07 | 13F | Investment Partners Asset Management, Inc. | 0 | -100,00 | 0 | |||||
| 2026-04-10 | 13F | Winebrenner Capital Management Llc | 10.000 | 0,00 | 130 | -11,64 | ||||
| 2026-01-23 | 13F | Intelligence Driven Advisers, LLC | 10.094 | 147 | ||||||
| 2026-02-12 | 13F | SWAN Capital LLC | 371 | 0,00 | 5 | -16,67 | ||||
| 2026-02-13 | 13F | Mml Investors Services, Llc | 21.451 | -13,57 | 313 | -24,76 | ||||
| 2026-02-17 | 13F | Mercer Global Advisors Inc /adv | 25.236 | -89,16 | 369 | -90,59 | ||||
| 2026-01-21 | 13F | MBL Wealth, LLC | 25.400 | -45,26 | 371 | -52,37 | ||||
| 2026-02-17 | 13F | Clear Street Markets Llc | 0 | -100,00 | 0 | |||||
| 2025-11-07 | 13F | HighTower Advisors, LLC | 0 | -100,00 | 0 | |||||
| 2026-04-14 | 13F | Nbc Securities, Inc. | 1.068 | 14 | ||||||
| 2026-01-14 | 13F | ORG Wealth Partners, LLC | 0 | -100,00 | 0 | |||||
| 2026-04-14 | 13F | Prospera Financial Services Inc | 12.387 | 0,71 | 161 | -10,61 | ||||
| 2025-11-14 | 13F | NorthRock Partners, LLC | 0 | -100,00 | 0 | -100,00 | ||||
| 2026-02-03 | 13F | International Assets Investment Management, Llc | 500 | 7 | ||||||
| 2026-02-12 | 13F | Jane Street Group, Llc | Put | 40.800 | 11,78 | 596 | -2,77 | |||
| 2026-02-12 | 13F | Jane Street Group, Llc | Call | 78.600 | -33,05 | 1.148 | -41,78 | |||
| 2026-02-10 | 13F | Core Wealth Advisors, Llc | 522 | 8 | ||||||
| 2026-02-12 | 13F | Jane Street Group, Llc | 185.399 | 2.709 | ||||||
| 2026-02-17 | 13F | Two Sigma Securities, Llc | 13.634 | 15,59 | 199 | 0,51 | ||||
| 2026-02-12 | 13F | Commonwealth Equity Services, Llc | 24.602 | 359 | ||||||
| 2026-02-12 | 13F | Renaissance Technologies Llc | 0 | -100,00 | 0 | |||||
| 2026-02-17 | 13F | Tower Research Capital LLC (TRC) | 0 | -100,00 | 0 | |||||
| 2026-02-17 | 13F | Adams Wealth Management | 13.405 | 196 | ||||||
| 2026-02-17 | 13F | Fmr Llc | 100 | 1 | ||||||
| 2026-02-13 | 13F | Arkadios Wealth Advisors | 10.782 | 7,07 | 158 | -7,10 | ||||
| 2026-02-17 | 13F | Bank Of America Corp /de/ | 409 | 6 | ||||||
| 2026-02-06 | 13F | Pnc Financial Services Group, Inc. | 4.887 | 69,28 | 71 | 47,92 | ||||
| 2026-02-12 | 13F | Hrt Financial Lp | 0 | -100,00 | 0 | |||||
| 2026-01-29 | 13F | UBS Group AG | 88.133 | 751,86 | 1.288 | 643,93 | ||||
| 2026-01-26 | 13F | AE Wealth Management LLC | 8.324 | 542,78 | 122 | 476,19 | ||||
| 2025-11-13 | 13F | Beaird Harris Wealth Management, LLC | 0 | -100,00 | 0 | |||||
| 2026-02-13 | 13F | Visionary Wealth Advisors | 43.374 | 15,60 | 634 | 0,48 | ||||
| 2026-02-12 | 13F | Federation des caisses Desjardins du Quebec | 1.200 | -97,77 | 18 | -98,12 | ||||
| 2026-04-13 | 13F | IFP Advisors, Inc | 875 | 0,00 | 11 | -8,33 | ||||
| 2026-02-13 | 13F | Centaurus Financial, Inc. | 1.063.699 | 5,31 | 16 | -6,25 | ||||
| 2026-02-18 | 13F | CacheTech Inc. | 13.405 | 196 | ||||||
| 2026-02-11 | 13F | Stirlingshire Investments, Inc. | 95.972 | 1.402 | ||||||
| 2026-02-13 | 13F | Morgan Stanley | 881 | -89,12 | 13 | -91,18 | ||||
| 2025-11-14 | 13F | Hamilton Wealth, LLC | 0 | -100,00 | 0 | |||||
| 2026-02-05 | 13F | Tucker Asset Management Llc | 4.035 | -3,79 | 59 | -17,14 | ||||
| 2026-02-13 | 13F | Wells Fargo & Company/mn | 3 | 50,00 | 0 | |||||
| 2026-01-13 | 13F | Signal Advisors Wealth, LLC | 0 | -100,00 | 0 | |||||
| 2026-02-17 | 13F/A | BluePath Capital Management, LLC | 0 | -100,00 | 0 | |||||
| 2026-02-05 | 13F | HFM Investment Advisors, LLC | 1.840 | 27 | ||||||
| 2025-11-26 | 13F/A | Jpmorgan Chase & Co | 0 | 0 | ||||||
| 2026-02-10 | 13F | Goldman Sachs Group Inc | 416.962 | 6.092 | ||||||
| 2026-02-12 | 13F | Wedbush Securities Inc | 31.194 | 67,45 | 0 | |||||
| 2026-01-12 | 13F | Traynor Capital Management, Inc. | 11.303 | -25,57 | 165 | -35,29 | ||||
| 2026-02-12 | 13F | Steward Partners Investment Advisory, Llc | 2.100 | 32,33 | 31 | 15,38 | ||||
| 2026-01-30 | 13F | Us Bancorp \de\ | 4.973 | 0,00 | 73 | -13,25 | ||||
| 2026-02-17 | 13F | Private Advisor Group, LLC | 22.906 | 26,31 | 335 | 9,87 | ||||
| 2025-11-13 | 13F | Jump Financial, LLC | 0 | -100,00 | 0 | |||||
| 2026-02-05 | 13F | Northwestern Mutual Wealth Management Co | 279 | 2.225,00 | 32 | |||||
| 2026-02-09 | 13F | Harbour Investments, Inc. | 206 | 0,49 | 3 | 0,00 | ||||
| 2026-02-02 | 13F | Avidian Wealth Solutions, LLC | 262.070 | -16,19 | 3.829 | -27,13 | ||||
| 2025-11-17 | 13F | Pin Oak Investment Advisors Inc | 0 | -100,00 | 0 | |||||
| 2026-02-19 | 13F | Mcguire Capital Advisors Inc | 1.012.289 | 14.790 | ||||||
| 2026-02-19 | 13F | Atomi Financial Group, Inc. | 27.647 | 25,92 | 404 | 9,51 | ||||
| 2026-02-12 | 13F | Principal Securities, Inc. | 10.232 | 8,70 | 149 | -5,70 | ||||
| 2026-02-13 | 13F | Toroso Investments, LLC | 5.381.462 | -5,45 | 77.851 | -18,59 | ||||
| 2026-01-09 | 13F | Capital CS Group, LLC | 42.757 | 6,59 | 625 | -7,28 | ||||
| 2026-02-12 | 13F | StoneX Group Inc. | 19.185 | 280 | ||||||
| 2026-02-17 | 13F | Cetera Investment Advisers | 28.793 | 6,38 | 421 | -7,49 | ||||
| 2026-01-27 | 13F | ZEGA Investments, LLC | 24.837 | 60,18 | 363 | 39,23 | ||||
| 2026-01-21 | 13F | Capital Investment Advisory Services, LLC | 7.475 | 0,00 | 109 | -12,80 | ||||
| 2026-01-14 | 13F | Redhawk Wealth Advisors, Inc. | 17.106 | 7,23 | 250 | -7,09 | ||||
| 2026-02-11 | 13F | Simplex Trading, Llc | 0 | -100,00 | 0 | |||||
| 2025-10-29 | 13F | Wealth Enhancement Advisory Services, Llc | 0 | -100,00 | 0 | -100,00 | ||||
| 2026-01-16 | 13F | FNY Investment Advisers, LLC | 81.300 | 3.287,50 | 1 | |||||
| 2026-02-09 | 13F | Integrity Alliance, Llc. | 16.233 | 13,44 | 237 | -1,25 | ||||
| 2026-02-05 | 13F | Allworth Financial LP | 13.990 | 7,59 | 204 | -6,42 | ||||
| 2026-01-26 | 13F | Cwm, Llc | 0 | -100,00 | 0 | |||||
| 2026-02-03 | 13F | We Are One Seven, LLC | 34.081 | 35,83 | 498 | 18,05 | ||||
| 2026-02-10 | 13F | Envestnet Asset Management Inc | 10.389 | -2,49 | 152 | -15,17 | ||||
| 2026-02-11 | 13F | Group One Trading, L.p. | 4.525 | 66 | ||||||
| 2026-04-07 | 13F | Farther Finance Advisors, LLC | 605 | 0,00 | 8 | -12,50 | ||||
| 2026-02-17 | 13F | Advisor Group Holdings, Inc. | 12.302 | 5,07 | 180 | -8,67 | ||||
| 2026-02-17 | 13F | Cape Investment Advisory, Inc. | 140 | 2 | ||||||
| 2026-02-13 | 13F | Pinney & Scofield, Inc. | 1.721 | 760,50 | 25 | 733,33 | ||||
| 2026-04-14 | 13F | Westend Capital Management LLC | 47.888 | 23,63 | 622 | 9,91 | ||||
| 2026-02-09 | 13F | Blue Bell Private Wealth Management, Llc | 16 | 0,00 | 0 | |||||
| 2026-04-13 | 13F | St Germain D J Co Inc | 1 | 0 | ||||||
| 2026-02-14 | 13F | Rockefeller Capital Management L.P. | 12.500 | 24,95 | 183 | 8,33 | ||||
| 2026-02-17 | 13F | Royal Bank Of Canada | 7 | 0 | ||||||
| 2026-01-30 | 13F | Bogart Wealth, LLC | 878 | 13 | ||||||
| 2026-04-07 | 13F | Signaturefd, Llc | 600 | 20,00 | 8 | 0,00 | ||||
| 2026-02-17 | 13F | Old Mission Capital Llc | 278.236 | 108,00 | 4.065 | 80,91 | ||||
| 2025-10-27 | 13F | Stephens Inc /ar/ | 0 | -100,00 | 0 | |||||
| 2026-04-02 | 13F | Ares Financial Consulting, LLC | 99 | 1 | ||||||
| 2026-04-06 | 13F | Versant Capital Management, Inc | 2.355 | 8,38 | 31 | -3,23 | ||||
| 2025-11-14 | 13F | Raymond James Financial Inc | 0 | -100,00 | 0 | |||||
| 2026-02-12 | 13F | Bank Of Montreal /can/ | 170 | 0,00 | 2 | 0,00 | ||||
| 2026-04-07 | 13F | CoreCap Advisors, LLC | 2.833 | 3,55 | 37 | -7,69 | ||||
| 2026-02-06 | 13F | Global Retirement Partners, LLC | 203 | 0,00 | 3 | -33,33 | ||||
| 2026-02-11 | 13F | J.Safra Asset Management Corp | 14.944 | -4,97 | 218 | -17,42 | ||||
| 2026-02-13 | 13F | Kestra Advisory Services, LLC | 6.199 | 91 | ||||||
| 2026-02-27 | 13F | Strategic Investment Solutions, Inc. /IL | 86 | 14,67 | 1 | 0,00 | ||||
| 2026-02-04 | 13F | Clark Wealth Partners | 522 | 0,00 | 8 | 0,00 | ||||
| 2026-04-14 | 13F | Meadowbrook Wealth Management, LLC | 18.285 | -14,97 | 237 | -24,52 | ||||
| 2026-02-10 | 13F | Private Wealth Asset Management, LLC | 100 | 100,00 | 1 | |||||
| 2026-02-17 | 13F | Citadel Advisors Llc | Put | 213.300 | -14,34 | 3.116 | -25,51 | |||
| 2026-01-14 | 13F | Jfs Wealth Advisors, Llc | 50 | 0,00 | 1 | |||||
| 2026-02-17 | 13F | Citadel Advisors Llc | Call | 132.300 | 3,85 | 1.933 | -9,72 | |||
| 2026-02-12 | 13F | BRYN MAWR TRUST Co | 2.256 | 0,00 | 33 | -13,51 | ||||
| 2026-02-18 | 13F | Garton & Associates Financial Advisors LLC | 1.140 | 17 | ||||||
| 2026-02-26 | 13F | Anchor Investment Management, LLC | 0 | -100,00 | 0 | |||||
| 2025-10-21 | 13F | PDS Planning, Inc | 0 | -100,00 | 0 | |||||
| 2026-02-12 | 13F | Quadrant Capital Group Llc | 0 | -100,00 | 0 | |||||
| 2026-02-11 | 13F | J.w. Cole Advisors, Inc. | 16.597 | -5,08 | 242 | -17,41 | ||||
| 2025-11-04 | 13F | Guerra Advisors Inc | 18 | 0 | ||||||
| 2025-11-12 | 13F | Headlands Technologies LLC | 0 | -100,00 | 0 |