Grundlæggende statistik
| Institutionelle ejere | 155 total, 152 long only, 0 short only, 3 long/short - change of 4,00% MRQ |
| Gennemsnitlig porteføljeallokering | 0.1341 % - change of -19,31% MRQ |
| Institutionelle aktier (lange) | 2.090.489 (ex 13D/G) - change of 0,06MM shares 2,93% MRQ |
| Institutionel værdi (lang) | $ 128.093 USD ($1000) |
Institutionelt ejerskab og aktionærer
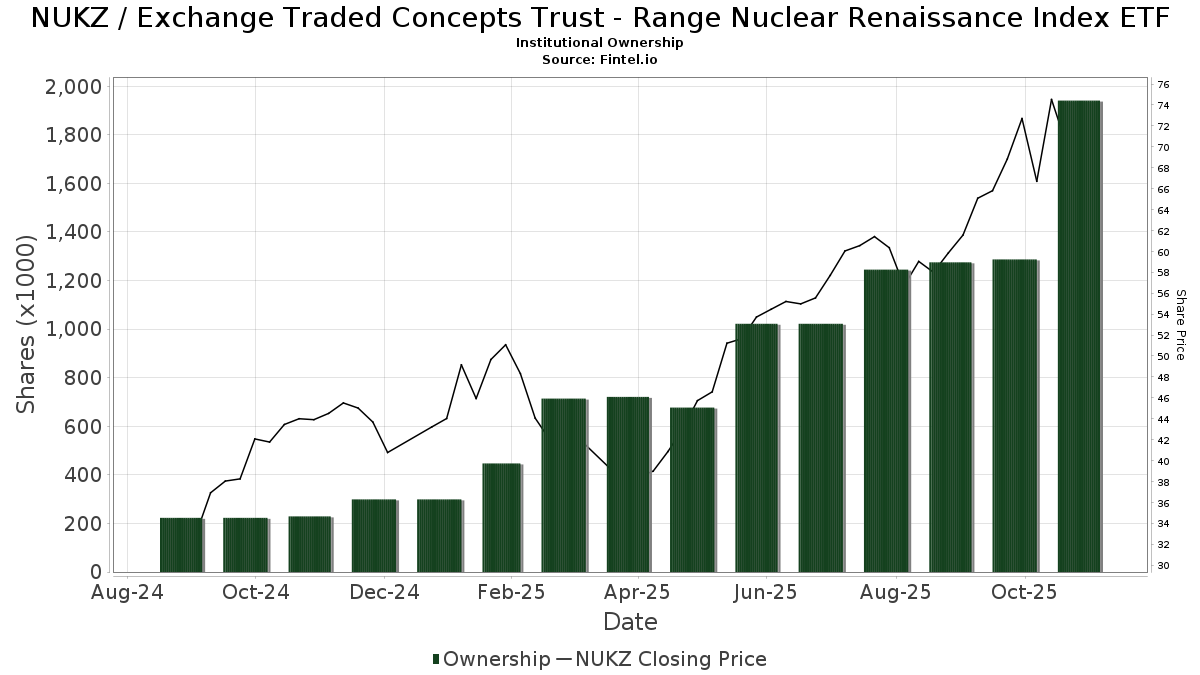
Exchange Traded Concepts Trust - Range Nuclear Renaissance Index ETF (US:NUKZ) har 155 institutionelle ejere og aktionærer, der har indsendt 13D/G- eller 13F-formularer til Securities Exchange Commission (SEC). Disse institutioner har i alt 2,090,489 aktier. Største aktionærer omfatter Cetera Investment Advisers, Silverleafe Capital Partners, LLC, Mutual Advisors, LLC, Fischer Investment Strategies, Llc, HBW Advisory Services LLC, Raymond James Financial Inc, Fiduciary Alliance LLC, Advisor Group Holdings, Inc., Commonwealth Equity Services, Llc, and Park Avenue Securities Llc .
Exchange Traded Concepts Trust - Range Nuclear Renaissance Index ETF (ARCA:NUKZ) institutionel ejerskabsstruktur viser aktuelle positioner i virksomheden efter institutioner og fonde, samt seneste ændringer i positionsstørrelse. Større aktionærer kan omfatte individuelle investorer, investeringsforeninger, hedgefonde eller institutioner. Skema 13D angiver, at investoren besidder (eller besidder) mere end 5 % af virksomheden og har til hensigt (eller har til hensigt at) aktivt at forfølge en ændring i forretningsstrategi. Skema 13G indikerer en passiv investering på over 5%.
The share price as of April 24, 2026 is 73,54 / share. Previously, on April 28, 2025, the share price was 40,74 / share. This represents an increase of 80,49% over that period.
Fondens stemningsscore
Fund Sentiment Score (fka Ownership Accumulation Score) finder de aktier, der bliver mest købt af fonde. Det er resultatet af en sofistikeret, multi-faktor kvantitativ model, der identificerer virksomheder med de højeste niveauer af institutionel akkumulering. Scoringsmodellen bruger en kombination af den samlede stigning i oplyste ejere, ændringerne i porteføljeallokeringer i disse ejere og andre målinger. Tallet går fra 0 til 100, hvor højere tal indikerer et højere niveau af akkumulering for sine jævnaldrende, og 50 er gennemsnittet.
Opdateringsfrekvens: Dagligt
Se Ownership Explorer, som giver en liste over højest rangerende virksomheder.
AI+ Ask Fintel’s AI assistant about Exchange Traded Concepts Trust - Range Nuclear Renaissance Index ETF.
Select a question to share a public post with an AI-crafted answer.
Thinking of good questions…
Institutionel Put/Call-forhold
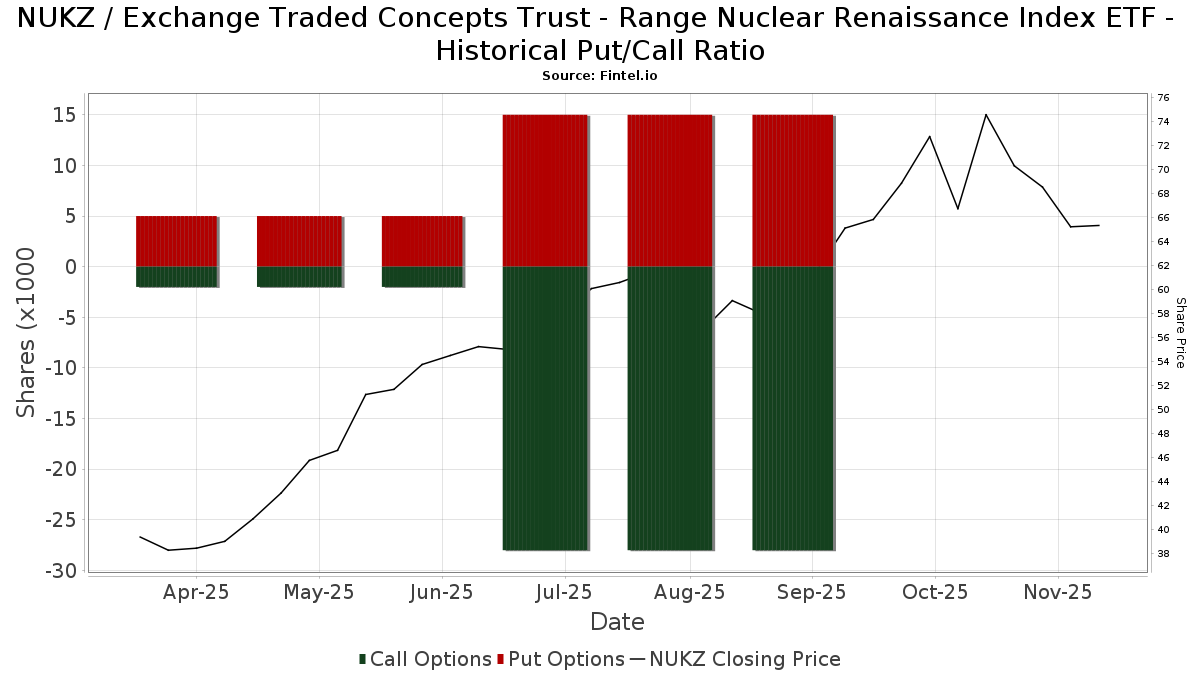
Ud over at indberette standardaktie- og gældsudstedelser skal institutter med mere end 100 mill. aktiver under forvaltning også oplyse deres put- og call-optionsbeholdninger. Da salgsoptioner generelt indikerer negativ stemning, og købsoptioner indikerer positiv stemning, kan vi få en fornemmelse af den overordnede institutionelle stemning ved at plotte forholdet mellem put og kald. Diagrammet til højre viser det historiske put/call-forhold for dette instrument.
Brug af Put/Call Ratio som en indikator for investorernes stemning overvinder en af de vigtigste mangler ved at bruge totalt institutionelt ejerskab, som er, at en betydelig mængde af aktiver under forvaltning investeres passivt for at spore indekser. Passivt forvaltede fonde køber typisk ikke optioner, så indikatoren for put/call-forholdet følger mere nøje følelsen af aktivt forvaltede fonde.
13F og NPORT arkivering
Detaljer om 13F-arkivering er gratis. Detaljer om NP-ansøgninger kræver et premium-medlemskab. Grønne rækker angiver nye positioner. Røde rækker angiver lukkede positioner. Klik på linket ikon for at se den fulde transaktionshistorik.
Opgrader
for at låse premium-data op og eksportere til Excel ![]() .
.
| Fil dato | Kilde | Investor | Type | Gennemsnitlig pris (Øst) |
Aktier | Δ Aktier (%) |
Rapporteret Værdi ($1000) |
Δ Værdi (%) |
Port Alloc (%) |
|
|---|---|---|---|---|---|---|---|---|---|---|
| 2026-04-15 | 13F | Seacrest Wealth Management, Llc | 8.646 | 3,27 | 569 | 0,71 | ||||
| 2026-02-17 | 13F | Warren Averett Asset Management, LLC | 12.687 | 6,16 | 806 | 3,60 | ||||
| 2026-02-09 | 13F | Solutions 4 Wealth, Ltd | 8.937 | 51,32 | 567 | 47,66 | ||||
| 2026-02-17 | 13F | Cetera Investment Advisers | 183.830 | 46,76 | 11.673 | 43,28 | ||||
| 2026-01-20 | 13F | SOA Wealth Advisors, LLC. | 101 | 6 | ||||||
| 2026-02-11 | 13F | Group One Trading, L.p. | 1.712 | -32,97 | 109 | -34,94 | ||||
| 2026-04-21 | 13F | Financial Consulate, Inc | 200 | 0,00 | 13 | 8,33 | ||||
| 2026-02-17 | 13F | Advisor Group Holdings, Inc. | 53.272 | 68,94 | 3.383 | 73,26 | ||||
| 2026-04-09 | 13F | PFS Partners, LLC | 143 | 9 | ||||||
| 2026-02-17 | 13F | Old Mission Capital Llc | 20.480 | 1.300 | ||||||
| 2025-11-14 | 13F | Walleye Capital LLC | 0 | -100,00 | 0 | -100,00 | ||||
| 2026-04-16 | 13F | Breakthru Advisory Services, Llc | 16.004 | -90,83 | 1.053 | -90,51 | ||||
| 2026-02-17 | 13F | Citadel Advisors Llc | Put | 34.800 | 357,89 | 2.210 | 347,17 | |||
| 2026-02-17 | 13F | Citadel Advisors Llc | 25.100 | 1.594 | ||||||
| 2025-11-04 | 13F | Thrivent Financial For Lutherans | 0 | -100,00 | 0 | |||||
| 2026-04-15 | 13F | Activest Wealth Management | 151 | 0,00 | 10 | 0,00 | ||||
| 2026-04-16 | 13F | Capital Advisors, Ltd. LLC | 4.391 | 0,00 | 0 | |||||
| 2026-04-23 | 13F | Oppenheimer & Co Inc | 21.294 | 59,26 | 1.401 | 64,90 | ||||
| 2026-02-17 | 13F | Citadel Advisors Llc | Call | 16.200 | 15,71 | 1.029 | 12,97 | |||
| 2026-02-06 | 13F | HighTower Advisors, LLC | 47.640 | 41,41 | 3.025 | 38,06 | ||||
| 2026-04-17 | 13F | Wealthbridge Capital Management, Llc | 10.640 | 3,23 | 700 | 6,88 | ||||
| 2026-02-05 | 13F | Cambridge Investment Research Advisors, Inc. | 29.683 | 38,09 | 2 | 0,00 | ||||
| 2026-02-05 | 13F | Allworth Financial LP | 27 | -90,07 | 2 | -94,12 | ||||
| 2026-02-12 | 13F | Summit Financial, LLC | 13.362 | 22,71 | 848 | 19,77 | ||||
| 2026-02-13 | 13F | Fort Point Capital Partners LLC | 10.275 | 0,00 | 724 | 8,23 | ||||
| 2026-02-03 | 13F | Cheviot Value Management, LLC | 360 | -45,86 | 26 | -45,83 | ||||
| 2026-02-17 | 13F | Susquehanna International Group, Llp | 22.762 | 68,50 | 1.445 | 64,58 | ||||
| 2026-04-16 | 13F | Rainier Family Wealth Inc | 31.477 | -4,11 | 2.070 | -0,67 | ||||
| 2026-02-13 | 13F | Colony Group, LLC | 3.577 | 227 | ||||||
| 2026-02-10 | 13F | Principia Wealth Advisory, LLC | 395 | 41,07 | 25 | 38,89 | ||||
| 2026-02-10 | 13F | Moors & Cabot, Inc. | 3.990 | 27,07 | 253 | 24,02 | ||||
| 2026-02-14 | 13F | Rockefeller Capital Management L.P. | 2.355 | 2,17 | 150 | 0,00 | ||||
| 2026-02-17 | 13F | D. E. Shaw & Co., Inc. | 5.690 | 361 | ||||||
| 2026-04-21 | 13F | Retirement Planning Group, Llc / Ny | 7.296 | 480 | ||||||
| 2026-02-12 | 13F | Wealthspire Advisors, LLC | 0 | -100,00 | 0 | |||||
| 2026-04-07 | 13F | Farther Finance Advisors, LLC | 2.348 | 63,40 | 158 | 72,53 | ||||
| 2026-01-21 | 13F | Sound Income Strategies, LLC | 1.704 | 121 | ||||||
| 2026-02-13 | 13F | Kestra Advisory Services, LLC | 0 | -100,00 | 0 | |||||
| 2026-02-13 | 13F | Pathstone Holdings, LLC | 10.067 | 11,14 | 639 | 8,49 | ||||
| 2025-11-14 | 13F | Wolverine Trading, Llc | Call | 7.500 | 491 | |||||
| 2026-02-10 | 13F | Belvedere Trading LLC | 10.061 | 639 | ||||||
| 2026-04-23 | 13F | J.w. Cole Advisors, Inc. | 0 | -100,00 | 0 | |||||
| 2026-01-26 | 13F | Cwm, Llc | 1.962 | 1,29 | 0 | |||||
| 2026-02-10 | 13F | Belvedere Trading LLC | Put | 22.600 | 1.435 | |||||
| 2026-02-17 | 13F | North Capital, Inc. | 0 | -100,00 | 0 | |||||
| 2026-02-10 | 13F | Belvedere Trading LLC | Call | 4.400 | 279 | |||||
| 2026-02-11 | 13F | First Command Advisory Services, Inc. | 160 | 0,00 | 10 | 0,00 | ||||
| 2026-02-26 | 13F | Anchor Investment Management, LLC | 250 | 0,00 | 16 | -6,25 | ||||
| 2026-02-09 | 13F | IPG Investment Advisors LLC | 4.330 | 0,00 | 275 | -2,49 | ||||
| 2026-02-17 | 13F/A | Kovack Advisors, Inc. | 18.711 | 1.188 | ||||||
| 2026-02-12 | 13F | Jane Street Group, Llc | Call | 5.800 | -12,12 | 368 | -14,22 | |||
| 2026-04-03 | 13F | Coastline Trust Co | 0 | -100,00 | 0 | |||||
| 2026-04-23 | 13F | Powell Investment Advisors, LLC | 5.600 | 0,00 | 368 | 3,66 | ||||
| 2026-02-12 | 13F | Jane Street Group, Llc | Put | 16.900 | 103,61 | 1.073 | 99,07 | |||
| 2026-02-12 | 13F | StoneX Group Inc. | 17.047 | 145,21 | 1.082 | 139,38 | ||||
| 2026-02-17 | 13F | Royal Bank Of Canada | 15.709 | -11,67 | 998 | -13,67 | ||||
| 2026-02-09 | 13F | Integrity Alliance, Llc. | 7.494 | 476 | ||||||
| 2026-02-13 | 13F | Gts Securities Llc | 0 | -100,00 | 0 | |||||
| 2026-04-17 | 13F | AdvisorNet Financial, Inc | 553 | -2,12 | 36 | 2,86 | ||||
| 2026-02-10 | 13F/A | Northwestern Mutual Wealth Management Co | 1.208 | 154,32 | 77 | 153,33 | ||||
| 2026-01-27 | 13F | WealthCollab, LLC | 824 | 0,00 | 52 | -1,89 | ||||
| 2026-01-23 | 13F | Smith, Moore & Co. | 3.538 | 225 | ||||||
| 2026-02-17 | 13F | Per Stirling Capital Management, LLC. | 0 | -100,00 | 0 | |||||
| 2026-01-09 | 13F | 180 Wealth Advisors, Llc | 4.359 | 8,22 | 277 | 5,34 | ||||
| 2026-02-17 | 13F | Advisory Services Network, LLC | 0 | -100,00 | 0 | |||||
| 2026-02-12 | 13F | Mark Sheptoff Financial Planning, Llc | 378 | 0,00 | 24 | -4,17 | ||||
| 2026-04-17 | 13F | Vermillion Wealth Management, Inc. | 700 | 0,00 | 46 | 4,55 | ||||
| 2026-02-17 | 13F | Snowden Capital Advisors LLC | 9.154 | 55,84 | 581 | 52,09 | ||||
| 2026-02-13 | 13F | Morgan Stanley | 3.233 | -93,11 | 205 | -93,28 | ||||
| 2026-04-21 | 13F | Washington Growth Strategies Llc | 14.490 | 0,00 | 953 | 3,59 | ||||
| 2026-02-12 | 13F | Compass Capital Corp /ma/ /adv | 4.564 | -21,12 | 324 | -17,77 | ||||
| 2026-04-07 | 13F | Park Avenue Securities Llc | 49.080 | 27,41 | 3 | 50,00 | ||||
| 2026-04-24 | 13F | Tcfg Wealth Management, Llc | 3.955 | 0,13 | 260 | 4,00 | ||||
| 2026-02-06 | 13F | Copia Wealth Management | 40 | 0,00 | 3 | 0,00 | ||||
| 2026-04-16 | 13F | Brookstone Capital Management | 45.396 | 2.986 | ||||||
| 2026-02-02 | 13F | Mutual Advisors, LLC | 96.290 | -0,40 | 6.114 | -7,94 | ||||
| 2026-02-17 | 13F | Creative Planning | 6.314 | 27,43 | 401 | 24,22 | ||||
| 2026-04-15 | 13F | Nations Financial Group Inc, /ia/ /adv | 18.372 | 31,33 | 1.208 | 36,04 | ||||
| 2026-02-02 | 13F | Ellis Investment Partners, LLC | 5.965 | 45,10 | 379 | 41,57 | ||||
| 2026-02-10 | 13F | REAP Financial Group, LLC | 134 | 0,00 | 9 | 0,00 | ||||
| 2026-02-06 | 13F | Global Retirement Partners, LLC | 1.179 | 135,80 | 75 | 131,25 | ||||
| 2026-02-13 | 13F | National Bank Of Canada /fi/ | 1.331 | 15,54 | 85 | 13,51 | ||||
| 2026-01-30 | 13F | Us Bancorp \de\ | 535 | 0,00 | 34 | -2,94 | ||||
| 2026-01-26 | 13F | CMC Financial Group | 13.139 | -0,08 | 834 | -2,46 | ||||
| 2026-04-24 | 13F | James Investment Research Inc | 31.807 | 30,02 | 2.092 | 34,64 | ||||
| 2026-02-12 | 13F | Bank Of Montreal /can/ | 5.720 | 363 | ||||||
| 2026-02-12 | 13F | Steward Partners Investment Advisory, Llc | 11.201 | 31,64 | 711 | 28,57 | ||||
| 2026-02-10 | 13F | Envestnet Asset Management Inc | 29.768 | 29,11 | 1.890 | 26,08 | ||||
| 2026-02-12 | 13F | Principal Securities, Inc. | 0 | -100,00 | 0 | -100,00 | ||||
| 2026-02-17 | 13F | Bank Of America Corp /de/ | 650 | -68,93 | 41 | -69,85 | ||||
| 2026-02-13 | 13F | Visionary Wealth Advisors | 23.801 | 10,00 | 1.511 | 7,39 | ||||
| 2026-04-20 | 13F | Kestra Private Wealth Services, Llc | 7.852 | 0,10 | 516 | 3,61 | ||||
| 2026-01-15 | 13F | Victory Financial Group, Llc | 6.507 | 413 | ||||||
| 2025-11-18 | 13F | Marathon Asset Management Lp | 0 | -100,00 | 0 | |||||
| 2026-01-28 | 13F | N.E.W. Advisory Services LLC | 202 | 13 | ||||||
| 2026-02-11 | 13F | Parallel Advisors, LLC | 696 | 16,58 | 44 | 15,79 | ||||
| 2026-01-28 | 13F | Fischer Investment Strategies, Llc | 76.114 | -2,31 | 4.833 | -4,62 | ||||
| 2026-02-09 | 13F | Kingsview Wealth Management, LLC | 0 | -100,00 | 0 | -100,00 | ||||
| 2026-02-13 | 13F | Financial Sense Advisors, Inc. | 12.045 | -62,66 | 765 | -63,57 | ||||
| 2026-02-12 | 13F | Jane Street Group, Llc | 16.069 | 316,94 | 1.020 | 308,00 | ||||
| 2026-04-02 | 13F | Silverleafe Capital Partners, LLC | 141.334 | 1,05 | 9.296 | 4,66 | ||||
| 2026-04-10 | 13F | Abound Wealth Management | 34 | 0,00 | 2 | 0,00 | ||||
| 2026-01-22 | 13F | Accordant Advisory Group Inc | 2.065 | 5,95 | 131 | 3,97 | ||||
| 2026-02-13 | 13F | Smartleaf Asset Management LLC | 800 | 51 | ||||||
| 2026-04-15 | 13F | Client 1st Advisory Group, Llc | 5.172 | 0,00 | 340 | 3,66 | ||||
| 2026-01-27 | 13F | Institute for Wealth Management, LLC. | 9.073 | 0,93 | 576 | -1,37 | ||||
| 2025-12-16 | 13F | Lindenwold Advisors | 6.553 | 426 | ||||||
| 2026-02-06 | 13F | Pnc Financial Services Group, Inc. | 6.495 | 130,32 | 412 | 125,14 | ||||
| 2026-02-17 | 13F | Raymond James Financial Inc | 65.985 | 15,90 | 4.190 | 13,18 | ||||
| 2026-04-09 | 13F | Herbst Group, Llc | 48.481 | -7,66 | 3.189 | -4,35 | ||||
| 2026-02-10 | 13F | Operose Advisors LLC | 384 | 0,00 | 24 | 0,00 | ||||
| 2026-02-06 | 13F | Axxcess Wealth Management, Llc | 21.143 | 6,10 | 1.343 | 3,55 | ||||
| 2026-02-10 | 13F | Calton & Associates, Inc. | 3.213 | 204 | ||||||
| 2026-04-08 | 13F | Accel Wealth Management | 18.343 | 15,23 | 1.206 | 19,41 | ||||
| 2026-02-06 | 13F | EverSource Wealth Advisors, LLC | 786 | 346,59 | 50 | 345,45 | ||||
| 2026-04-10 | 13F | Financial Partners Group, Inc | 21.075 | -3,85 | 1.386 | -8,88 | ||||
| 2026-04-15 | 13F | Financial Management Professionals, Inc. | 50 | 0,00 | 3 | 0,00 | ||||
| 2026-04-07 | 13F | Signaturefd, Llc | 23 | 0,00 | 2 | 0,00 | ||||
| 2026-04-22 | 13F | Apollon Wealth Management, LLC | 10.678 | -7,33 | 702 | -3,97 | ||||
| 2026-02-13 | 13F | Pinnacle Wealth Planning Services, Inc. | 45 | 3 | ||||||
| 2026-02-13 | 13F | Mml Investors Services, Llc | 45.728 | -1,68 | 2.904 | -4,03 | ||||
| 2026-02-04 | 13F | BCJ Capital Management, LLC | 31.994 | 2.032 | ||||||
| 2026-02-17 | 13F | Ancora Advisors, LLC | 250 | 0,00 | 16 | -6,25 | ||||
| 2026-04-15 | 13F | Compagnie Lombard Odier SCmA | 0 | -100,00 | 0 | |||||
| 2026-02-11 | 13F | Capital Analysts, Inc. | 0 | -100,00 | 0 | |||||
| 2025-11-10 | 13F | Lion Street Advisors, LLC | 0 | -100,00 | 0 | |||||
| 2025-11-06 | 13F | Ameritas Advisory Services, LLC | 0 | -100,00 | 0 | -100,00 | ||||
| 2026-02-12 | 13F | CIBC Private Wealth Group, LLC | 1.367 | 60,07 | 87 | 56,36 | ||||
| 2026-02-02 | 13F | Truist Financial Corp | 8.258 | 5,51 | 524 | 2,95 | ||||
| 2026-02-13 | 13F | Wells Fargo & Company/mn | 130 | 0,00 | 8 | 0,00 | ||||
| 2026-04-14 | 13F | Prospera Financial Services Inc | 14.462 | 5,89 | 951 | 9,69 | ||||
| 2026-04-14 | 13F | Tradewinds Capital Management, LLC | 10 | 0,00 | 1 | |||||
| 2026-04-15 | 13F | Consolidated Capital Management, Llc | 0 | -100,00 | 0 | |||||
| 2026-02-13 | 13F | Change Path, LLC | 4.047 | 5,28 | 257 | 2,40 | ||||
| 2026-02-19 | 13F | CI Private Wealth, LLC | 5.456 | 0,37 | 346 | -1,98 | ||||
| 2026-02-12 | 13F | Commonwealth Equity Services, Llc | 52.461 | 7,54 | 3.331 | 110.933,33 | ||||
| 2026-02-18 | 13F | GWM Advisors LLC | 12.127 | 7,27 | 770 | 4,76 | ||||
| 2026-04-20 | 13F | Banque Cantonale Vaudoise | 6.711 | -14,98 | 441 | -11,98 | ||||
| 2026-01-26 | 13F | Main Street Group, LTD | 41.445 | 33,40 | 2.632 | 30,25 | ||||
| 2026-02-11 | 13F | Ameritas Investment Partners, Inc. | 801 | 0,12 | 51 | -3,85 | ||||
| 2026-02-09 | 13F | Hartland & Co., LLC | 14 | 1 | ||||||
| 2026-02-12 | 13F | Federation des caisses Desjardins du Quebec | 540 | 0,00 | 34 | -2,86 | ||||
| 2026-04-08 | 13F | Wealth Enhancement Advisory Services, Llc | 7.633 | 3,18 | 511 | 1,79 | ||||
| 2026-02-11 | 13F | Manchester Capital Management LLC | 500 | 32 | ||||||
| 2026-02-02 | 13F | Benjamin Edwards Inc | 3.649 | 11,83 | 232 | 8,96 | ||||
| 2026-04-23 | 13F | Midwest Financial Partners Investments, Inc. | 26.211 | 8,81 | 1.724 | 12,69 | ||||
| 2025-11-12 | 13F | Ameriflex Group, Inc. | 0 | -100,00 | 0 | |||||
| 2026-02-13 | 13F | Umb Bank N A/mo | 4.442 | 0,00 | 282 | -2,08 | ||||
| 2026-04-14 | 13F | Nbc Securities, Inc. | 575 | 0,00 | 38 | 2,78 | ||||
| 2026-01-12 | 13F | Rialto Wealth Management, LLC | 145 | 9 | ||||||
| 2026-01-23 | 13F | HBW Advisory Services LLC | 69.852 | 59,92 | 4.436 | 56,16 | ||||
| 2026-01-27 | 13F | TD Waterhouse Canada Inc. | 1.640 | 241,67 | 104 | 235,48 | ||||
| 2026-01-13 | 13F | Dakota Wealth Management | 13.052 | 829 | ||||||
| 2026-01-29 | 13F | Almanack Investment Partners, LLC. | 6.035 | 0,00 | 383 | -2,30 | ||||
| 2026-02-04 | 13F | Biltmore Family Office, LLC | 252 | 129,09 | 16 | 128,57 | ||||
| 2026-02-09 | 13F | Huntington National Bank | 19 | 0,00 | ||||||
| 2026-04-07 | 13F | CoreCap Advisors, LLC | 802 | -97,63 | 53 | -97,58 | ||||
| 2026-02-13 | 13F | Stifel Financial Corp | 14.070 | 30,16 | 893 | 27,03 | ||||
| 2026-02-12 | 13F | Triumph Capital Management | 100 | 0,00 | 6 | 0,00 | ||||
| 2026-02-17 | 13F | Fmr Llc | 170 | -30,61 | 11 | -33,33 | ||||
| 2026-04-13 | 13F | IFP Advisors, Inc | 1.021 | 32,43 | 67 | 39,58 | ||||
| 2026-04-20 | 13F | Hilton Head Capital Partners, LLC | 0 | -100,00 | 0 | |||||
| 2026-04-03 | 13F | Adirondack Trust Co | 220 | 0,00 | 14 | 7,69 | ||||
| 2026-02-05 | 13F | Tucker Asset Management Llc | 462 | 29 | ||||||
| 2026-02-13 | 13F | Centaurus Financial, Inc. | 8.711 | -39,17 | 1 | |||||
| 2026-04-17 | 13F | IFC & Insurance Marketing, Inc. | 0 | -100,00 | 0 | |||||
| 2026-02-04 | 13F | Anson Capital, Inc. | 4.013 | 0,00 | 255 | -2,68 | ||||
| 2026-04-24 | 13F | Essex Financial Services, Inc. | 15.881 | 0,37 | 1.044 | 3,98 | ||||
| 2026-04-21 | 13F | OneAscent Financial Services LLC | 17.939 | 25,55 | 1.180 | 29,99 | ||||
| 2026-01-26 | 13F | AE Wealth Management LLC | 409 | 26 | ||||||
| 2026-04-17 | 13F | HHM Wealth Advisors, LLC | 7.166 | 59,14 | 471 | 65,26 | ||||
| 2026-01-22 | 13F | Glass Jacobson Investment Advisors llc | 0 | -100,00 | 0 | |||||
| 2026-04-23 | 13F | Game Plan Financial Advisors, LLC | 500 | 33 | ||||||
| 2026-01-29 | 13F | UBS Group AG | 27.706 | 148,91 | 1.759 | 143,29 | ||||
| 2026-04-20 | 13F | Fiduciary Alliance LLC | 57.724 | 10,49 | 4.160 | 25,41 | ||||
| 2026-02-09 | 13F | Harbour Investments, Inc. | 1.906 | 1,44 | 121 | -0,82 | ||||
| 2026-04-02 | 13F | Somerset Trust Co | 14.253 | 11,53 | 937 | 15,54 | ||||
| 2026-02-10 | 13F | Black Swift Group, LLC | 0 | -100,00 | 0 | |||||
| 2026-02-14 | 13F | POM Investment Strategies, LLC | 1.187 | 0,00 | 75 | -2,60 | ||||
| 2026-04-20 | 13F | SILVER OAK SECURITIES, Inc | 8.646 | 48,17 | 569 | 52,28 | ||||
| 2026-02-13 | 13F | Arete Wealth Advisors, LLC | 4.175 | 12,08 | 0 | |||||
| 2026-04-22 | 13F | Janney Montgomery Scott LLC | 5.736 | 9,07 | 0 | |||||
| 2026-02-11 | 13F | Simplex Trading, Llc | 0 | -100,00 | 0 | |||||
| 2026-04-24 | 13F | FRG Family Wealth Advisors LLC | 5.310 | 0,00 | 349 | 3,56 | ||||
| 2026-02-12 | 13F | Brinker Capital Investments, LLC | 12.827 | 48,13 | 814 | 44,58 | ||||
| 2026-02-12 | 13F | Resurgent Financial Advisors LLC | 8.953 | 17,49 | 569 | 14,75 |