Grundlæggende statistik
| Institutionelle ejere | 114 total, 114 long only, 0 short only, 0 long/short - change of 22,58% MRQ |
| Gennemsnitlig porteføljeallokering | 0.4733 % - change of 14,30% MRQ |
| Institutionelle aktier (lange) | 16.590.970 (ex 13D/G) - change of 5,91MM shares 55,27% MRQ |
| Institutionel værdi (lang) | $ 1.553.251 USD ($1000) |
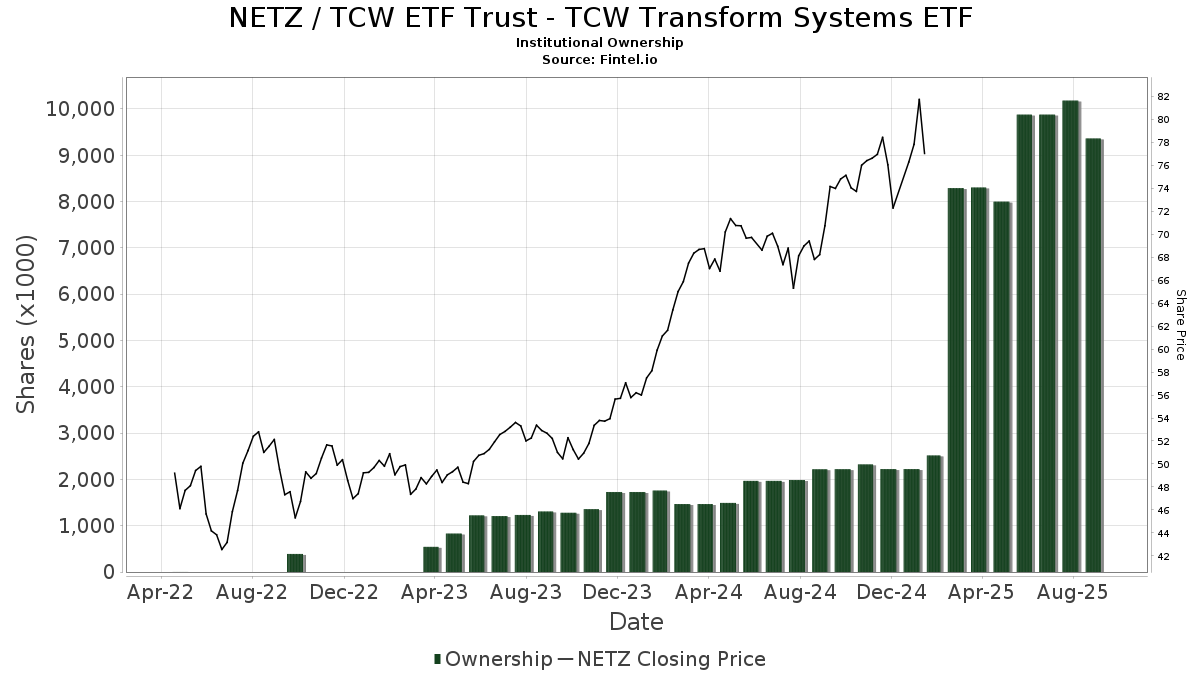
Institutionelt ejerskab og aktionærer
TCW ETF Trust - TCW Transform Systems ETF (US:NETZ) har 114 institutionelle ejere og aktionærer, der har indsendt 13D/G- eller 13F-formularer til Securities Exchange Commission (SEC). Disse institutioner har i alt 16,590,970 aktier. Største aktionærer omfatter Dynasty Wealth Management, Llc, Jpmorgan Chase & Co, Sagespring Wealth Partners, Llc, OpenArc Corporate Advisory, LLC, Quotient Wealth Partners, LLC, WCG Wealth Advisors LLC, LPL Financial LLC, Raymond James Financial Inc, Unique Wealth, Llc, and Valence8 US LP .
TCW ETF Trust - TCW Transform Systems ETF (NYSE:NETZ) institutionel ejerskabsstruktur viser aktuelle positioner i virksomheden efter institutioner og fonde, samt seneste ændringer i positionsstørrelse. Større aktionærer kan omfatte individuelle investorer, investeringsforeninger, hedgefonde eller institutioner. Skema 13D angiver, at investoren besidder (eller besidder) mere end 5 % af virksomheden og har til hensigt (eller har til hensigt at) aktivt at forfølge en ændring i forretningsstrategi. Skema 13G indikerer en passiv investering på over 5%.
Fondens stemningsscore
Fund Sentiment Score (fka Ownership Accumulation Score) finder de aktier, der bliver mest købt af fonde. Det er resultatet af en sofistikeret, multi-faktor kvantitativ model, der identificerer virksomheder med de højeste niveauer af institutionel akkumulering. Scoringsmodellen bruger en kombination af den samlede stigning i oplyste ejere, ændringerne i porteføljeallokeringer i disse ejere og andre målinger. Tallet går fra 0 til 100, hvor højere tal indikerer et højere niveau af akkumulering for sine jævnaldrende, og 50 er gennemsnittet.
Opdateringsfrekvens: Dagligt
Se Ownership Explorer, som giver en liste over højest rangerende virksomheder.
AI+ Ask Fintel’s AI assistant about TCW ETF Trust - TCW Transform Systems ETF.
Select a question to share a public post with an AI-crafted answer.
Thinking of good questions…
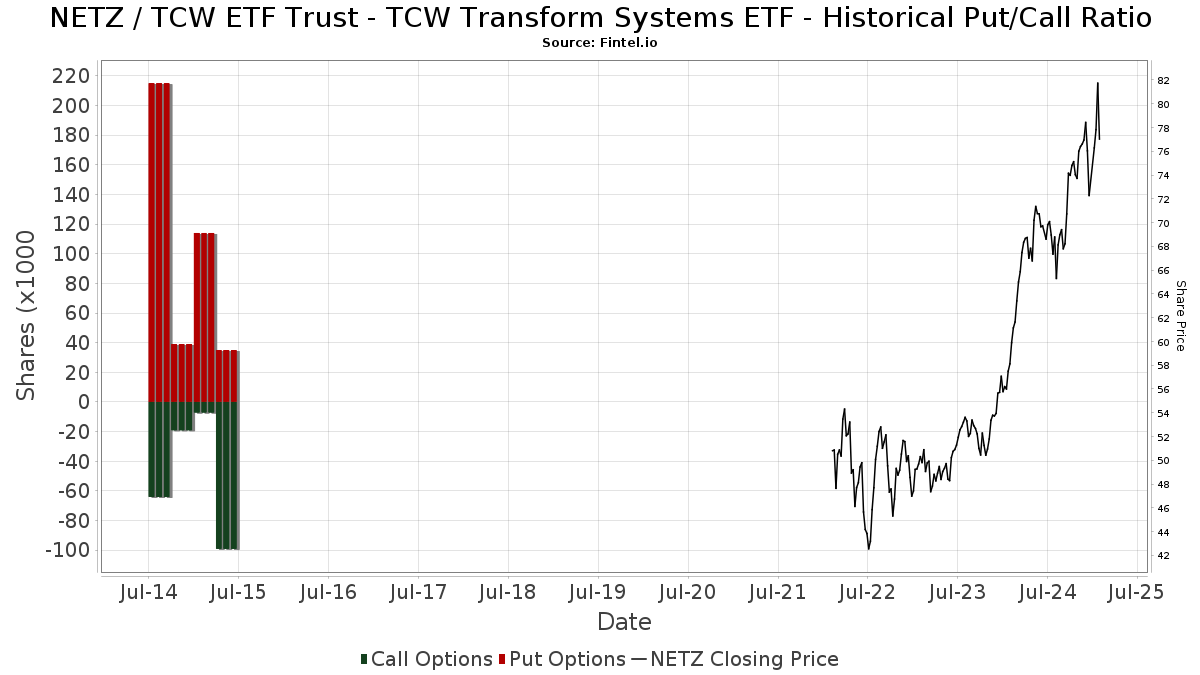
Institutionel Put/Call-forhold
Ud over at indberette standardaktie- og gældsudstedelser skal institutter med mere end 100 mill. aktiver under forvaltning også oplyse deres put- og call-optionsbeholdninger. Da salgsoptioner generelt indikerer negativ stemning, og købsoptioner indikerer positiv stemning, kan vi få en fornemmelse af den overordnede institutionelle stemning ved at plotte forholdet mellem put og kald. Diagrammet til højre viser det historiske put/call-forhold for dette instrument.
Brug af Put/Call Ratio som en indikator for investorernes stemning overvinder en af de vigtigste mangler ved at bruge totalt institutionelt ejerskab, som er, at en betydelig mængde af aktiver under forvaltning investeres passivt for at spore indekser. Passivt forvaltede fonde køber typisk ikke optioner, så indikatoren for put/call-forholdet følger mere nøje følelsen af aktivt forvaltede fonde.
13F og NPORT arkivering
Detaljer om 13F-arkivering er gratis. Detaljer om NP-ansøgninger kræver et premium-medlemskab. Grønne rækker angiver nye positioner. Røde rækker angiver lukkede positioner. Klik på linket ikon for at se den fulde transaktionshistorik.
Opgrader
for at låse premium-data op og eksportere til Excel ![]() .
.
| Fil dato | Kilde | Investor | Type | Gennemsnitlig pris (Øst) |
Aktier | Δ Aktier (%) |
Rapporteret Værdi ($1000) |
Δ Værdi (%) |
Port Alloc (%) |
|
|---|---|---|---|---|---|---|---|---|---|---|
| 2026-02-17 | 13F | Tcw Group Inc | 28.822 | 182,07 | 2.771 | 177,66 | ||||
| 2026-02-12 | 13F | Jane Street Group, Llc | 14.387 | -31,48 | 1.383 | -32,57 | ||||
| 2026-01-20 | 13F | Aspiriant, Llc | 147.079 | 3,01 | 14.142 | 1,39 | ||||
| 2026-01-21 | 13F | Signature Resources Capital Management, LLC | 126 | 0,00 | 12 | 0,00 | ||||
| 2026-02-13 | 13F | Mariner, LLC | 124.014 | 11.925 | ||||||
| 2026-02-04 | 13F | Bridgewealth Advisory Group, LLC | 19.598 | 1.884 | ||||||
| 2026-01-28 | 13F | Geneos Wealth Management Inc. | 7.304 | 0,62 | 702 | -0,99 | ||||
| 2026-02-02 | 13F | KPP Advisory Services LLC | 10.855 | 17,63 | 1.044 | 15,76 | ||||
| 2026-01-29 | 13F | UBS Group AG | 1.296 | 125 | ||||||
| 2026-04-13 | 13F | IFP Advisors, Inc | 213 | 21 | ||||||
| 2026-02-13 | 13F | Golden State Wealth Management, LLC | 870 | 84 | ||||||
| 2026-02-12 | 13F | Brinker Capital Investments, LLC | 29.636 | -7,34 | 2.850 | -8,80 | ||||
| 2026-02-17 | 13F | Susquehanna International Group, Llp | 15.087 | -73,60 | 1.451 | -74,03 | ||||
| 2026-01-16 | 13F | Ronald Blue Trust, Inc. | 107 | 10 | ||||||
| 2025-11-12 | 13F | Napa Wealth Management | 10.230 | 15,31 | 999 | 25,03 | ||||
| 2026-04-15 | 13F | DecisionMap Wealth Management, LLC | 18.308 | 29,53 | 1.790 | 31,64 | ||||
| 2026-02-04 | 13F | Advisor OS, LLC | 3.629 | 349 | ||||||
| 2025-10-24 | 13F | Bristlecone Advisors, LLC | 9.602 | 13,81 | 938 | 23,42 | ||||
| 2026-02-04 | 13F | Atlantic Union Bankshares Corp | 3.000 | 0,00 | 288 | -1,71 | ||||
| 2026-01-29 | 13F | Comerica Bank | 808 | 0,00 | 78 | -1,28 | ||||
| 2026-04-13 | 13F | Cyndeo Wealth Partners, LLC | 50.975 | 2,17 | 4.984 | 3,88 | ||||
| 2026-04-15 | 13F | Signature Estate & Investment Advisors Llc | 2.073 | 203 | ||||||
| 2026-02-13 | 13F | Morgan Stanley | 1.042 | 2,06 | 100 | 1,01 | ||||
| 2026-02-05 | 13F | Atria Investments Llc | 2.601 | 250 | ||||||
| 2026-02-12 | 13F | Litman Gregory Asset Management LLC | 253 | 24 | ||||||
| 2026-02-05 | 13F | Thrivent Financial For Lutherans | 80.845 | -7,02 | 8 | -12,50 | ||||
| 2026-02-13 | 13F | MAI Capital Management | 2.531 | 0,00 | 243 | -1,62 | ||||
| 2026-01-28 | 13F | REDW Wealth LLC | 3.337 | 0,00 | 321 | -1,54 | ||||
| 2026-02-06 | 13F | Principle Wealth Partners Llc | 47.977 | 237,63 | 4.613 | 232,35 | ||||
| 2026-02-17 | 13F | Royal Bank Of Canada | 7.422 | 73,90 | 714 | 71,22 | ||||
| 2026-04-08 | 13F | First Heartland Consultants, Inc. | 9.155 | -12,66 | 895 | -11,12 | ||||
| 2026-01-14 | 13F | Fairvoy Private Wealth, LLC | 9.994 | -13,77 | 961 | -15,19 | ||||
| 2026-04-16 | 13F | Diversified Trust Co | 0 | -100,00 | 0 | |||||
| 2026-03-27 | 13F | rebel Financial LLC | 5.785 | 556 | 0,00 | |||||
| 2026-02-03 | 13F | SFG Wealth Management, LLC. | 20.891 | -5,24 | 2.009 | -6,73 | ||||
| 2026-04-14 | 13F | Centerline Wealth Advisors, LLC | 150.166 | -0,22 | 14.681 | 1,45 | ||||
| 2026-02-10 | 13F/A | Northwestern Mutual Wealth Management Co | 4.955 | 476 | ||||||
| 2026-02-19 | 13F | Rare Wolf Capital LLC | 3.450 | 332 | ||||||
| 2026-04-01 | 13F | Financial Insights, Inc. | 21.963 | 171,85 | 2.112 | 189,97 | ||||
| 2026-02-10 | 13F | Tidemark, LLC | 236 | 0,00 | 23 | -4,35 | ||||
| 2026-04-02 | 13F | Cassady Wealth & Retirement Planning, LLC | 24.065 | 2.314 | ||||||
| 2026-04-07 | 13F | CoreCap Advisors, LLC | 1 | 0,00 | 0 | |||||
| 2026-02-13 | 13F | Becker Capital Management Inc | 7.976 | 0,00 | 767 | -1,67 | ||||
| 2026-04-13 | 13F | Mather Group, Llc. | 10.557 | 1.032 | ||||||
| 2026-02-04 | 13F | Sloy Dahl & Holst, LLC | 17.395 | 8,55 | 1.673 | 6,84 | ||||
| 2026-02-02 | 13F | Millstone Evans Group, LLC | 10.889 | -1,40 | 1.047 | -2,88 | ||||
| 2026-04-07 | 13F | Mb, Levis & Associates, Llc | 25 | -50,00 | 2 | -50,00 | ||||
| 2026-02-12 | 13F | Commonwealth Equity Services, Llc | 29.298 | 305,85 | 2.817 | |||||
| 2026-01-21 | 13F | Albion Financial Group /ut | 72.572 | -1,37 | 6.978 | -2,92 | ||||
| 2026-02-11 | 13F | Gateway Wealth Partners, LLC | 2.880 | 277 | ||||||
| 2026-02-11 | 13F | Jpmorgan Chase & Co | 3.029.797 | 18,86 | 291.332 | 16,99 | ||||
| 2026-01-07 | 13F | Sagespring Wealth Partners, Llc | 2.352.369 | -11,55 | 192.889 | -14,64 | ||||
| 2026-02-04 | 13F | Tsfg, Llc | 20.578 | -50,50 | 2 | -75,00 | ||||
| 2026-02-05 | 13F | Cambridge Investment Research Advisors, Inc. | 6.482 | -21,33 | 1 | |||||
| 2026-01-29 | 13F | Quadcap Wealth Management, LLC | 86.225 | 12,82 | 8.298 | 11,14 | ||||
| 2026-02-10 | 13F | One Capital Management, LLC | 5.903 | 113,18 | 568 | 110,00 | ||||
| 2026-02-13 | 13F | TritonPoint Partners, LLC | 13.445 | 1.293 | ||||||
| 2026-04-16 | 13F | Quotient Wealth Partners, LLC | 933.031 | 41,03 | 91.219 | 43,39 | ||||
| 2025-11-10 | 13F | Vestmark Advisory Solutions, Inc. | 0 | -100,00 | 0 | |||||
| 2025-11-04 | 13F | Jones Financial Companies Lllp | 0 | -100,00 | 0 | |||||
| 2026-02-10 | 13F | SCS Capital Management LLC | 3.073 | 0,00 | 295 | -1,67 | ||||
| 2026-02-13 | 13F | Visionary Wealth Advisors | 9.403 | 11,13 | 904 | 9,44 | ||||
| 2026-02-13 | 13F | Partners Capital Investment Group, Llp | 105.340 | 0,00 | 10.129 | -1,56 | ||||
| 2026-02-17 | 13F | Bank Of America Corp /de/ | 35.683 | 3.431 | ||||||
| 2026-04-08 | 13F | Roberts Wealth Advisors, LLC | 4.544 | 0,00 | 444 | 1,83 | ||||
| 2026-02-17 | 13F | Advisor Group Holdings, Inc. | 2.365 | 93,69 | 227 | 92,37 | ||||
| 2026-02-09 | 13F | Valence8 US LP | 164.850 | 15.851 | ||||||
| 2026-01-26 | 13F | Key Capital Management, INC | 317 | 30 | ||||||
| 2026-02-17 | 13F | Warren Averett Asset Management, LLC | 3.175 | 305 | ||||||
| 2026-01-06 | 13F | Unique Wealth, Llc | 167.324 | -8,56 | 16.089 | -9,99 | ||||
| 2026-02-12 | 13F | Triumph Capital Management | 698 | -10,97 | 67 | -11,84 | ||||
| 2026-02-13 | 13F | OpenArc Corporate Advisory, LLC | 1.670.423 | 160.621 | ||||||
| 2026-02-17 | 13F | Private Advisor Group, LLC | 4.844 | 466 | ||||||
| 2026-02-09 | 13F | Keating Financial Advisory Services, Inc. | 1.142 | 110 | ||||||
| 2026-02-11 | 13F | TCTC Holdings, LLC | 1 | 0,00 | 0 | |||||
| 2026-02-17 | 13F | Raymond James Financial Inc | 254.799 | 12,15 | 24.500 | 10,39 | ||||
| 2026-02-13 | 13F | Venture Visionary Partners LLC | 81.665 | 1,68 | 7.885 | 0,48 | ||||
| 2026-02-06 | 13F | HighTower Advisors, LLC | 3.231 | 17,66 | 311 | 15,67 | ||||
| 2026-02-12 | 13F | Steward Partners Investment Advisory, Llc | 19.912 | 40,78 | 1.915 | 38,60 | ||||
| 2026-02-04 | 13F | WealthTrust Asset Management, LLC | 2.239 | 0,00 | 215 | -1,38 | ||||
| 2026-01-13 | 13F | Dakota Wealth Management | 12.903 | 1.241 | ||||||
| 2026-01-12 | 13F | PUREfi Wealth, LLC | 8.536 | -11,99 | 821 | -13,41 | ||||
| 2026-01-23 | 13F | TFC Financial Management | 17.291 | 0,00 | 1.663 | -1,60 | ||||
| 2026-02-06 | 13F | 3EDGE Asset Management, LP | 23.101 | -0,82 | 2.221 | -2,37 | ||||
| 2026-04-17 | 13F | Capital Wealth Management, Llc | 15.143 | 10,64 | 1.480 | 12,46 | ||||
| 2025-12-16 | 13F | Lindenwold Advisors | 5.756 | 562 | ||||||
| 2026-01-08 | 13F | Traveka Wealth, LLC | 6.874 | 58,20 | 661 | 55,66 | ||||
| 2026-02-03 | 13F | We Are One Seven, LLC | 10.898 | 0,85 | 1.048 | -0,76 | ||||
| 2026-02-11 | 13F | LPL Financial LLC | 335.429 | 44,30 | 32.253 | 42,03 | ||||
| 2026-02-12 | 13F | Principal Securities, Inc. | 0 | -100,00 | 0 | |||||
| 2026-01-27 | 13F | Atlantic Edge Private Wealth Management, LLC | 50 | 0,00 | 5 | 0,00 | ||||
| 2026-01-26 | 13F | Private Trust Co Na | 340 | 0,00 | 33 | -3,03 | ||||
| 2026-02-10 | 13F | WCG Wealth Advisors LLC | 359.839 | 192,87 | 34.601 | 188,29 | ||||
| 2026-02-10 | 13F | David R. Rahn & Associates Inc. | 71.735 | 2,30 | 6.898 | 0,69 | ||||
| 2026-02-10 | 13F | Lido Advisors, LLC | 12.541 | 0,00 | 1.225 | 0,00 | ||||
| 2026-02-13 | 13F | Financial Network Wealth Advisors LLC | 105 | 337,50 | 10 | 400,00 | ||||
| 2026-01-21 | 13F | Portside Wealth Group, LLC | 13.056 | 5,27 | 1.255 | 3,63 | ||||
| 2026-01-23 | 13F | Financial Connections Group, Inc. | 61 | 0,00 | 0 | |||||
| 2026-04-07 | 13F | Financially Speaking Inc | 552 | 0,00 | 54 | 0,00 | ||||
| 2026-02-17 | 13F | Argyle Capital Partners, LLC | 3.196 | 0,00 | 307 | -1,60 | ||||
| 2025-11-14 | 13F | Gts Securities Llc | 0 | -100,00 | 0 | -100,00 | ||||
| 2026-01-23 | 13F | Bellevue Asset Management, Llc | 21.332 | 2,35 | 2.050 | 0,64 | ||||
| 2026-02-10 | 13F | Godfrey Financial Associates, Inc. | 66 | 6 | ||||||
| 2026-02-13 | 13F | Wells Fargo & Company/mn | 50 | 5 | ||||||
| 2026-01-30 | 13F | Financial Services Advisory Inc | 0 | -100,00 | 0 | |||||
| 2026-01-29 | 13F | Golden State Equity Partners | 8.450 | 70,71 | 813 | 68,12 | ||||
| 2026-01-30 | 13F | Smart Portfolios, LLC | 27.370 | 11,24 | 2.632 | 9,49 | ||||
| 2026-02-19 | 13F | CI Private Wealth, LLC | 13.695 | 270,34 | 1.317 | 264,54 | ||||
| 2026-02-09 | 13F | Harbour Investments, Inc. | 329 | 0,00 | 32 | -3,12 | ||||
| 2026-02-17 | 13F | Wiley Bros.-aintree Capital, Llc | 4.943 | 3,67 | 475 | 2,15 | ||||
| 2026-02-05 | 13F | WJ Wealth Management, LLC | 71.101 | 0,25 | 6.837 | -5,81 | ||||
| 2026-02-10 | 13F | Adapt Wealth Advisors, Llc | 56.077 | 9,11 | 5.392 | 7,41 | ||||
| 2026-01-28 | 13F | Trademark Financial Management, LLC | 8.306 | 24,64 | 799 | 22,58 | ||||
| 2026-02-10 | 13F | Envestnet Asset Management Inc | 6.155 | -91,84 | 592 | -91,97 | ||||
| 2026-02-09 | 13F | Leavell Investment Management, Inc. | 2.474 | 238 | ||||||
| 2026-02-11 | 13F | Janney Montgomery Scott LLC | 3.707 | 7,23 | 0 | |||||
| 2026-02-12 | 13F | Ankerstar Wealth, LLC | 2 | 0 | ||||||
| 2026-02-10 | 13F | Dynasty Wealth Management, Llc | 5.303.116 | 63,60 | 509.927 | 61,03 | ||||
| 2026-02-13 | 13F | Stifel Financial Corp | 18.633 | 366,06 | 1.792 | 359,23 | ||||
| 2026-01-07 | 13F | Procyon Private Wealth Partners, LLC | 118.620 | 2,07 | 11.406 | 0,48 | ||||
| 2026-02-13 | 13F | Flow Traders U.s. Llc | 0 | -100,00 | 0 |
Other Listings
| US:PWRD | 109,34 $ |