Grundlæggende statistik
| Institutionelle aktier (lange) | 73.169.010 - 81,73% (ex 13D/G) - change of -17,44MM shares -19,25% MRQ |
| Institutionel værdi (lang) | $ 1.230.408 USD ($1000) |
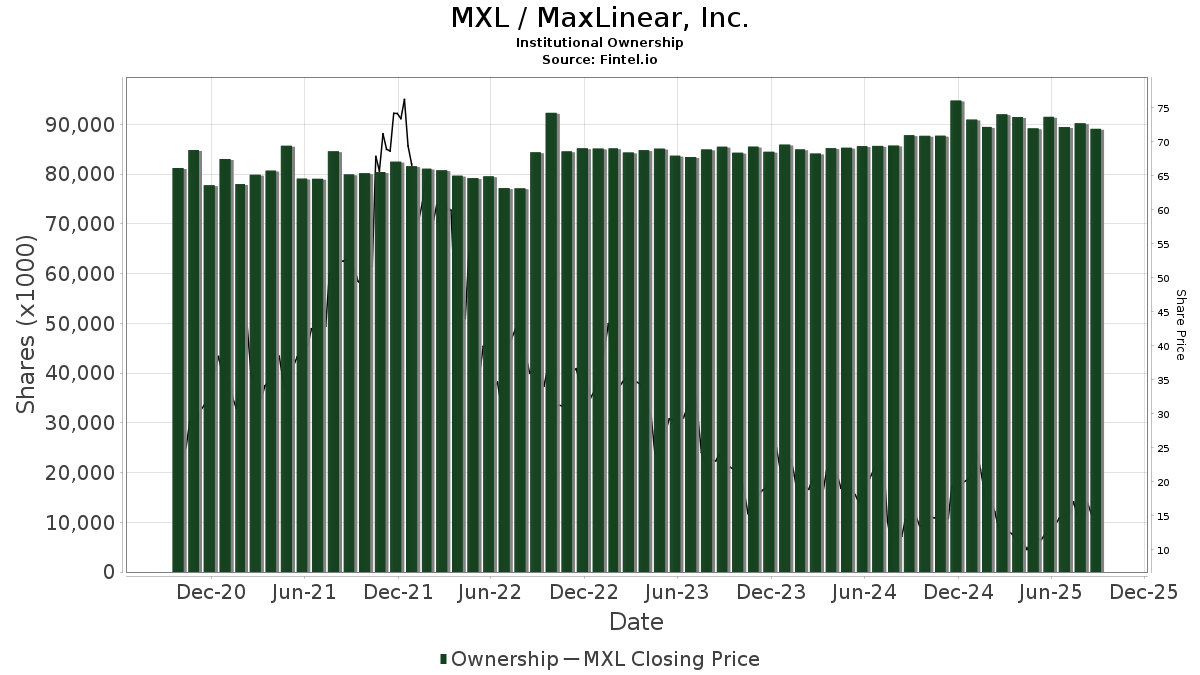
Institutionelt ejerskab og aktionærer
MaxLinear, Inc. (US:MXL) har 253 institutionelle ejere og aktionærer, der har indsendt 13D/G- eller 13F-formularer til Securities Exchange Commission (SEC). Disse institutioner har i alt 73,169,010 aktier. Største aktionærer omfatter BlackRock, Inc., Vanguard Group Inc, Fmr Llc, State Street Corp, Invesco Ltd., Goldman Sachs Group Inc, Geode Capital Management, Llc, Dimensional Fund Advisors Lp, Marshall Wace, Llp, and Morgan Stanley .
MaxLinear, Inc. (NasdaqGS:MXL) institutionel ejerskabsstruktur viser aktuelle positioner i virksomheden efter institutioner og fonde, samt seneste ændringer i positionsstørrelse. Større aktionærer kan omfatte individuelle investorer, investeringsforeninger, hedgefonde eller institutioner. Skema 13D angiver, at investoren besidder (eller besidder) mere end 5 % af virksomheden og har til hensigt (eller har til hensigt at) aktivt at forfølge en ændring i forretningsstrategi. Skema 13G indikerer en passiv investering på over 5%.
The share price as of April 14, 2026 is 21,56 / share. Previously, on April 15, 2025, the share price was 10,43 / share. This represents an increase of 106,71% over that period.
Fondens stemningsscore
Fund Sentiment Score (fka Ownership Accumulation Score) finder de aktier, der bliver mest købt af fonde. Det er resultatet af en sofistikeret, multi-faktor kvantitativ model, der identificerer virksomheder med de højeste niveauer af institutionel akkumulering. Scoringsmodellen bruger en kombination af den samlede stigning i oplyste ejere, ændringerne i porteføljeallokeringer i disse ejere og andre målinger. Tallet går fra 0 til 100, hvor højere tal indikerer et højere niveau af akkumulering for sine jævnaldrende, og 50 er gennemsnittet.
Opdateringsfrekvens: Dagligt
Se Ownership Explorer, som giver en liste over højest rangerende virksomheder.
AI+ Ask Fintel’s AI assistant about MaxLinear, Inc..
Select a question to share a public post with an AI-crafted answer.
Thinking of good questions…
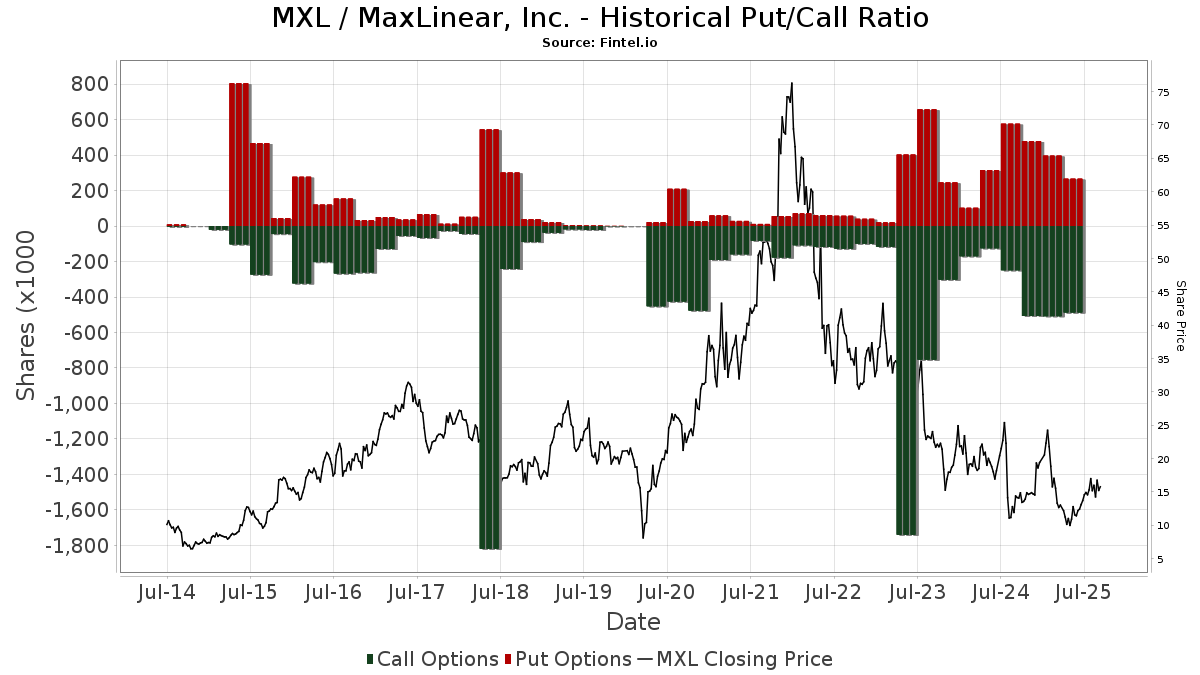
Institutionel Put/Call-forhold
Ud over at indberette standardaktie- og gældsudstedelser skal institutter med mere end 100 mill. aktiver under forvaltning også oplyse deres put- og call-optionsbeholdninger. Da salgsoptioner generelt indikerer negativ stemning, og købsoptioner indikerer positiv stemning, kan vi få en fornemmelse af den overordnede institutionelle stemning ved at plotte forholdet mellem put og kald. Diagrammet til højre viser det historiske put/call-forhold for dette instrument.
Brug af Put/Call Ratio som en indikator for investorernes stemning overvinder en af de vigtigste mangler ved at bruge totalt institutionelt ejerskab, som er, at en betydelig mængde af aktiver under forvaltning investeres passivt for at spore indekser. Passivt forvaltede fonde køber typisk ikke optioner, så indikatoren for put/call-forholdet følger mere nøje følelsen af aktivt forvaltede fonde.
13D/G-arkivering
Vi præsenterer 13D/G ansøgninger separat fra 13F ansøgninger på grund af den forskellige behandling af SEC. 13D/G-ansøgninger kan indgives af grupper af investorer (med én ledende), hvorimod 13F-ansøgninger ikke kan. Dette resulterer i situationer, hvor en investor kan indsende en 13D/G, der rapporterer én værdi for de samlede aktier (der repræsenterer alle de aktier, der ejes af investorgruppen), men derefter indsender en 13F, der rapporterer en anden værdi for de samlede aktier (der udelukkende repræsenterer deres egne) ejendomsret). Det betyder, at aktieejerskab af 13D/G-arkiver og 13F-arkiveringer ofte ikke er direkte sammenlignelige, så vi præsenterer dem separat.
Bemærk: Fra den 16. maj 2021 viser vi ikke længere ejere, der ikke har indsendt en 13D/G inden for det seneste år. Tidligere viste vi den fulde historie af 13D/G-arkiver. Generelt skal enheder, der er forpligtet til at indgive 13D/G-ansøgninger, indgive mindst årligt, før de indsender en afsluttende ansøgning. Dog forlader fonde nogle gange positioner uden at indsende en afsluttende ansøgning (dvs. de afvikler), så visning af den fulde historie resulterede nogle gange i forvirring om det nuværende ejerskab. For at undgå forvirring viser vi nu kun 'aktuelle' ejere - det vil sige - ejere, der har anmeldt inden for det seneste år.
Upgrade to unlock premium data.
| Fil dato | Form | Investor | Forrige Aktier |
Seneste Aktier |
Δ Aktier (Procent) |
Ejendomsret (Procent) |
Δ Ejerskab (Procent) |
|
|---|---|---|---|---|---|---|---|---|
| 2026-03-26 | VANGUARD GROUP INC | 13,326,387 | 0 | -100.00 | 0.00 | -100.00 | ||
| 2026-02-05 | FMR LLC | 160,700 | 5,474,232 | 3,306.49 | 6.30 | 1,932.26 | ||
| 2026-02-05 | VANGUARD PORTFOLIO MANAGEMENT LLC | 9,158,415 | 10.59 | |||||
| 2025-11-10 | STATE STREET CORP | 4,302,294 | 4,583,454 | 6.54 | 5.30 | 6.00 | ||
| 2025-04-30 | BlackRock, Inc. | 12,966,418 | 12,022,896 | -7.28 | 14.20 | -8.39 |
13F og NPORT arkivering
Detaljer om 13F-arkivering er gratis. Detaljer om NP-ansøgninger kræver et premium-medlemskab. Grønne rækker angiver nye positioner. Røde rækker angiver lukkede positioner. Klik på linket ikon for at se den fulde transaktionshistorik.
Opgrader
for at låse premium-data op og eksportere til Excel ![]() .
.
| Fil dato | Kilde | Investor | Type | Gennemsnitlig pris (Øst) |
Aktier | Δ Aktier (%) |
Rapporteret Værdi ($1000) |
Δ Værdi (%) |
Port Alloc (%) |
|
|---|---|---|---|---|---|---|---|---|---|---|
| 2026-01-29 | 13F | Dunhill Financial, LLC | 1 | 0 | ||||||
| 2026-02-06 | 13F | HighTower Advisors, LLC | 656.319 | 1,70 | 11.440 | 10,23 | ||||
| 2025-11-14 | 13F | Wolverine Trading, Llc | Call | 45.200 | 2,26 | 721 | 15,38 | |||
| 2026-02-17 | 13F | Fmr Llc | 5.474.232 | 596,85 | 95.416 | 655,40 | ||||
| 2025-11-14 | 13F | Wolverine Trading, Llc | Put | 14.600 | 233 | |||||
| 2026-01-29 | 13F | Marathon Capital Management | 22.500 | 0,00 | 392 | 8,59 | ||||
| 2026-04-10 | 13F | Pure Financial Advisors, Inc. | 80.691 | -1,21 | 1.403 | -1,41 | ||||
| 2026-02-12 | 13F | Quadrant Capital Group Llc | 223 | 0,00 | 4 | 0,00 | ||||
| 2026-02-10 | 13F | Savant Capital, LLC | 0 | -100,00 | 0 | |||||
| 2025-10-31 | 13F | Mutual Of America Capital Management Llc | 0 | -100,00 | 0 | -100,00 | ||||
| 2026-02-04 | 13F | Tsfg, Llc | 100 | 0,00 | 0 | |||||
| 2026-01-15 | 13F | Nisa Investment Advisors, Llc | 2.156 | -2,75 | 38 | 5,71 | ||||
| 2025-11-12 | 13F | Intrinsic Edge Capital Management LLC | 0 | -100,00 | 0 | |||||
| 2026-02-10 | 13F | Connor, Clark & Lunn Investment Management Ltd. | 35.679 | 622 | ||||||
| 2026-02-12 | 13F | Brinker Capital Investments, LLC | 62.060 | -3,59 | 1.082 | 4,44 | ||||
| 2026-02-13 | 13F | Walleye Trading LLC | Call | 27.000 | 4,25 | 471 | 12,98 | |||
| 2025-11-13 | 13F | FORA Capital, LLC | 0 | -100,00 | 0 | -100,00 | ||||
| 2026-02-13 | 13F | State Street Corp | 4.563.992 | -0,42 | 79.550 | 7,94 | ||||
| 2026-02-12 | 13F | Ankerstar Wealth, LLC | 17 | 0 | ||||||
| 2026-02-13 | 13F | Walleye Trading LLC | Put | 9.900 | 607,14 | 173 | 681,82 | |||
| 2026-02-13 | 13F | Caxton Associates Llp | 59.469 | 1.037 | ||||||
| 2026-02-11 | 13F | Los Angeles Capital Management Llc | 60.090 | -5,23 | 916 | -10,11 | ||||
| 2026-02-13 | 13F | Edgestream Partners, L.P. | 238.039 | -19,30 | 4.149 | -12,52 | ||||
| 2026-01-29 | 13F | DecisionPoint Financial, LLC | 27 | 0,00 | 0 | |||||
| 2026-02-17 | 13F | Symmetry Peak Management Llc | Call | 0 | -100,00 | 0 | ||||
| 2026-01-28 | 13F | Klp Kapitalforvaltning As | 18.500 | -15,91 | 322 | -8,78 | ||||
| 2026-02-13 | 13F | Barclays Plc | 644.370 | 0,53 | 11.231 | 8,96 | ||||
| 2026-02-17 | 13F | Bank Of America Corp /de/ | 599.915 | -22,22 | 10.457 | -15,69 | ||||
| 2026-02-03 | 13F | Farmers & Merchants Investments Inc | 55 | 0,00 | 1 | |||||
| 2025-11-14 | 13F | Federation des caisses Desjardins du Quebec | 0 | -100,00 | 0 | |||||
| 2025-11-17 | 13F | Jacobs Levy Equity Management, Inc | 0 | -100,00 | 0 | |||||
| 2026-02-09 | 13F | Huntington National Bank | 449 | -4,06 | 8 | 0,00 | ||||
| 2026-01-29 | 13F | UBS Group AG | 67.452 | -83,76 | 1.176 | -82,41 | ||||
| 2026-02-05 | 13F | Bessemer Group Inc | 3.247 | 2,27 | 0 | |||||
| 2026-02-13 | 13F | Toroso Investments, LLC | 43.052 | 1,11 | 750 | 9,65 | ||||
| 2026-02-17 | 13F | Northern Trust Corp | 787.560 | -4,91 | 13.727 | 3,08 | ||||
| 2026-03-06 | 13F | Hsbc Holdings Plc | 50.316 | -23,46 | 888 | -13,80 | ||||
| 2026-02-13 | 13F | Squarepoint Ops LLC | 216.515 | -49,29 | 3.774 | -45,04 | ||||
| 2026-02-17 | 13F | Man Group plc | 58.426 | 1.018 | ||||||
| 2026-02-13 | 13F/A | Alberta Investment Management Corp | 0 | -100,00 | 0 | |||||
| 2026-02-03 | 13F | Asset Planning,Inc | 300 | 5 | ||||||
| 2026-02-03 | 13F | SBI Securities Co., Ltd. | 5 | -95,15 | 0 | -100,00 | ||||
| 2026-04-13 | 13F | True Wealth Design, LLC | 1.288 | 0,00 | 22 | 0,00 | ||||
| 2026-01-23 | 13F | Avion Wealth | 201 | 44,60 | 0 | |||||
| 2025-11-12 | 13F | Headlands Technologies LLC | 0 | -100,00 | 0 | |||||
| 2026-02-12 | 13F | CIBC Private Wealth Group, LLC | 20 | 0 | ||||||
| 2026-02-17 | 13F | Shay Capital LLC | 0 | -100,00 | 0 | |||||
| 2026-02-13 | 13F | Dynamic Technology Lab Private Ltd | 0 | -100,00 | 0 | |||||
| 2026-04-06 | 13F | Versant Capital Management, Inc | 2.401 | 8,45 | 42 | 7,89 | ||||
| 2026-02-12 | 13F | Steward Partners Investment Advisory, Llc | 106 | 0,00 | 2 | 0,00 | ||||
| 2026-02-02 | 13F | Montag A & Associates Inc | 0 | -100,00 | 0 | |||||
| 2025-11-06 | 13F | Wedbush Securities Inc | 0 | -100,00 | 0 | |||||
| 2025-11-14 | 13F | Point72 Asia (Singapore) Pte. Ltd. | 947 | 15 | ||||||
| 2026-02-13 | 13F | BNP Paribas Asset Management Holding S.A. | 1.133 | 41,98 | 0 | |||||
| 2026-01-28 | 13F | City State Bank | 200 | 0,00 | 3 | 0,00 | ||||
| 2026-01-23 | 13F | State of Alaska, Department of Revenue | 45.677 | 1,40 | 1 | |||||
| 2026-02-13 | 13F | Caitong International Asset Management Co., Ltd | 1.297 | 23 | ||||||
| 2026-02-17 | 13F | Twinbeech Capital Lp | 68.568 | 1.195 | ||||||
| 2026-02-09 | 13F | Hartland & Co., LLC | 20 | -96,56 | 0 | -100,00 | ||||
| 2026-01-23 | 13F | Westside Investment Management, Inc. | 175 | 0,00 | 3 | 50,00 | ||||
| 2026-02-11 | 13F | MCF Advisors LLC | 467 | 0,00 | 8 | 14,29 | ||||
| 2026-01-06 | 13F | Weybosset Research & Management Llc | 0 | -100,00 | 0 | |||||
| 2026-02-02 | 13F | AIGH Capital Management LLC | 0 | -100,00 | 0 | |||||
| 2026-02-09 | 13F | Harbour Investments, Inc. | 10 | 0,00 | 0 | |||||
| 2026-02-13 | 13F | Morgan Stanley | 1.277.270 | 75,93 | 22.263 | 90,70 | ||||
| 2025-11-13 | 13F | Capital Fund Management S.a. | Put | 0 | -100,00 | 0 | -100,00 | |||
| 2026-01-27 | 13F | Asset Management One Co., Ltd. | 11.300 | 199 | ||||||
| 2026-02-13 | 13F | Mariner, LLC | 29.825 | -25,47 | 520 | -19,13 | ||||
| 2026-02-09 | 13F | Hantz Financial Services, Inc. | 1.040 | 188,89 | 0 | |||||
| 2026-02-12 | 13F | MetLife Investment Management, LLC | 45.441 | -5,16 | 792 | 2,86 | ||||
| 2026-02-17 | 13F | Trexquant Investment LP | 300.757 | 28,08 | 5.242 | 38,86 | ||||
| 2025-11-07 | 13F | Shell Asset Management Co | 2.886 | -59,26 | 0 | |||||
| 2026-02-11 | 13F | Cedar Mountain Advisors, LLC | 62 | 0,00 | 1 | |||||
| 2025-10-30 | 13F | Ridgewood Investments LLC | 0 | -100,00 | 0 | |||||
| 2025-11-13 | 13F | Capital Fund Management S.a. | Call | 0 | -100,00 | 0 | -100,00 | |||
| 2025-11-14 | 13F | Jane Street Group, Llc | Put | 0 | -100,00 | 0 | -100,00 | |||
| 2026-02-11 | 13F | Gilpin Wealth Management, Llc | 4 | 0 | ||||||
| 2026-02-13 | 13F | Rhumbline Advisers | 242.246 | -6,35 | 4.222 | 1,51 | ||||
| 2026-02-17 | 13F | Aster Capital Management (DIFC) Ltd | 501 | 9 | ||||||
| 2026-01-29 | 13F | Comerica Bank | 24.851 | -64,09 | 433 | -61,06 | ||||
| 2026-02-13 | 13F | Walleye Capital LLC | Call | 6.700 | 0,00 | 117 | 8,41 | |||
| 2026-02-12 | 13F | Renaissance Technologies Llc | 112.113 | 1.954 | ||||||
| 2026-02-13 | 13F | Walleye Capital LLC | Put | 9.800 | 92,16 | 171 | 107,32 | |||
| 2025-11-12 | 13F | NewSquare Capital LLC | 0 | -100,00 | 0 | |||||
| 2026-02-02 | 13F | Fifth Third Bancorp | 485 | 7,78 | 8 | 14,29 | ||||
| 2026-02-13 | 13F | Walleye Capital LLC | 36.802 | 1.385,15 | 641 | 1.543,59 | ||||
| 2026-02-11 | 13F | Fox Run Management, L.l.c. | 27.098 | -60,76 | 472 | -57,48 | ||||
| 2026-02-17 | 13F | Point72 Asset Management, L.P. | 78.359 | -84,41 | 1.366 | -83,11 | ||||
| 2026-04-13 | 13F | Massmutual Trust Co Fsb/adv | 533 | 97,41 | 9 | 125,00 | ||||
| 2026-02-13 | 13F | Marshall Wace, Llp | 1.402.556 | 24.447 | ||||||
| 2026-02-13 | 13F | Pinnacle Wealth Planning Services, Inc. | 1.799 | 31 | ||||||
| 2026-02-13 | 13F | Parkside Financial Bank & Trust | 163 | 0,00 | 3 | 0,00 | ||||
| 2026-02-13 | 13F | Prudential Financial Inc | 76.387 | -6,76 | 1.331 | 1,06 | ||||
| 2026-02-11 | 13F | Parallel Advisors, LLC | 203 | 0,00 | 4 | 0,00 | ||||
| 2026-02-13 | 13F | Verition Fund Management LLC | 81.700 | -26,61 | 1.424 | -20,45 | ||||
| 2026-02-17 | 13F | Tudor Investment Corp Et Al | 77.217 | 1.346 | ||||||
| 2026-02-17 | 13F | Scalar Gauge Management, Llc | 145.000 | 2.527 | ||||||
| 2026-02-12 | 13F | Jane Street Group, Llc | Call | 124.200 | 0,81 | 2.165 | 9,24 | |||
| 2026-02-13 | 13F | Alyeska Investment Group, L.P. | 0 | -100,00 | 0 | -100,00 | ||||
| 2026-02-12 | 13F | Jane Street Group, Llc | 23.569 | -88,90 | 411 | -87,99 | ||||
| 2026-02-04 | 13F | Oregon Public Employees Retirement Fund | 18.739 | 1,60 | 327 | 10,14 | ||||
| 2026-02-12 | 13F | Voya Investment Management Llc | 14.721 | -90,60 | 257 | -89,83 | ||||
| 2025-11-21 | 13F | Nebula Research & Development LLC | 0 | -100,00 | 0 | |||||
| 2026-02-17 | 13F | Aqr Capital Management Llc | 464.226 | -15,43 | 8.091 | -8,33 | ||||
| 2026-02-17 | 13F | Amundi | 37.789 | 38,91 | 659 | 46,55 | ||||
| 2026-02-12 | 13F | Principal Securities, Inc. | 0 | -100,00 | 0 | |||||
| 2026-02-13 | 13F | Public Employees Retirement Association Of Colorado | 9.434 | 0,00 | 0 | |||||
| 2026-02-13 | 13F | Smartleaf Asset Management LLC | 1.431 | 102,98 | 25 | 127,27 | ||||
| 2026-02-13 | 13F | Victory Capital Management Inc | 149.928 | -87,72 | 2.613 | -86,69 | ||||
| 2026-02-10 | 13F | Root Financial Partners, LLC | 3 | 0 | ||||||
| 2026-02-12 | 13F | Paradigm Capital Management Inc/ny | 861.000 | 582,66 | 15.007 | 639,99 | ||||
| 2026-04-07 | 13F | Signaturefd, Llc | 539 | -0,37 | 9 | 0,00 | ||||
| 2026-02-12 | 13F | Swiss National Bank | 163.173 | 2,58 | 2.844 | 11,22 | ||||
| 2026-02-17 | 13F | Guggenheim Capital Llc | 28.875 | 26,03 | 503 | 36,68 | ||||
| 2026-02-17 | 13F | Public Employees Retirement System Of Ohio | 1.508 | 0,20 | 26 | 8,33 | ||||
| 2026-02-11 | 13F | Deutsche Bank Ag\ | 600.295 | 83,23 | 10.463 | 98,61 | ||||
| 2026-02-13 | 13F | Police & Firemen's Retirement System of New Jersey | 22.551 | 0,00 | 393 | 8,56 | ||||
| 2026-02-06 | 13F | Larson Financial Group LLC | 1.416 | 161,74 | 25 | 200,00 | ||||
| 2026-02-17 | 13F | Oxford Asset Management Llp | 0 | -100,00 | 0 | -100,00 | ||||
| 2026-02-12 | 13F | Skopos Labs, Inc. | 0 | -100,00 | 0 | -100,00 | ||||
| 2026-02-13 | 13F | Ieq Capital, Llc | 37.236 | -25,33 | 649 | -18,98 | ||||
| 2026-02-17 | 13F | Price T Rowe Associates Inc /md/ | 78.934 | 3,73 | 1 | 0,00 | ||||
| 2026-02-17 | 13F | Glenmede Trust Co Na | 22.764 | 397 | ||||||
| 2026-01-30 | 13F | Moody Aldrich Partners Llc | 135.901 | -4,63 | 2.369 | 3,36 | ||||
| 2026-02-03 | 13F | International Assets Investment Management, Llc | 1.542 | 27 | ||||||
| 2026-01-15 | 13F | Fortitude Family Office, LLC | 51 | 0,00 | 1 | |||||
| 2026-02-17 | 13F | Graham Capital Management, L.P. | 0 | -100,00 | 0 | |||||
| 2025-11-14 | 13F | Cinctive Capital Management LP | 0 | -100,00 | 0 | |||||
| 2026-02-11 | 13F | Hodges Capital Management Inc. | 475.111 | 8.281 | ||||||
| 2025-11-14 | 13F | Peak6 Llc | Put | 0 | -100,00 | 0 | -100,00 | |||
| 2026-02-10 | 13F | Envestnet Asset Management Inc | 23.198 | 3,11 | 404 | 11,91 | ||||
| 2026-02-13 | 13F | Needham Investment Management Llc | 140.000 | -9,68 | 2.440 | -2,09 | ||||
| 2026-02-11 | 13F | Jpmorgan Chase & Co | 281.973 | -47,17 | 4.915 | -42,74 | ||||
| 2026-02-10 | 13F | Quantbot Technologies LP | 76.813 | -33,44 | 1.339 | -27,87 | ||||
| 2026-02-17 | 13F | Two Sigma Investments, Lp | 291.668 | -54,54 | 5.084 | -50,73 | ||||
| 2026-02-17 | 13F | Mercer Global Advisors Inc /adv | 10.054 | -6,13 | 175 | 1,74 | ||||
| 2025-11-13 | 13F | EntryPoint Capital, LLC | 0 | -100,00 | 0 | -100,00 | ||||
| 2026-02-02 | 13F | New England Capital Financial Advisors LLC | 44 | 0,00 | 1 | |||||
| 2026-02-18 | 13F | State of Tennessee, Treasury Department | 28.014 | -15,41 | 486 | -8,65 | ||||
| 2026-02-17 | 13F | Voloridge Investment Management, Llc | 532.904 | -27,49 | 9.289 | -21,40 | ||||
| 2026-02-17 | 13F | Alliancebernstein L.p. | 90.086 | -0,00 | 1.570 | 8,43 | ||||
| 2026-02-17 | 13F | nVerses Capital, LLC | 11.697 | 204 | ||||||
| 2026-04-06 | 13F | GAMMA Investing LLC | 5.826 | -2,22 | 101 | -1,94 | ||||
| 2026-02-13 | 13F | Panagora Asset Management Inc | 139.458 | 50,14 | 2.431 | 62,76 | ||||
| 2026-02-06 | 13F | Pnc Financial Services Group, Inc. | 3.975 | 3,81 | 69 | 13,11 | ||||
| 2026-02-17 | 13F | PharVision Advisers, LLC | 0 | -100,00 | 0 | |||||
| 2026-02-06 | 13F | Covestor Ltd | 7 | 0,00 | 0 | |||||
| 2026-02-17 | 13F | Maryland State Retirement & Pension System | 12.096 | 2,79 | 211 | 11,11 | ||||
| 2026-02-12 | 13F | Cibc World Markets Corp | 0 | -100,00 | 0 | |||||
| 2026-02-09 | 13F | Systematic Financial Management Lp | 93.251 | -3,57 | 1.625 | 4,57 | ||||
| 2026-02-17 | 13F | Royal Bank Of Canada | 72.444 | -30,84 | 1.262 | -25,06 | ||||
| 2025-11-14 | 13F | Peak6 Llc | 0 | -100,00 | 0 | -100,00 | ||||
| 2026-02-09 | 13F | Keating Financial Advisory Services, Inc. | 25 | 0 | ||||||
| 2026-02-13 | 13F | Essex Investment Management Co Llc | 235.595 | -1,95 | 4.106 | 6,29 | ||||
| 2025-11-13 | 13F | Bank Of Montreal /can/ | 0 | -100,00 | 0 | |||||
| 2026-02-17 | 13F | D. E. Shaw & Co., Inc. | 106.443 | -68,75 | 1.855 | -66,12 | ||||
| 2026-02-10 | 13F | Rothschild Investment Llc | 147 | 6,52 | 3 | 0,00 | ||||
| 2026-02-17 | 13F | Quantinno Capital Management LP | 41.876 | 43,37 | 730 | 55,44 | ||||
| 2026-02-06 | 13F/A | Rathbone Brothers plc | 19.420 | 0,00 | 338 | 8,33 | ||||
| 2026-02-17 | 13F | Polar Asset Management Partners Inc. | 144.186 | -24,15 | 2.513 | -17,77 | ||||
| 2026-02-17 | 13F | Numerai GP LLC | 0 | -100,00 | 0 | |||||
| 2026-01-30 | 13F | New York State Teachers Retirement System | 60.837 | 0,00 | 1 | |||||
| 2026-02-13 | 13F | First Trust Advisors Lp | 17.246 | 39,37 | 301 | 51,52 | ||||
| 2026-01-27 | 13F | Zurcher Kantonalbank (Zurich Cantonalbank) | 25.355 | 0,00 | 442 | 8,35 | ||||
| 2026-01-28 | 13F | Universal- Beteiligungs- und Servicegesellschaft mbH | 81.354 | -16,75 | 1.418 | -9,74 | ||||
| 2026-02-11 | 13F | Primecap Management Co/ca/ | 242.610 | -68,12 | 4.229 | -65,45 | ||||
| 2026-04-14 | 13F | Nbc Securities, Inc. | 5.385 | 0,00 | 94 | 0,00 | ||||
| 2026-02-13 | 13F | Truvestments Capital Llc | 338 | 0,00 | 6 | 0,00 | ||||
| 2026-01-16 | 13F | Louisiana State Employees Retirement System | 37.600 | 0,00 | 655 | 8,44 | ||||
| 2026-02-09 | 13F | Annis Gardner Whiting Capital Advisors, LLC | 25 | 0,00 | 0 | |||||
| 2026-02-12 | 13F | BlackRock, Inc. | 13.528.810 | 2,20 | 235.807 | 10,78 | ||||
| 2026-02-17 | 13F | Schonfeld Strategic Advisors LLC | 0 | -100,00 | 0 | |||||
| 2026-02-05 | 13F | Allworth Financial LP | 1.139 | -17,70 | 20 | -13,64 | ||||
| 2026-04-08 | 13F | Wealth Enhancement Advisory Services, Llc | 23.977 | 14,76 | 431 | 5,64 | ||||
| 2026-01-29 | 13F | IMC-Chicago, LLC | Call | 61.400 | 329,37 | 1.070 | 367,25 | |||
| 2026-02-12 | 13F | Dimensional Fund Advisors Lp | 1.576.634 | 0,39 | 27.482 | 8,82 | ||||
| 2026-02-13 | 13F | Public Sector Pension Investment Board | 0 | -100,00 | 0 | |||||
| 2026-02-14 | 13F | Rockefeller Capital Management L.P. | 180 | -46,75 | 3 | -40,00 | ||||
| 2026-02-12 | 13F | BRYN MAWR TRUST Co | 400 | 0,00 | 7 | 0,00 | ||||
| 2026-02-13 | 13F | Y-Intercept (Hong Kong) Ltd | 33.870 | -68,36 | 590 | -65,72 | ||||
| 2026-02-17 | 13F | California State Teachers Retirement System | 81.047 | -0,03 | 1.413 | 8,37 | ||||
| 2026-02-06 | 13F | EverSource Wealth Advisors, LLC | 1.346 | -36,21 | 23 | -30,30 | ||||
| 2026-02-02 | 13F | Principal Financial Group Inc | 391.680 | -0,92 | 6.827 | 7,39 | ||||
| 2026-02-17 | 13F | Optiver Holding B.V. | 38 | 1 | ||||||
| 2026-02-10 | 13F | State of Wyoming | 4.346 | 76 | ||||||
| 2026-02-12 | 13F | Nuveen, LLC | 1.254.309 | 2,49 | 21.863 | 11,09 | ||||
| 2026-02-17 | 13F | Engineers Gate Manager LP | 150.484 | 77,72 | 2.623 | 92,65 | ||||
| 2026-02-12 | 13F | State Board Of Administration Of Florida Retirement System | 21.299 | 0,00 | 371 | 8,48 | ||||
| 2026-01-06 | 13F | Sanctuary Advisors, LLC | 0 | -100,00 | 0 | -100,00 | ||||
| 2025-12-18 | 13F | Danske Bank A/s | 0 | -100,00 | 0 | |||||
| 2026-02-17 | 13F | Defiance ETFs, LLC | 618.284 | 10.944 | ||||||
| 2025-11-12 | 13F/A | Norges Bank | 15.424 | 0,00 | 223 | -28,06 | ||||
| 2026-01-14 | 13F | Weil Company, Inc. | 22.100 | 0,00 | 385 | 8,45 | ||||
| 2026-02-10 | 13F | Commonwealth Of Pennsylvania Public School Empls Retrmt Sys | 20.333 | -2,46 | 354 | 5,67 | ||||
| 2026-02-06 | 13F | Handelsbanken Fonder AB | 36.681 | 25,27 | 1 | |||||
| 2026-01-09 | 13F | Assenagon Asset Management S.A. | 250.448 | -19,42 | 4.365 | -12,65 | ||||
| 2026-02-10 | 13F | Axq Capital, Lp | 10.470 | 3,84 | 182 | 12,35 | ||||
| 2026-02-11 | 13F | Ameritas Investment Partners, Inc. | 6.821 | 119 | ||||||
| 2026-01-21 | 13F | Yousif Capital Management, Llc | 21.863 | -12,12 | 423 | 5,75 | ||||
| 2026-04-13 | 13F | IFP Advisors, Inc | 428 | -9,89 | 7 | -12,50 | ||||
| 2026-02-13 | 13F | Charles Schwab Investment Management Inc | 1.140.886 | 1,78 | 19.886 | 10,32 | ||||
| 2026-02-13 | 13F | Stifel Financial Corp | 35.112 | -3,07 | 612 | 5,15 | ||||
| 2026-02-17 | 13F | Russell Investments Group, Ltd. | 55.427 | 0,09 | 966 | 8,54 | ||||
| 2026-02-05 | 13F | Amalgamated Bank | 23.847 | 2,74 | 0 | |||||
| 2026-02-13 | 13F | Great West Life Assurance Co /can/ | 68.179 | 0,00 | 1 | 0,00 | ||||
| 2026-02-12 | 13F | Counterpoint Mutual Funds LLC | 62.530 | 116,96 | 679 | 19,12 | ||||
| 2026-02-13 | 13F | Umb Bank N A/mo | 517 | 53,41 | 9 | 80,00 | ||||
| 2026-02-04 | 13F | Bailard, Inc. | 0 | -100,00 | 0 | |||||
| 2026-02-17 | 13F | Tower Research Capital LLC (TRC) | 7.661 | 115,20 | 134 | 133,33 | ||||
| 2026-02-13 | 13F | Quarry LP | 5 | -99,77 | 0 | -100,00 | ||||
| 2026-02-13 | 13F | Wells Fargo & Company/mn | 98.907 | -57,83 | 1.724 | -54,31 | ||||
| 2026-02-17 | 13F | Citadel Advisors Llc | Put | 28.700 | 40,69 | 500 | 52,44 | |||
| 2026-02-11 | 13F | LPL Financial LLC | 24.822 | -9,71 | 433 | -2,26 | ||||
| 2026-02-13 | 13F | Fortitude Advisory Group L.L.C. | 0 | -100,00 | 0 | |||||
| 2026-02-17 | 13F | Millennium Management Llc | 214.755 | -30,81 | 3.743 | -25,01 | ||||
| 2026-02-17 | 13F | Citadel Advisors Llc | Call | 96.600 | 6,50 | 1.684 | 15,43 | |||
| 2026-02-13 | 13F | SRS Capital Advisors, Inc. | 402 | -94,57 | 7 | -94,12 | ||||
| 2026-02-17 | 13F | Citadel Advisors Llc | 29.527 | -52,03 | 515 | -48,03 | ||||
| 2026-02-23 | 13F | Leonteq Securities AG | 0 | -100,00 | 0 | |||||
| 2026-02-12 | 13F | New York State Common Retirement Fund | 23.842 | 0,00 | 416 | 8,36 | ||||
| 2026-02-11 | 13F | Simplex Trading, Llc | Put | 17.200 | -17,31 | 300 | ||||
| 2026-02-11 | 13F | Simplex Trading, Llc | Call | 62.900 | 82,32 | 1.096 | ||||
| 2026-02-11 | 13F | Cerity Partners LLC | 0 | -100,00 | 0 | |||||
| 2026-01-21 | 13F | SJS Investment Consulting Inc. | 5 | 0 | ||||||
| 2026-04-07 | 13F | Farther Finance Advisors, LLC | 2.070 | -5,26 | 37 | -5,26 | ||||
| 2026-02-13 | 13F | Ubs Asset Management Americas Inc | 148.293 | -7,70 | 2.585 | 0,04 | ||||
| 2026-02-11 | 13F | Allianz Asset Management GmbH | 574.614 | 63,23 | 10.016 | 76,94 | ||||
| 2026-02-17 | 13F | Boothbay Fund Management, Llc | 16.785 | -21,19 | 293 | -14,62 | ||||
| 2026-01-23 | 13F | Altfest L J & Co Inc | 24.340 | 424 | ||||||
| 2026-02-17 | 13F | Canada Pension Plan Investment Board | 12.800 | -55,71 | 223 | -51,94 | ||||
| 2026-02-17 | 13F | MIRAE ASSET GLOBAL ETFS HOLDINGS Ltd. | 38.307 | 1,01 | 668 | 9,52 | ||||
| 2026-02-17 | 13F | Blair William & Co/il | 17.430 | -2,23 | 304 | 5,94 | ||||
| 2026-02-17 | 13F | Capital Fund Management S.a. | 0 | -100,00 | 0 | -100,00 | ||||
| 2026-02-09 | 13F | Quest Partners LLC | 3.350 | -31,28 | 58 | -25,64 | ||||
| 2026-02-06 | 13F | Gsa Capital Partners Llp | 31.287 | -56,82 | 1 | -100,00 | ||||
| 2026-02-17 | 13F | Susquehanna International Group, Llp | Call | 129.800 | -11,70 | 2.262 | -4,27 | |||
| 2026-02-17 | 13F | XTX Topco Ltd | 54.622 | 75,04 | 952 | 90,02 | ||||
| 2026-02-17 | 13F | Brevan Howard Capital Management LP | 29.738 | -29,22 | 518 | -23,26 | ||||
| 2025-11-06 | 13F | Versor Investments LP | 0 | -100,00 | 0 | |||||
| 2026-02-10 | 13F | Acadian Asset Management Llc | 203.992 | -5,31 | 4 | 0,00 | ||||
| 2026-02-11 | 13F | Rise Advisors, LLC | 0 | -100,00 | 0 | |||||
| 2026-02-10 | 13F | Bank of New York Mellon Corp | 491.323 | 4,27 | 8.564 | 13,03 | ||||
| 2026-02-11 | 13F | Group One Trading, L.p. | Put | 8.300 | 12,16 | 145 | 22,03 | |||
| 2026-02-06 | 13F | Bare Financial Services, Inc | 63 | 70,27 | 1 | |||||
| 2026-02-11 | 13F | Group One Trading, L.p. | Call | 94.000 | 189,23 | 1.638 | 213,79 | |||
| 2026-02-13 | 13F | Sterling Capital Management LLC | 4.213 | -14,84 | 73 | -7,59 | ||||
| 2025-11-14 | 13F | Texas Permanent School Fund | 0 | -100,00 | 0 | |||||
| 2026-02-17 | 13F | Algert Global Llc | 961.321 | 18,78 | 17 | 23,08 | ||||
| 2026-02-13 | 13F | Bridgefront Capital, LLC | 10.144 | -58,35 | 177 | -54,99 | ||||
| 2026-01-28 | 13F | Teacher Retirement System Of Texas | 16.978 | -47,64 | 296 | -43,38 | ||||
| 2026-01-29 | 13F | Teachers Retirement System Of The State Of Kentucky | 20.215 | -8,07 | 0 | |||||
| 2026-02-13 | 13F | Citigroup Inc | 30.532 | -22,34 | 532 | -15,82 | ||||
| 2026-01-23 | 13F | Tectonic Advisors Llc | 63.929 | -15,05 | 1.114 | -7,93 | ||||
| 2026-02-09 | 13F | White Pine Capital Llc | 87.803 | 84,53 | 1.530 | 100,00 | ||||
| 2025-11-14 | 13F | Corton Capital Inc. | 13.054 | 210 | ||||||
| 2026-02-17 | 13F | Frontier Capital Management Co Llc | 819.504 | -34,45 | 14.284 | -28,95 | ||||
| 2026-02-10 | 13F | Goldman Sachs Group Inc | 2.045.160 | -30,18 | 35.647 | -24,31 | ||||
| 2026-02-17 | 13F | Susquehanna International Group, Llp | 84.677 | -35,62 | 1.476 | -30,26 | ||||
| 2026-02-17 | 13F | Susquehanna International Group, Llp | Put | 85.200 | -17,52 | 1.485 | -10,60 | |||
| 2026-02-12 | 13F | Hrt Financial Lp | 22.782 | 0 | ||||||
| 2026-02-19 | 13F | Invesco Ltd. | 2.149.589 | 419,92 | 37.467 | 463,58 | ||||
| 2026-02-02 | 13F | Strs Ohio | 2.100 | -63,79 | 37 | -61,29 | ||||
| 2026-02-17 | 13F | Silvercrest Asset Management Group Llc | 461.283 | 0,00 | 8.040 | 8,40 | ||||
| 2026-02-17 | 13F | Advisor Group Holdings, Inc. | 7.055 | 465,76 | 123 | 510,00 | ||||
| 2026-02-17 | 13F | CWM Advisors, LLC | 26.580 | -7,58 | 463 | 0,22 | ||||
| 2026-02-17 | 13F | Captrust Financial Advisors | 14.074 | 4,28 | 245 | 12,90 | ||||
| 2026-01-28 | 13F | Salomon & Ludwin, LLC | 796 | 175,43 | 14 | 250,00 | ||||
| 2026-02-12 | 13F | Ensign Peak Advisors, Inc | 5.662 | -69,90 | 99 | -67,55 | ||||
| 2026-02-11 | 13F | Hughes Financial Services, LLC | 51 | 0,00 | 1 | |||||
| 2026-02-17 | 13F | Jump Financial, LLC | 123.300 | -66,81 | 2.149 | -64,02 | ||||
| 2026-02-11 | 13F | Illinois Municipal Retirement Fund | 35.231 | -13,92 | 614 | -6,69 | ||||
| 2026-02-13 | 13F | Natixis | 0 | -100,00 | 0 | |||||
| 2026-02-09 | 13F | Legal & General Group Plc | 198.327 | -4,50 | 3.457 | 3,50 | ||||
| 2026-01-26 | 13F | Cwm, Llc | 22.122 | -21,72 | 0 | |||||
| 2026-02-09 | 13F | Geode Capital Management, Llc | 2.038.144 | 1,42 | 35.531 | 9,94 | ||||
| 2026-01-30 | 13F | Us Bancorp \de\ | 5.799 | -6,92 | 101 | 1,00 | ||||
| 2026-02-09 | 13F | Lisanti Capital Growth, LLC | 0 | -100,00 | 0 | |||||
| 2026-02-17 | 13F | Summit Global Investments | 58.007 | 68,15 | 1 | |||||
| 2026-02-17 | 13F | Petrus Trust Company, LTA | 0 | -100,00 | 0 | |||||
| 2026-02-17 | 13F | Jones Financial Companies Lllp | 247 | 0,00 | 4 | 33,33 | ||||
| 2026-02-05 | 13F | Thrivent Financial For Lutherans | 56.435 | -4,43 | 1 | |||||
| 2026-02-10 | 13F | Bnp Paribas Arbitrage, Sa | 758.109 | 42,00 | 13.214 | 53,93 | ||||
| 2026-02-11 | 13F | Winton Capital Group Ltd | 213.149 | 3.715 | ||||||
| 2025-11-14 | 13F | Point72 (DIFC) Ltd | 12.134 | 440,01 | 195 | 529,03 | ||||
| 2025-11-14 | 13F | Raymond James Financial Inc | 0 | -100,00 | 0 | |||||
| 2026-01-28 | 13F | Arizona State Retirement System | 22.878 | -5,83 | 399 | 2,05 | ||||
| 2026-01-21 | 13F | Flagship Harbor Advisors, Llc | 8 | 0 | ||||||
| 2026-02-13 | 13F | Kilter Group LLC | 0 | -100,00 | 0 | |||||
| 2026-02-17 | 13F | Advisory Services Network, LLC | 0 | -100,00 | 0 | |||||
| 2026-02-17 | 13F | Magnetar Financial LLC | 0 | -100,00 | 0 | |||||
| 2026-01-29 | 13F | Cornerstone Investment Partners, LLC | 12.658 | 221 | ||||||
| 2026-02-17 | 13F | Janus Henderson Group Plc | 34.859 | 0,00 | 608 | 8,39 | ||||
| 2025-11-14 | 13F | Cubist Systematic Strategies, LLC | 590.772 | -18,87 | 9.500 | -8,19 | ||||
| 2026-02-10 | 13F | 1492 Capital Management LLC | 317.738 | 1,73 | 5.538 | 10,27 | ||||
| 2026-01-23 | 13F | Assetmark, Inc | 38 | -17,39 | 1 | |||||
| 2026-02-10 | 13F/A | Northwestern Mutual Wealth Management Co | 1.446 | 25 | ||||||
| 2026-02-06 | 13F | ProShare Advisors LLC | 16.048 | 4,32 | 280 | 12,96 | ||||
| 2026-02-13 | 13F | Laurion Capital Management LP | 60.596 | 505,96 | 1.056 | 560,00 | ||||
| 2026-02-20 | 13F | Sunbelt Securities, Inc. | 35 | 0,00 | 1 | |||||
| 2026-01-29 | 13F | Pictet Asset Management Holding SA | 10.884 | 190 | ||||||
| 2026-02-13 | 13F | Manufacturers Life Insurance Company, The | 0 | -100,00 | 0 | |||||
| 2026-02-17 | 13F | Two Sigma Advisers, Lp | 401.349 | -34,02 | 6.996 | -28,48 | ||||
| 2025-11-13 | 13F | Glenmede Investment Management, LP | 19.409 | 312 | ||||||
| 2026-02-17 | 13F | ISAM Funds (UK) Ltd | 0 | -100,00 | 0 | |||||
| 2026-02-13 | 13F | Sei Investments Co | 194.539 | 375,80 | 3.391 | 415,98 | ||||
| 2026-02-06 | 13F | Legato Capital Management LLC | 76.754 | -7,84 | 1.338 | -0,15 | ||||
| 2026-01-29 | 13F | Vanguard Group Inc | 13.326.387 | 4,76 | 232.279 | 13,56 | ||||
| 2026-02-10 | 13F | Intech Investment Management Llc | 45.484 | -35,87 | 793 | -30,53 | ||||
| 2026-02-13 | 13F | Neuberger Berman Group LLC | 10.737 | -1,50 | 187 | 6,86 | ||||
| 2026-02-17 | 13F | Creative Planning | 24.336 | -8,62 | 424 | -0,93 | ||||
| 2026-02-11 | 13F | Franklin Resources Inc | 32.848 | 5,81 | 573 | 14,63 | ||||
| 2026-02-17 | 13F | PDT Partners, LLC | 152.748 | -12,33 | 2.662 | -4,96 | ||||
| 2026-02-17 | 13F | Ameriprise Financial Inc | 566.573 | 9,01 | 9.875 | 18,16 | ||||
| 2026-02-17 | 13F | Parallax Volatility Advisers, L.P. | Call | 55.000 | 0,00 | 959 | 8,37 | |||
| 2026-01-09 | 13F | SG Americas Securities, LLC | 177.850 | 522,16 | 3 | |||||
| 2026-02-12 | 13F | Penserra Capital Management LLC | 618.284 | -2,05 | 11 | 0,00 | ||||
| 2025-10-17 | 13F | Apollon Wealth Management, LLC | 0 | -100,00 | 0 | -100,00 | ||||
| 2026-02-12 | 13F | Federated Hermes, Inc. | 749.528 | 57,76 | 13.064 | 71,02 | ||||
| 2026-01-21 | 13F | Sound Income Strategies, LLC | 318 | 6 |
Other Listings
| DE:JMX | 18,08 € |