Grundlæggende statistik
| Institutionelle aktier (lange) | 7.424.114 - 19,73% (ex 13D/G) - change of 0,87MM shares 13,26% MRQ |
| Institutionel værdi (lang) | $ 12.259 USD ($1000) |
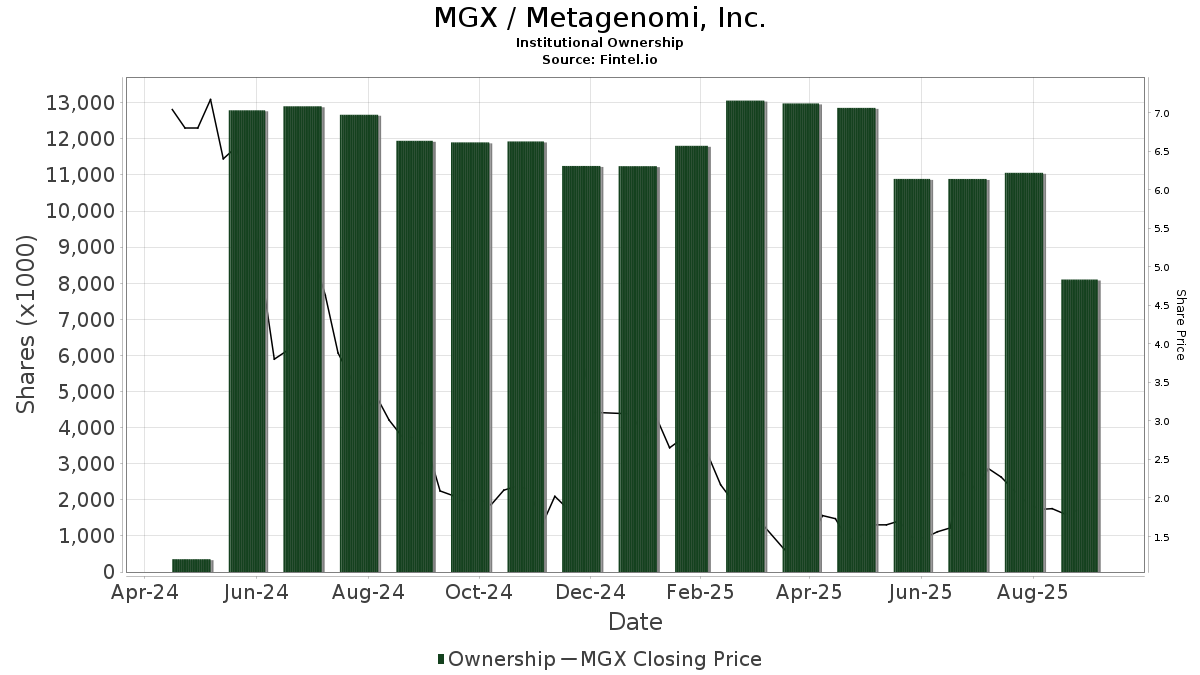
Institutionelt ejerskab og aktionærer
Metagenomi Therapeutics, Inc. (US:MGX) har 61 institutionelle ejere og aktionærer, der har indsendt 13D/G- eller 13F-formularer til Securities Exchange Commission (SEC). Disse institutioner har i alt 7,424,114 aktier. Største aktionærer omfatter Vanguard Group Inc, Renaissance Technologies Llc, Sozo Ventures GP II, L.P., Catalio Capital Management, LP, Peapod Lane Capital LLC, Two Sigma Investments, Lp, Jane Street Group, Llc, Bridgeway Capital Management Inc, Geode Capital Management, Llc, and Pura Vida Investments, Llc .
Metagenomi Therapeutics, Inc. (NasdaqGS:MGX) institutionel ejerskabsstruktur viser aktuelle positioner i virksomheden efter institutioner og fonde, samt seneste ændringer i positionsstørrelse. Større aktionærer kan omfatte individuelle investorer, investeringsforeninger, hedgefonde eller institutioner. Skema 13D angiver, at investoren besidder (eller besidder) mere end 5 % af virksomheden og har til hensigt (eller har til hensigt at) aktivt at forfølge en ændring i forretningsstrategi. Skema 13G indikerer en passiv investering på over 5%.
The share price as of March 11, 2026 is 1,64 / share. Previously, on March 12, 2025, the share price was 2,05 / share. This represents a decline of 19,76% over that period.
Fondens stemningsscore
Fund Sentiment Score (fka Ownership Accumulation Score) finder de aktier, der bliver mest købt af fonde. Det er resultatet af en sofistikeret, multi-faktor kvantitativ model, der identificerer virksomheder med de højeste niveauer af institutionel akkumulering. Scoringsmodellen bruger en kombination af den samlede stigning i oplyste ejere, ændringerne i porteføljeallokeringer i disse ejere og andre målinger. Tallet går fra 0 til 100, hvor højere tal indikerer et højere niveau af akkumulering for sine jævnaldrende, og 50 er gennemsnittet.
Opdateringsfrekvens: Dagligt
Se Ownership Explorer, som giver en liste over højest rangerende virksomheder.
AI+ Ask Fintel’s AI assistant about Metagenomi Therapeutics, Inc..
Select a question to share a public post with an AI-crafted answer.
Thinking of good questions…
Institutionel Put/Call-forhold
Ud over at indberette standardaktie- og gældsudstedelser skal institutter med mere end 100 mill. aktiver under forvaltning også oplyse deres put- og call-optionsbeholdninger. Da salgsoptioner generelt indikerer negativ stemning, og købsoptioner indikerer positiv stemning, kan vi få en fornemmelse af den overordnede institutionelle stemning ved at plotte forholdet mellem put og kald. Diagrammet til højre viser det historiske put/call-forhold for dette instrument.
Brug af Put/Call Ratio som en indikator for investorernes stemning overvinder en af de vigtigste mangler ved at bruge totalt institutionelt ejerskab, som er, at en betydelig mængde af aktiver under forvaltning investeres passivt for at spore indekser. Passivt forvaltede fonde køber typisk ikke optioner, så indikatoren for put/call-forholdet følger mere nøje følelsen af aktivt forvaltede fonde.
13F og NPORT arkivering
Detaljer om 13F-arkivering er gratis. Detaljer om NP-ansøgninger kræver et premium-medlemskab. Grønne rækker angiver nye positioner. Røde rækker angiver lukkede positioner. Klik på linket ikon for at se den fulde transaktionshistorik.
Opgrader
for at låse premium-data op og eksportere til Excel ![]() .
.
| Fil dato | Kilde | Investor | Type | Gennemsnitlig pris (Øst) |
Aktier | Δ Aktier (%) |
Rapporteret Værdi ($1000) |
Δ Værdi (%) |
Port Alloc (%) |
|
|---|---|---|---|---|---|---|---|---|---|---|
| 2025-11-14 | 13F | Virtu Financial LLC | 0 | -100,00 | 0 | |||||
| 2026-02-17 | 13F | Millennium Management Llc | 235.185 | -24,30 | 381 | -48,23 | ||||
| 2025-11-06 | 13F | Ground Swell Capital, LLC | 0 | -100,00 | 0 | -100,00 | ||||
| 2026-02-13 | 13F | Pura Vida Investments, Llc | 264.391 | 0,00 | 428 | -31,63 | ||||
| 2026-01-07 | 13F | Green Alpha Advisors, LLC | 0 | -100,00 | 0 | |||||
| 2025-11-10 | 13F | Hartland & Co., LLC | 0 | -100,00 | 0 | |||||
| 2025-11-14 | 13F | Jain Global LLC | 0 | -100,00 | 0 | |||||
| 2025-11-13 | 13F | Deutsche Bank Ag\ | 0 | -100,00 | 0 | |||||
| 2026-02-11 | 13F | Meeder Asset Management Inc | 5.496 | 0,00 | 9 | -38,46 | ||||
| 2026-01-29 | 13F | UBS Group AG | 25.099 | 6,86 | 41 | -27,27 | ||||
| 2026-02-13 | 13F | Citigroup Inc | 0 | -100,00 | 0 | |||||
| 2026-02-17 | 13F | Tower Research Capital LLC (TRC) | 9.303 | 15 | ||||||
| 2026-02-17 | 13F | Optiver Holding B.V. | 18 | 0,00 | 0 | |||||
| 2026-02-17 | 13F | Catalio Capital Management, LP | 528.993 | 0,00 | 857 | -31,68 | ||||
| 2026-02-17 | 13F | Two Sigma Investments, Lp | 441.388 | 112,69 | 715 | 45,62 | ||||
| 2026-02-13 | 13F | SRS Capital Advisors, Inc. | 11 | -63,33 | 0 | |||||
| 2026-02-17 | 13F | Man Group plc | 56.497 | 6,82 | 92 | -27,20 | ||||
| 2026-02-17 | 13F | Two Sigma Securities, Llc | 11.700 | -4,01 | 19 | -35,71 | ||||
| 2026-02-17 | 13F | Jones Financial Companies Lllp | 500 | 0,00 | 1 | -100,00 | ||||
| 2026-02-12 | 13F | Renaissance Technologies Llc | 628.400 | 276,29 | 1.018 | 157,72 | ||||
| 2026-02-11 | 13F | Jpmorgan Chase & Co | 1.596 | -97,45 | 3 | -98,65 | ||||
| 2026-02-17 | 13F | Northern Trust Corp | 75.172 | 88,05 | 122 | 28,72 | ||||
| 2026-02-17 | 13F | Quadrature Capital Ltd | 33.917 | 55 | ||||||
| 2025-09-15 | 13F/A | Charles Schwab Investment Management Inc | 65.753 | 0,00 | 89 | -62,45 | ||||
| 2025-11-14 | 13F | Brown Advisory Inc | 0 | -100,00 | 0 | |||||
| 2025-11-14 | 13F | Cubist Systematic Strategies, LLC | 7.461 | 139,67 | 18 | 325,00 | ||||
| 2025-11-14 | 13F | Point72 (DIFC) Ltd | 134 | 0,00 | 0 | |||||
| 2026-02-13 | 13F | Peak Planning Group, LLC | 12.500 | 20 | ||||||
| 2026-02-17 | 13F | Advisor Group Holdings, Inc. | 2.891 | -7,96 | 5 | -33,33 | ||||
| 2025-10-23 | 13F | SG Americas Securities, LLC | 0 | -100,00 | 0 | |||||
| 2026-01-26 | 13F | Cwm, Llc | 32 | -3,03 | 0 | |||||
| 2025-11-13 | 13F | Norges Bank | 0 | -100,00 | 0 | |||||
| 2026-02-13 | 13F | Dynamic Technology Lab Private Ltd | 23.762 | -12,57 | 38 | -40,62 | ||||
| 2026-02-13 | 13F | Morgan Stanley | 59.682 | -75,27 | 97 | -83,19 | ||||
| 2025-09-26 | NP | UAPIX - Ultrasmall-cap Profund Investor Class | 0 | -100,00 | 0 | |||||
| 2026-02-12 | 13F | Marex Group plc | 0 | -100,00 | 0 | |||||
| 2025-11-12 | 13F | Catalyst Funds Management Pty Ltd | 0 | -100,00 | 0 | |||||
| 2026-01-29 | 13F | Vanguard Group Inc | 1.270.246 | 2,31 | 2.058 | -30,08 | ||||
| 2026-02-17 | 13F | Two Sigma Advisers, Lp | 201.300 | 299,40 | 326 | 173,95 | ||||
| 2026-02-13 | 13F | State Street Corp | 120.427 | -0,91 | 195 | -32,29 | ||||
| 2025-10-08 | 13F/A | New York State Common Retirement Fund | 0 | -100,00 | 0 | -100,00 | ||||
| 2026-01-29 | 13F | UMA Financial Services, Inc. | 0 | -100,00 | 0 | |||||
| 2026-02-13 | 13F | JustInvest LLC | 16.298 | -24,27 | 26 | -49,02 | ||||
| 2025-09-24 | NP | PJARX - SmallCap Value Fund II R-3 | 0 | -100,00 | 0 | -100,00 | ||||
| 2026-01-15 | 13F | Nisa Investment Advisors, Llc | 511 | 0,00 | 1 | -100,00 | ||||
| 2026-02-09 | 13F | Geode Capital Management, Llc | 305.908 | 4,80 | 496 | -28,47 | ||||
| 2025-10-23 | 13F | Spire Wealth Management | 0 | -100,00 | 0 | |||||
| 2026-01-30 | 13F | Us Bancorp \de\ | 4.500 | 0,00 | 7 | -30,00 | ||||
| 2026-02-17 | 13F/A | RBF Capital, LLC | 64.021 | -9,55 | 104 | -38,32 | ||||
| 2026-01-07 | 13F | Massmutual Trust Co Fsb/adv | 593 | 0,00 | 1 | -100,00 | ||||
| 2026-02-10 | 13F | Bbr Partners, Llc | 53.403 | 0,00 | 87 | -31,75 | ||||
| 2026-02-13 | 13F | Walleye Capital LLC | 0 | -100,00 | 0 | |||||
| 2025-11-14 | 13F | Point72 Asia (Singapore) Pte. Ltd. | 4.922 | -52,26 | 12 | -26,67 | ||||
| 2026-01-28 | 13F | Peapod Lane Capital LLC | 497.653 | -3,15 | 806 | -33,83 | ||||
| 2025-11-14 | 13F | Aqr Capital Management Llc | 0 | -100,00 | 0 | |||||
| 2025-11-14 | 13F | Susquehanna International Group, Llp | 0 | -100,00 | 0 | -100,00 | ||||
| 2026-02-17 | 13F | Tang Capital Management Llc | 0 | -100,00 | 0 | |||||
| 2026-02-05 | 13F | Allworth Financial LP | 500 | 1 | ||||||
| 2026-02-17 | 13F | Royal Bank Of Canada | 23 | -96,26 | 0 | -100,00 | ||||
| 2026-02-11 | 13F | Resolute Advisors LLC | 89.944 | 0,00 | 146 | -31,92 | ||||
| 2026-02-06 | 13F | Larson Financial Group LLC | 50 | 0,00 | 0 | |||||
| 2026-02-12 | 13F | BlackRock, Inc. | 224.141 | 0,31 | 363 | -31,38 | ||||
| 2026-02-13 | 13F | Fortitude Advisory Group L.L.C. | 38.740 | 0,00 | 63 | -31,87 | ||||
| 2025-11-13 | 13F | Prudential Financial Inc | 0 | -100,00 | 0 | -100,00 | ||||
| 2025-09-26 | NP | FSSNX - Fidelity Small Cap Index Fund This fund is a listed as child fund of Fmr Llc and if that institution has disclosed ownership in this security, then these positions will not be double counted when calculating total shares and total value | 0 | -100,00 | 0 | -100,00 | ||||
| 2026-02-10 | 13F | Acadian Asset Management Llc | 64.875 | 0 | ||||||
| 2026-02-13 | 13F | Jacobs Levy Equity Management, Inc | 0 | -100,00 | 0 | |||||
| 2026-02-11 | 13F | LPL Financial LLC | 11.297 | 18 | ||||||
| 2026-02-17 | 13F | Fmr Llc | 6.808 | -33,23 | 11 | -54,17 | ||||
| 2025-11-14 | 13F | Verition Fund Management LLC | 0 | -100,00 | 0 | |||||
| 2026-01-12 | 13F | Rialto Wealth Management, LLC | 0 | -100,00 | 0 | |||||
| 2026-02-17 | 13F | Bridgeway Capital Management Inc | 395.800 | 102,15 | 641 | 38,15 | ||||
| 2026-02-13 | 13F | Marshall Wace, Llp | 79.136 | 128 | ||||||
| 2026-02-13 | 13F | Squarepoint Ops LLC | 10.594 | 17 | ||||||
| 2026-02-17 | 13F | Point72 Asset Management, L.P. | 26.589 | 43 | ||||||
| 2026-02-12 | 13F | Hrt Financial Lp | 11.091 | -21,32 | 0 | |||||
| 2026-02-12 | 13F | Dimensional Fund Advisors Lp | 13.783 | 22 | ||||||
| 2026-02-17 | 13F | Russell Investments Group, Ltd. | 7.136 | 0,00 | 12 | -31,25 | ||||
| 2026-02-17 | 13F | Bank Of America Corp /de/ | 42 | -99,78 | 0 | -100,00 | ||||
| 2026-02-17 | 13F | Citadel Advisors Llc | 178.172 | 289 | ||||||
| 2026-02-12 | 13F | Principal Securities, Inc. | 0 | -100,00 | 0 | |||||
| 2026-02-13 | 13F | Barclays Plc | 3 | 0,00 | 0 | |||||
| 2025-09-26 | NP | SLPIX - Small-cap Profund Investor Class | 0 | -100,00 | 0 | |||||
| 2026-02-13 | 13F | Wells Fargo & Company/mn | 118.410 | 16,08 | 192 | -20,75 | ||||
| 2025-11-06 | 13F | Sozo Ventures GP II, L.P. | 581.577 | 0,00 | 1.331 | 54,77 | ||||
| 2025-11-14 | 13F | Raymond James Financial Inc | 0 | -100,00 | 0 | |||||
| 2026-02-12 | 13F | Jane Street Group, Llc | 433.859 | 341,56 | 703 | 202,59 | ||||
| 2025-11-14 | 13F | Goldman Sachs Group Inc | 0 | -100,00 | 0 | |||||
| 2026-02-10 | 13F | Bnp Paribas Arbitrage, Sa | 307 | -97,98 | 0 | -100,00 | ||||
| 2026-02-13 | 13F | Panagora Asset Management Inc | 32.580 | 53 | ||||||
| 2026-02-17 | 13F | XTX Topco Ltd | 68.994 | 353,43 | 112 | 208,33 |