Grundlæggende statistik
| Institutionelle ejere | 74 total, 71 long only, 0 short only, 3 long/short - change of -6,41% MRQ |
| Gennemsnitlig porteføljeallokering | 0.0321 % - change of 8,92% MRQ |
| Institutionelle aktier (lange) | 4.171.108 (ex 13D/G) - change of -0,69MM shares -14,12% MRQ |
| Institutionel værdi (lang) | $ 75.140 USD ($1000) |
Institutionelt ejerskab og aktionærer
Mesoblast Limited - Depositary Receipt (Common Stock) (US:MESO) har 74 institutionelle ejere og aktionærer, der har indsendt 13D/G- eller 13F-formularer til Securities Exchange Commission (SEC). Disse institutioner har i alt 4,171,108 aktier. Største aktionærer omfatter Jane Street Group, Llc, Legal & General Group Plc, BlackRock, Inc., Morgan Stanley, Susquehanna International Group, Llp, Citadel Advisors Llc, Susquehanna International Group, Llp, Goldman Sachs Group Inc, Jane Street Group, Llc, and SRS Capital Advisors, Inc. .
Mesoblast Limited - Depositary Receipt (Common Stock) (NasdaqGS:MESO) institutionel ejerskabsstruktur viser aktuelle positioner i virksomheden efter institutioner og fonde, samt seneste ændringer i positionsstørrelse. Større aktionærer kan omfatte individuelle investorer, investeringsforeninger, hedgefonde eller institutioner. Skema 13D angiver, at investoren besidder (eller besidder) mere end 5 % af virksomheden og har til hensigt (eller har til hensigt at) aktivt at forfølge en ændring i forretningsstrategi. Skema 13G indikerer en passiv investering på over 5%.
The share price as of April 17, 2026 is 16,46 / share. Previously, on April 21, 2025, the share price was 10,28 / share. This represents an increase of 60,12% over that period.

Fondens stemningsscore
Fund Sentiment Score (fka Ownership Accumulation Score) finder de aktier, der bliver mest købt af fonde. Det er resultatet af en sofistikeret, multi-faktor kvantitativ model, der identificerer virksomheder med de højeste niveauer af institutionel akkumulering. Scoringsmodellen bruger en kombination af den samlede stigning i oplyste ejere, ændringerne i porteføljeallokeringer i disse ejere og andre målinger. Tallet går fra 0 til 100, hvor højere tal indikerer et højere niveau af akkumulering for sine jævnaldrende, og 50 er gennemsnittet.
Opdateringsfrekvens: Dagligt
Se Ownership Explorer, som giver en liste over højest rangerende virksomheder.
AI+ Ask Fintel’s AI assistant about Mesoblast Limited - Depositary Receipt (Common Stock).
Select a question to share a public post with an AI-crafted answer.
Thinking of good questions…
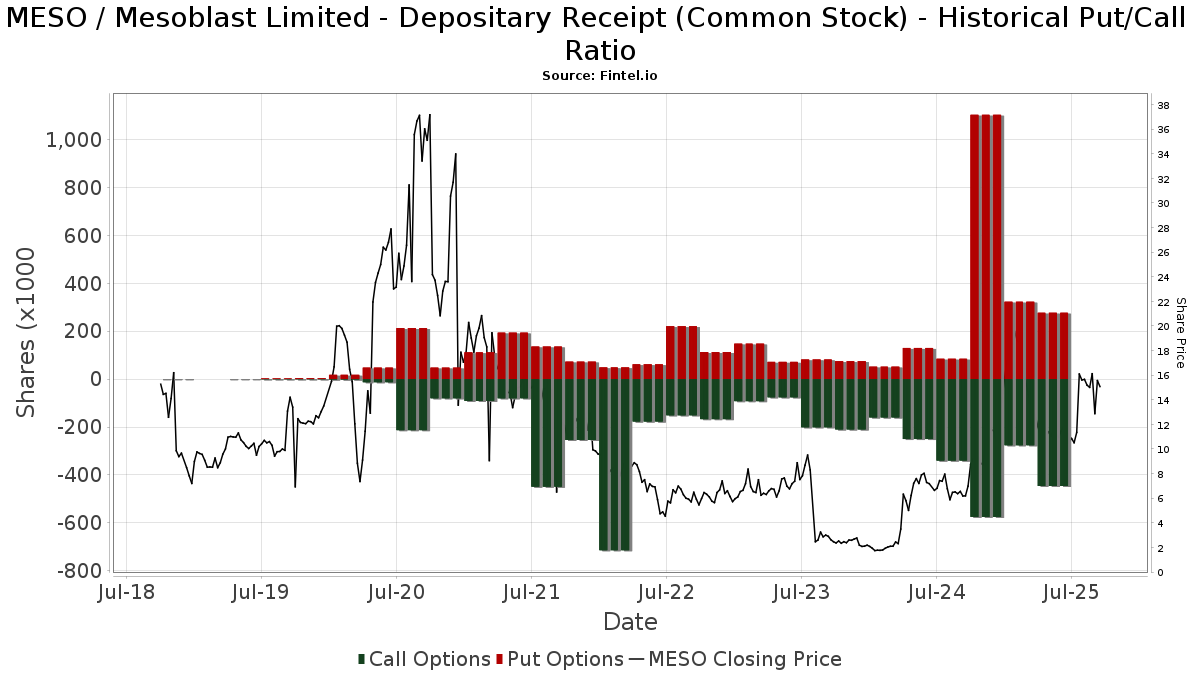
Institutionel Put/Call-forhold
Ud over at indberette standardaktie- og gældsudstedelser skal institutter med mere end 100 mill. aktiver under forvaltning også oplyse deres put- og call-optionsbeholdninger. Da salgsoptioner generelt indikerer negativ stemning, og købsoptioner indikerer positiv stemning, kan vi få en fornemmelse af den overordnede institutionelle stemning ved at plotte forholdet mellem put og kald. Diagrammet til højre viser det historiske put/call-forhold for dette instrument.
Brug af Put/Call Ratio som en indikator for investorernes stemning overvinder en af de vigtigste mangler ved at bruge totalt institutionelt ejerskab, som er, at en betydelig mængde af aktiver under forvaltning investeres passivt for at spore indekser. Passivt forvaltede fonde køber typisk ikke optioner, så indikatoren for put/call-forholdet følger mere nøje følelsen af aktivt forvaltede fonde.
13D/G-arkivering
Vi præsenterer 13D/G ansøgninger separat fra 13F ansøgninger på grund af den forskellige behandling af SEC. 13D/G-ansøgninger kan indgives af grupper af investorer (med én ledende), hvorimod 13F-ansøgninger ikke kan. Dette resulterer i situationer, hvor en investor kan indsende en 13D/G, der rapporterer én værdi for de samlede aktier (der repræsenterer alle de aktier, der ejes af investorgruppen), men derefter indsender en 13F, der rapporterer en anden værdi for de samlede aktier (der udelukkende repræsenterer deres egne) ejendomsret). Det betyder, at aktieejerskab af 13D/G-arkiver og 13F-arkiveringer ofte ikke er direkte sammenlignelige, så vi præsenterer dem separat.
Bemærk: Fra den 16. maj 2021 viser vi ikke længere ejere, der ikke har indsendt en 13D/G inden for det seneste år. Tidligere viste vi den fulde historie af 13D/G-arkiver. Generelt skal enheder, der er forpligtet til at indgive 13D/G-ansøgninger, indgive mindst årligt, før de indsender en afsluttende ansøgning. Dog forlader fonde nogle gange positioner uden at indsende en afsluttende ansøgning (dvs. de afvikler), så visning af den fulde historie resulterede nogle gange i forvirring om det nuværende ejerskab. For at undgå forvirring viser vi nu kun 'aktuelle' ejere - det vil sige - ejere, der har anmeldt inden for det seneste år.
Upgrade to unlock premium data.
| Fil dato | Form | Investor | Forrige Aktier |
Seneste Aktier |
Δ Aktier (Procent) |
Ejendomsret (Procent) |
Δ Ejerskab (Procent) |
|
|---|---|---|---|---|---|---|---|---|
| 2025-09-16 | Gueck William J. | 64,521,900 | 5.00 |
13F og NPORT arkivering
Detaljer om 13F-arkivering er gratis. Detaljer om NP-ansøgninger kræver et premium-medlemskab. Grønne rækker angiver nye positioner. Røde rækker angiver lukkede positioner. Klik på linket ikon for at se den fulde transaktionshistorik.
Opgrader
for at låse premium-data op og eksportere til Excel ![]() .
.
| Fil dato | Kilde | Investor | Type | Gennemsnitlig pris (Øst) |
Aktier | Δ Aktier (%) |
Rapporteret Værdi ($1000) |
Δ Værdi (%) |
Port Alloc (%) |
|
|---|---|---|---|---|---|---|---|---|---|---|
| 2026-02-12 | 13F | BRYN MAWR TRUST Co | 0 | -100,00 | 0 | -100,00 | ||||
| 2025-11-14 | 13F | Raymond James Financial Inc | 0 | -100,00 | 0 | -100,00 | ||||
| 2026-02-04 | 13F | Rockbridge Investment Management, LCC | 0 | -100,00 | 0 | |||||
| 2026-02-17 | 13F | Advisory Services Network, LLC | 0 | -100,00 | 0 | |||||
| 2025-11-12 | 13F | Group One Trading, L.p. | 0 | -100,00 | 0 | |||||
| 2026-02-13 | 13F | SRS Capital Advisors, Inc. | 166.482 | -16,81 | 3.003 | -7,09 | ||||
| 2026-02-17 | 13F | Citadel Advisors Llc | 131.388 | 2.370 | ||||||
| 2026-02-17 | 13F | Citadel Advisors Llc | Put | 31.100 | -52,95 | 561 | -47,27 | |||
| 2026-02-17 | 13F | Citadel Advisors Llc | Call | 468.100 | 103,70 | 8.445 | 128,09 | |||
| 2026-02-17 | 13F | Advisor Group Holdings, Inc. | 1.467 | -0,47 | 26 | 13,04 | ||||
| 2025-11-14 | 13F | Oasis Management Co Ltd. | 0 | -100,00 | 0 | -100,00 | ||||
| 2026-02-11 | 13F | Simplex Trading, Llc | 0 | -100,00 | 0 | |||||
| 2026-02-17 | 13F | Tower Research Capital LLC (TRC) | 1.033 | -68,68 | 19 | -66,04 | ||||
| 2026-04-15 | 13F | Gf Fund Management Co. Ltd. | 1.093 | 13,38 | 17 | -5,88 | ||||
| 2026-01-23 | 13F | Rsm Us Wealth Management Llc | 12.225 | 15,06 | 227 | 32,75 | ||||
| 2026-02-17 | 13F | Susquehanna International Group, Llp | 429.844 | 58,33 | 7.754 | 77,32 | ||||
| 2026-02-03 | 13F | Ballentine Partners, LLC | 11.136 | -3,42 | 201 | 8,11 | ||||
| 2026-02-12 | 13F | Rossby Financial, LCC | 80 | 0,00 | 1 | 0,00 | ||||
| 2026-02-13 | 13F | Citigroup Inc | 26.398 | 1,07 | 476 | 13,33 | ||||
| 2026-03-12 | 13F/A | Peak6 Llc | Call | 50.000 | 902 | |||||
| 2026-02-10 | 13F | Goldman Sachs Group Inc | Call | 0 | -100,00 | 0 | -100,00 | |||
| 2026-02-17 | 13F | Susquehanna International Group, Llp | Put | 105.300 | 36,22 | 1.900 | 52,53 | |||
| 2026-02-17 | 13F | Susquehanna International Group, Llp | Call | 538.600 | 144,71 | 9.716 | 174,08 | |||
| 2026-02-17 | 13F | Wiley Bros.-aintree Capital, Llc | 18.512 | 334 | ||||||
| 2026-04-07 | 13F | Farther Finance Advisors, LLC | 640 | 60,00 | 10 | 42,86 | ||||
| 2026-02-12 | 13F | Polen Capital Management Llc | 23.005 | 415 | ||||||
| 2026-04-14 | 13F | Nbc Securities, Inc. | 0 | -100,00 | 0 | |||||
| 2026-02-10 | 13F | Bnp Paribas Arbitrage, Sa | 1.021 | 70,17 | 18 | 100,00 | ||||
| 2026-02-12 | 13F | Steward Partners Investment Advisory, Llc | 128 | 0,00 | 2 | 0,00 | ||||
| 2026-02-11 | 13F | Parallel Advisors, LLC | 1.191 | 7,01 | 21 | 23,53 | ||||
| 2026-01-29 | 13F | China Universal Asset Management Co., Ltd. | 7.992 | -3,43 | 144 | 8,27 | ||||
| 2026-02-06 | 13F | Pnc Financial Services Group, Inc. | 3 | 0 | ||||||
| 2026-02-09 | 13F | Geode Capital Management, Llc | 30.737 | 0,00 | 554 | 11,92 | ||||
| 2026-01-30 | 13F | Us Bancorp \de\ | 410 | 0,00 | 7 | 16,67 | ||||
| 2026-02-09 | 13F | Legal & General Group Plc | 679.023 | 4,24 | 12.237 | 16,53 | ||||
| 2026-02-17 | 13F | Creative Planning | 12.759 | 3,45 | 230 | 16,16 | ||||
| 2026-02-17 | 13F | Royal Bank Of Canada | 21.439 | -76,56 | 387 | -73,73 | ||||
| 2025-11-14 | 13F | Cubist Systematic Strategies, LLC | 0 | -100,00 | 0 | -100,00 | ||||
| 2026-01-26 | 13F | BCS Private Wealth Management, Inc. | 16.000 | 289 | ||||||
| 2026-02-10 | 13F | Goldman Sachs Group Inc | 395.850 | -2,81 | 7.141 | 8,84 | ||||
| 2026-02-13 | 13F | MAI Capital Management | 50 | 0,00 | 1 | |||||
| 2026-02-12 | 13F | Principal Securities, Inc. | 0 | -100,00 | 0 | |||||
| 2026-02-11 | 13F | LPL Financial LLC | 48.747 | -2,21 | 879 | 9,46 | ||||
| 2026-02-11 | 13F | LPL Financial LLC | Call | 10.000 | 0,00 | 180 | 11,80 | |||
| 2026-02-13 | 13F | Parkside Financial Bank & Trust | 4.530 | 0,67 | 82 | 12,50 | ||||
| 2026-02-13 | 13F | Marshall Wace, Llp | 15.828 | 286 | ||||||
| 2026-02-12 | 13F | Jane Street Group, Llc | Call | 942.800 | 98,36 | 17.008 | 122,12 | |||
| 2026-02-17 | 13F | Point72 Asset Management, L.P. | 38.185 | 689 | ||||||
| 2026-02-12 | 13F | Jane Street Group, Llc | 167.380 | 311,54 | 3.020 | 360,92 | ||||
| 2026-01-29 | 13F | Sanctuary Advisors, LLC | 0 | -100,00 | 0 | -100,00 | ||||
| 2026-02-12 | 13F | Jane Street Group, Llc | Put | 11.300 | -67,90 | 204 | -64,20 | |||
| 2026-02-13 | 13F | Caitong International Asset Management Co., Ltd | 1.900 | 34 | ||||||
| 2026-02-13 | 13F | Rhumbline Advisers | 7.731 | 50,88 | 139 | 69,51 | ||||
| 2026-01-27 | 13F | WealthCollab, LLC | 73 | 0,00 | 1 | 0,00 | ||||
| 2025-11-04 | 13F | Strengthening Families & Communities, LLC | 0 | -100,00 | 0 | |||||
| 2026-04-20 | 13F | Ronald Blue Trust, Inc. | 1.002 | 1.001,10 | 15 | |||||
| 2026-02-17 | 13F | XTX Topco Ltd | 12.503 | -20,62 | 226 | -11,07 | ||||
| 2026-02-13 | 13F | Morgan Stanley | 596.952 | 28,16 | 10.769 | 43,51 | ||||
| 2026-02-17 | 13F | Two Sigma Investments, Lp | 57.561 | 122,68 | 1.038 | 149,52 | ||||
| 2026-01-27 | 13F | Zurcher Kantonalbank (Zurich Cantonalbank) | 384 | 0,00 | 7 | 0,00 | ||||
| 2026-02-06 | 13F | Fi3 FINANCIAL ADVISORS, LLC | 42.015 | 0,00 | 758 | 11,98 | ||||
| 2026-04-15 | 13F | Compagnie Lombard Odier SCmA | 0 | -100,00 | 0 | |||||
| 2026-04-07 | 13F | Signaturefd, Llc | 6.544 | -16,96 | 101 | -29,58 | ||||
| 2026-02-17 | 13F | Aqr Capital Management Llc | 25.215 | 80,46 | 455 | 101,78 | ||||
| 2025-11-13 | 13F | Summit X, LLC | 0 | -100,00 | 0 | |||||
| 2026-01-29 | 13F | UMA Financial Services, Inc. | 49 | 0,00 | 1 | |||||
| 2026-01-12 | 13F | Rialto Wealth Management, LLC | 46.500 | 839 | ||||||
| 2026-02-13 | 13F | Tobias Financial Advisors, Inc. | 13.828 | 38,28 | 249 | 54,66 | ||||
| 2026-01-29 | 13F | Concurrent Investment Advisors, LLC | 0 | -100,00 | 0 | |||||
| 2025-11-12 | 13F | R Squared Ltd | 0 | -100,00 | 0 | -100,00 | ||||
| 2026-02-17 | 13F | Jones Financial Companies Lllp | 300 | 0,00 | 5 | 25,00 | ||||
| 2026-02-17 | 13F | Quadrature Capital Ltd | 26.566 | 479 | ||||||
| 2026-01-06 | 13F | Penbrook Management LLC | 87.575 | -0,11 | 1.580 | 11,83 | ||||
| 2026-01-26 | 13F | Mirae Asset Global Investments Co., Ltd. | 2.383 | 30,58 | 43 | 44,83 | ||||
| 2026-03-27 | 13F | Prosperity Wealth Management, Inc. | 50.900 | 1,90 | 918 | 14,18 | ||||
| 2026-02-17 | 13F/A | Cantor Fitzgerald, L. P. | 0 | -100,00 | 0 | -100,00 | ||||
| 2026-02-03 | 13F | SBI Securities Co., Ltd. | 100 | 2.400,00 | 2 | |||||
| 2025-11-14 | 13F | Millennium Management Llc | 0 | -100,00 | 0 | |||||
| 2026-01-29 | 13F/A | Lazari Capital Management, Inc. | 46.121 | -1,18 | 832 | 10,79 | ||||
| 2025-11-14 | 13F | Verition Fund Management LLC | 0 | -100,00 | 0 | |||||
| 2026-02-13 | 13F | National Bank Of Canada /fi/ | 525 | 0,00 | 9 | 12,50 | ||||
| 2026-02-12 | 13F | Quadrant Capital Group Llc | 6.796 | -3,34 | 123 | 7,96 | ||||
| 2026-02-06 | 13F | EverSource Wealth Advisors, LLC | 128 | 0,00 | 2 | 0,00 | ||||
| 2025-11-12 | 13F | Cambridge Investment Research Advisors, Inc. | 0 | -100,00 | 0 | |||||
| 2026-02-05 | 13F | Allworth Financial LP | 222 | 2,78 | 4 | 33,33 | ||||
| 2026-02-17 | 13F | SageView Advisory Group, LLC | 11 | 0 | ||||||
| 2026-02-12 | 13F | BlackRock, Inc. | 676.365 | 25,16 | 12.202 | 40,14 | ||||
| 2026-02-11 | 13F | Deutsche Bank Ag\ | 1.168 | -19,78 | 21 | -8,70 | ||||
| 2026-02-11 | 13F | Jpmorgan Chase & Co | 3.200 | 13,03 | 58 | 26,67 | ||||
| 2026-02-13 | 13F | Pine Valley Investments Ltd Liability Co | 0 | -100,00 | 0 | |||||
| 2026-02-06 | 13F/A | Rathbone Brothers plc | 14.017 | 0,00 | 253 | 12,00 | ||||
| 2026-02-10 | 13F | Daiwa Securities Group Inc. | 105 | 0,00 | 0 | |||||
| 2026-02-13 | 13F | Barclays Plc | 1.180 | 118,11 | 21 | 162,50 | ||||
| 2026-02-13 | 13F | Squarepoint Ops LLC | 18.579 | -41,31 | 335 | -34,18 | ||||
| 2026-01-14 | 13F | Jfs Wealth Advisors, Llc | 3.335 | 0,00 | 60 | 13,21 | ||||
| 2026-02-12 | 13F | Skopos Labs, Inc. | 0 | -100,00 | 0 | |||||
| 2026-02-13 | 13F | Wells Fargo & Company/mn | 18.093 | -30,42 | 326 | -22,01 | ||||
| 2026-02-17 | 13F | Bank Of America Corp /de/ | 14.116 | -87,34 | 255 | -85,85 | ||||
| 2026-02-13 | 13F | Visionary Wealth Advisors | 10.325 | -5,28 | 186 | 6,29 | ||||
| 2026-01-29 | 13F | UBS Group AG | 72.560 | -61,24 | 1.309 | -56,62 | ||||
| 2025-11-14 | 13F | Marex Group plc | Put | 0 | -100,00 | 0 | -100,00 | |||
| 2025-11-14 | 13F | Marex Group plc | 0 | -100,00 | 0 | -100,00 | ||||
| 2026-02-13 | 13F | JustInvest LLC | 14.829 | 5,57 | 268 | 18,14 | ||||
| 2026-04-06 | 13F | GAMMA Investing LLC | 6.497 | -14,50 | 100 | -27,74 | ||||
| 2026-02-17 | 13F | Opal Capital Llc | 18.279 | 307 |
Other Listings
| DE:LWB1 | 13,50 € |