Grundlæggende statistik
| Institutionelle ejere | 94 total, 92 long only, 0 short only, 2 long/short - change of 14,29% MRQ |
| Gennemsnitlig porteføljeallokering | 0.3443 % - change of -18,67% MRQ |
| Institutionelle aktier (lange) | 5.071.611 (ex 13D/G) - change of 0,18MM shares 3,73% MRQ |
| Institutionel værdi (lang) | $ 256.691 USD ($1000) |
Institutionelt ejerskab og aktionærer
PIMCO ETF Trust - PIMCO 15+ Year U.S. TIPS Index Exchange-Traded Fund (US:LTPZ) har 94 institutionelle ejere og aktionærer, der har indsendt 13D/G- eller 13F-formularer til Securities Exchange Commission (SEC). Disse institutioner har i alt 5,071,611 aktier. Største aktionærer omfatter CENTRAL TRUST Co, Evoke Wealth, Llc, Wells Fargo & Company/mn, Avos Capital Management, LLC, Northern Trust Corp, Wealthedge Investment Advisors, Llc, Altfest L J & Co Inc, Mid-American Wealth Advisory Group, Inc., Sovran Advisors, LLC, and Fermata Advisors, LLC .
PIMCO ETF Trust - PIMCO 15+ Year U.S. TIPS Index Exchange-Traded Fund (ARCA:LTPZ) institutionel ejerskabsstruktur viser aktuelle positioner i virksomheden efter institutioner og fonde, samt seneste ændringer i positionsstørrelse. Større aktionærer kan omfatte individuelle investorer, investeringsforeninger, hedgefonde eller institutioner. Skema 13D angiver, at investoren besidder (eller besidder) mere end 5 % af virksomheden og har til hensigt (eller har til hensigt at) aktivt at forfølge en ændring i forretningsstrategi. Skema 13G indikerer en passiv investering på over 5%.
The share price as of March 26, 2026 is 50,94 / share. Previously, on March 27, 2025, the share price was 54,01 / share. This represents a decline of 5,68% over that period.

Fondens stemningsscore
Fund Sentiment Score (fka Ownership Accumulation Score) finder de aktier, der bliver mest købt af fonde. Det er resultatet af en sofistikeret, multi-faktor kvantitativ model, der identificerer virksomheder med de højeste niveauer af institutionel akkumulering. Scoringsmodellen bruger en kombination af den samlede stigning i oplyste ejere, ændringerne i porteføljeallokeringer i disse ejere og andre målinger. Tallet går fra 0 til 100, hvor højere tal indikerer et højere niveau af akkumulering for sine jævnaldrende, og 50 er gennemsnittet.
Opdateringsfrekvens: Dagligt
Se Ownership Explorer, som giver en liste over højest rangerende virksomheder.
AI+ Ask Fintel’s AI assistant about PIMCO ETF Trust - PIMCO 15+ Year U.S. TIPS Index Exchange-Traded Fund.
Select a question to share a public post with an AI-crafted answer.
Thinking of good questions…
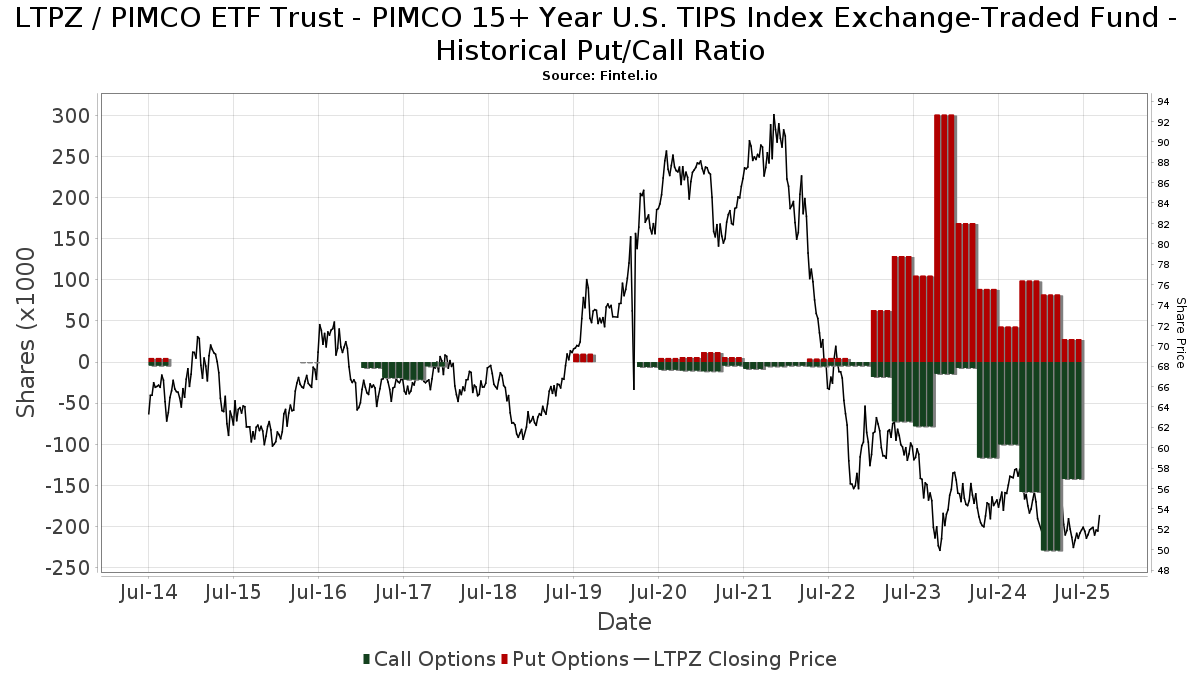
Institutionel Put/Call-forhold
Ud over at indberette standardaktie- og gældsudstedelser skal institutter med mere end 100 mill. aktiver under forvaltning også oplyse deres put- og call-optionsbeholdninger. Da salgsoptioner generelt indikerer negativ stemning, og købsoptioner indikerer positiv stemning, kan vi få en fornemmelse af den overordnede institutionelle stemning ved at plotte forholdet mellem put og kald. Diagrammet til højre viser det historiske put/call-forhold for dette instrument.
Brug af Put/Call Ratio som en indikator for investorernes stemning overvinder en af de vigtigste mangler ved at bruge totalt institutionelt ejerskab, som er, at en betydelig mængde af aktiver under forvaltning investeres passivt for at spore indekser. Passivt forvaltede fonde køber typisk ikke optioner, så indikatoren for put/call-forholdet følger mere nøje følelsen af aktivt forvaltede fonde.
13F og NPORT arkivering
Detaljer om 13F-arkivering er gratis. Detaljer om NP-ansøgninger kræver et premium-medlemskab. Grønne rækker angiver nye positioner. Røde rækker angiver lukkede positioner. Klik på linket ikon for at se den fulde transaktionshistorik.
Opgrader
for at låse premium-data op og eksportere til Excel ![]() .
.
| Fil dato | Kilde | Investor | Type | Gennemsnitlig pris (Øst) |
Aktier | Δ Aktier (%) |
Rapporteret Værdi ($1000) |
Δ Værdi (%) |
Port Alloc (%) |
|
|---|---|---|---|---|---|---|---|---|---|---|
| 2026-01-28 | 13F | Geneos Wealth Management Inc. | 29 | -40,82 | 1 | -50,00 | ||||
| 2026-02-02 | 13F | CENTRAL TRUST Co | 713.172 | 6,35 | 36.907 | 3,30 | ||||
| 2026-02-17 | 13F | Private Advisor Group, LLC | 22.370 | 2,40 | 1.158 | -0,52 | ||||
| 2026-02-06 | 13F | Envestnet Portfolio Solutions, Inc. | 41.017 | 315,61 | 2.123 | 304,19 | ||||
| 2026-02-13 | 13F | Winter & Associates, Inc. | 11.538 | 597 | ||||||
| 2026-02-18 | 13F | Kastel Capital Advisors, LLC | 4.105 | 212 | ||||||
| 2026-01-12 | 13F | Focus Financial Network, Inc. | 48.213 | 6,86 | 2.505 | 4,20 | ||||
| 2026-02-12 | 13F | SVRN Asset Management, LLC | 20.933 | 1.083 | ||||||
| 2025-10-28 | 13F | Wolff Wiese Magana Llc | 0 | -100,00 | 0 | |||||
| 2026-01-29 | 13F | Comerica Bank | 149 | 0,00 | 8 | 0,00 | ||||
| 2026-02-17 | 13F | WFA of San Diego, LLC | 0 | -100,00 | 0 | |||||
| 2025-10-07 | 13F | Proathlete Wealth Management Llc | 0 | -100,00 | 0 | |||||
| 2026-02-14 | 13F | Rockefeller Capital Management L.P. | 9.343 | 48,37 | 484 | 44,18 | ||||
| 2026-01-26 | 13F/A | LifeWealth Investments, LLC | 0 | -100,00 | 0 | |||||
| 2025-11-14 | 13F | Gts Securities Llc | 0 | -100,00 | 0 | -100,00 | ||||
| 2026-02-04 | 13F | Hirtle Callaghan & Co LLC | 3.472 | 10,78 | ||||||
| 2026-01-22 | 13F | Comprehensive Money Management Services LLC | 8.585 | 17,93 | 444 | 14,73 | ||||
| 2026-02-06 | 13F | Signature Estate & Investment Advisors Llc | 0 | -100,00 | 0 | |||||
| 2026-02-11 | 13F | Gwn Securities Inc. | 4.573 | 237 | ||||||
| 2026-02-13 | 13F | Flow Traders U.s. Llc | 105.575 | 5 | ||||||
| 2026-01-26 | 13F | AE Wealth Management LLC | 65.518 | -1,81 | 3.391 | -4,64 | ||||
| 2026-02-17 | 13F | Northern Trust Corp | 288.596 | -18,31 | 14.935 | -20,65 | ||||
| 2026-02-10 | 13F | MGO Private Wealth, LLC | 24.337 | -0,03 | 1.259 | -2,93 | ||||
| 2026-02-17 | 13F | Advisory Services Network, LLC | 4.348 | -19,17 | 225 | -21,33 | ||||
| 2026-02-13 | 13F | AlTi Global, Inc. | 0 | -100,00 | 0 | |||||
| 2026-02-13 | 13F | Balanced Rock Investment Advisor | 59.324 | 5,72 | 3.070 | 2,71 | ||||
| 2026-02-06 | 13F | Lloyd Advisory Services, LLC. | 50.294 | 6,60 | 2.603 | 3,54 | ||||
| 2026-01-26 | 13F | United Advisor Group, LLC | 5.000 | 0,00 | 259 | -3,01 | ||||
| 2026-02-02 | 13F | GenTrust, LLC | 10.163 | 23,49 | 528 | 20,32 | ||||
| 2026-02-12 | 13F | Principal Securities, Inc. | 0 | -100,00 | 0 | -100,00 | ||||
| 2026-02-06 | 13F | Evoke Wealth, Llc | 663.471 | -14,12 | 34.467 | -16,26 | ||||
| 2026-02-17 | 13F | Cetera Investment Advisers | 9.892 | -27,35 | 512 | -29,52 | ||||
| 2026-01-21 | 13F | Modera Wealth Management, LLC | 4.757 | 0,00 | 246 | -2,77 | ||||
| 2026-02-06 | 13F | IFP Advisors, Inc | 3.500 | 0,00 | 181 | -2,69 | ||||
| 2026-01-14 | 13F | Sjbenen Advisory, Llc | 79.686 | 4.124 | ||||||
| 2026-02-06 | 13F | Forefront Wealth Partners, LLC | 0 | -100,00 | 0 | |||||
| 2026-02-10 | 13F | IFG Advisory, LLC | 10.588 | 548 | ||||||
| 2026-02-17 | 13F | Wealthedge Investment Advisors, Llc | 256.073 | -4,05 | 13.252 | -6,81 | ||||
| 2026-02-13 | 13F | Smartleaf Asset Management LLC | 0 | 0 | ||||||
| 2025-11-14 | 13F | First Manhattan Co | 0 | -100,00 | 0 | |||||
| 2026-02-06 | 13F | Private Wealth Advisors, LLC | 42.934 | -7,86 | 2.222 | -10,52 | ||||
| 2026-01-13 | 13F | Avaii Wealth Management, Llc | 4.876 | -7,12 | 252 | -9,68 | ||||
| 2025-11-12 | 13F | Ameriflex Group, Inc. | 0 | -100,00 | 0 | |||||
| 2026-02-11 | 13F | Simplex Trading, Llc | 1.690 | 87 | ||||||
| 2026-02-17 | 13F | North Capital, Inc. | 0 | -100,00 | 0 | |||||
| 2026-02-10 | 13F | Envestnet Asset Management Inc | 12.219 | -58,06 | 632 | -59,28 | ||||
| 2026-02-11 | 13F | Nemes Rush Group LLC | 227 | 12 | ||||||
| 2026-02-17 | 13F | Raymond James Financial Inc | 4.310 | -33,97 | 223 | -35,73 | ||||
| 2026-02-06 | 13F | Creative Financial Designs Inc /adv | 192 | 1,05 | 10 | -10,00 | ||||
| 2026-02-11 | 13F | Parallel Advisors, LLC | 159 | -5,36 | 8 | 0,00 | ||||
| 2025-11-12 | 13F | Transce3nd, LLC | 0 | -100,00 | 0 | |||||
| 2026-02-12 | 13F | Litman Gregory Asset Management LLC | 610 | 32 | ||||||
| 2026-01-22 | 13F | Iron Financial, LLC | 22.199 | 0,42 | 1.149 | -2,46 | ||||
| 2026-02-13 | 13F | MAI Capital Management | 0 | -100,00 | 0 | |||||
| 2026-01-23 | 13F | Altfest L J & Co Inc | 211.750 | 62,92 | 10.958 | 58,24 | ||||
| 2026-02-17 | 13F | Royal Bank Of Canada | 8.301 | -3,41 | 430 | -6,11 | ||||
| 2025-11-13 | 13F | Quadrature Capital Ltd | 0 | -100,00 | 0 | |||||
| 2026-02-10 | 13F | Evolution Wealth Management Inc. | 2.887 | 30,63 | 149 | 27,35 | ||||
| 2026-02-03 | 13F | International Assets Investment Management, Llc | 1.334 | 69 | ||||||
| 2026-02-13 | 13F | Morgan Stanley | 49.591 | -29,89 | 2.566 | -31,90 | ||||
| 2026-02-11 | 13F | Buckingham Strategic Partners | 11.538 | -62,97 | 597 | -64,04 | ||||
| 2026-02-17 | 13F | Qube Research & Technologies Ltd | 84 | -23,64 | 4 | -20,00 | ||||
| 2026-02-17 | 13F | Advisor Group Holdings, Inc. | 73.767 | -1,90 | 3.817 | -4,69 | ||||
| 2026-02-17 | 13F | Susquehanna International Group, Llp | 7.002 | 362 | ||||||
| 2026-02-17 | 13F | Susquehanna International Group, Llp | Put | 39.500 | 73,25 | 2.044 | 68,37 | |||
| 2026-02-05 | 13F | Bessemer Group Inc | 0 | -100,00 | 0 | |||||
| 2026-01-23 | 13F | Mid-American Wealth Advisory Group, Inc. | 192.125 | 0,66 | 9.942 | -2,23 | ||||
| 2026-02-17 | 13F | Susquehanna International Group, Llp | Call | 67.100 | 74,29 | 3.472 | 69,28 | |||
| 2026-01-23 | 13F | Farther Finance Advisors, LLC | 32 | 0,00 | 2 | 0,00 | ||||
| 2026-02-13 | 13F | Kestra Advisory Services, LLC | 0 | -100,00 | 0 | |||||
| 2026-02-13 | 13F | Atlas Capital Advisors Llc | 4.540 | 19,47 | 235 | 17,59 | ||||
| 2026-02-12 | 13F | Commonwealth Equity Services, Llc | 9.208 | 476 | ||||||
| 2025-11-03 | 13F | Addison Capital Co | 0 | -100,00 | 0 | |||||
| 2026-02-06 | 13F | Tortoise Investment Management, LLC | 55.967 | 6,74 | 2.896 | 3,69 | ||||
| 2026-01-29 | 13F | UBS Group AG | 43.930 | -21,54 | 2.273 | -23,80 | ||||
| 2026-02-13 | 13F | Avos Capital Management, LLC | 345.686 | 2,89 | 17.889 | -0,07 | ||||
| 2026-01-30 | 13F | Torren Management, LLC | 52.852 | 2.735 | ||||||
| 2026-02-06 | 13F | Kingdom Financial Group LLC. | 2.112 | 109 | ||||||
| 2026-01-27 | 13F | Elevated Capital Advisors, LLC | 21.707 | -1,96 | 1.123 | -4,75 | ||||
| 2026-02-13 | 13F | Global Endowment Management, LP | 30.000 | 0,00 | 1.553 | -2,82 | ||||
| 2026-02-17 | 13F | Tower Research Capital LLC (TRC) | 42.349 | 478,62 | 2.192 | 463,24 | ||||
| 2026-02-02 | 13F | Eq Wealth Advisors, Llc | 51 | 3 | ||||||
| 2026-02-12 | 13F | Steward Partners Investment Advisory, Llc | 95 | 1,06 | 5 | 0,00 | ||||
| 2026-02-17 | 13F | Citadel Advisors Llc | Put | 15.700 | 35,34 | 812 | 31,39 | |||
| 2026-02-17 | 13F | Citadel Advisors Llc | 60.064 | 511,96 | 3.108 | 495,40 | ||||
| 2026-03-25 | 13F/A | Lifetime Wealth Management P.C. | 16.329 | 845 | ||||||
| 2026-02-17 | 13F | Citadel Advisors Llc | Call | 38.400 | -38,85 | 1.987 | -40,60 | |||
| 2026-02-17 | 13F | Greenline Partners, LLC | 29.339 | -0,20 | 1.518 | -3,07 | ||||
| 2026-01-29 | 13F | Quest 10 Wealth Builders, Inc. | 567 | 4,81 | 29 | 3,57 | ||||
| 2026-01-30 | 13F | Us Bancorp \de\ | 37.642 | 426,90 | 1.948 | 412,37 | ||||
| 2026-02-05 | 13F | Aegis Wealth Management, Inc. | 4.468 | 231 | ||||||
| 2026-02-27 | 13F/A | Howard Bailey Securities, Llc | 0 | -100,00 | 0 | |||||
| 2026-01-21 | 13F | Baker Ellis Asset Management LLC | 4.710 | 23,95 | 244 | 20,30 | ||||
| 2026-01-23 | 13F | Eagle Bay Advisors LLC | 563 | 29 | ||||||
| 2025-11-14 | 13F | Redwood Park Advisors LLC | 0 | -100,00 | 0 | |||||
| 2026-01-22 | 13F | Networth Advisors, LLC | 373 | 19 | ||||||
| 2026-01-30 | 13F | Ares Financial Consulting, LLC | 59.941 | 3.102 | ||||||
| 2026-02-11 | 13F | LPL Financial LLC | 36.356 | -0,62 | 1.881 | -3,49 | ||||
| 2026-02-10 | 13F | Greenwich Wealth Management LLC | 5.523 | 13,15 | 0 | |||||
| 2026-01-22 | 13F | Yoder Wealth Management, Inc. | 114.471 | 2,62 | 5.924 | -0,34 | ||||
| 2026-02-13 | 13F | Ubs Asset Management Americas Inc | 700 | 36 | ||||||
| 2026-01-09 | 13F | Dynamic Advisor Solutions LLC | 12.561 | 7,11 | 650 | 4,17 | ||||
| 2026-02-17 | 13F | Ancora Advisors, LLC | 44.830 | 0,00 | 2.320 | -2,89 | ||||
| 2026-02-13 | 13F | Kilter Group LLC | 6 | -68,42 | 0 | -100,00 | ||||
| 2026-02-13 | 13F | SRS Capital Advisors, Inc. | 0 | -100,00 | 0 | |||||
| 2026-02-17 | 13F | Edmond De Rothschild Holding S.a. | 871 | 0,00 | 45 | -2,17 | ||||
| 2026-02-13 | 13F | Wells Fargo & Company/mn | 401.466 | -13,01 | 20.776 | -15,50 | ||||
| 2026-02-12 | 13F | Jane Street Group, Llc | 52.350 | 393,40 | 2.709 | 379,47 | ||||
| 2026-02-13 | 13F | Stifel Financial Corp | 5.439 | 281 | ||||||
| 2026-02-17 | 13F | Bank Of America Corp /de/ | 21.496 | -31,92 | 1.112 | -33,89 | ||||
| 2026-02-17 | 13F | Jones Financial Companies Lllp | 3.770 | 169,67 | 195 | 163,51 | ||||
| 2026-02-10 | 13F | Goldman Sachs Group Inc | 21.444 | 131,93 | 1.110 | 125,41 | ||||
| 2026-02-05 | 13F | Northwestern Mutual Wealth Management Co | 11.387 | 15.287,84 | 365 | 12.033,33 | ||||
| 2025-11-05 | 13F | Authentikos Wealth Advisory, LLC | 0 | -100,00 | 0 | |||||
| 2026-02-13 | 13F | Mml Investors Services, Llc | 23.702 | 7,63 | 1.227 | 4,52 | ||||
| 2025-11-12 | 13F | Park Square Financial Group, LLC | 0 | -100,00 | 0 | |||||
| 2026-01-16 | 13F | Vanguard Capital Wealth Advisors This fund is a listed as child fund of Vanguard Group Inc and if that institution has disclosed ownership in this security, then these positions will not be double counted when calculating total shares and total value | 9.169 | -4,60 | 474 | -7,42 | ||||
| 2026-01-20 | 13F | Steel Peak Wealth Management LLC | 7.526 | 391 | ||||||
| 2026-01-30 | 13F | Bogart Wealth, LLC | 0 | -100,00 | 0 | |||||
| 2026-02-05 | 13F | Plante Moran Financial Advisors, LLC | 1 | 0 | ||||||
| 2026-01-28 | 13F | Salomon & Ludwin, LLC | 0 | -100,00 | 0 | |||||
| 2026-01-16 | 13F | Ronald Blue Trust, Inc. | 0 | -100,00 | 0 | |||||
| 2026-01-06 | 13F | Nelson, Van Denburg & Campbell Wealth Management Group, LLC | 6.130 | -11,00 | 317 | -13,62 | ||||
| 2026-01-08 | 13F | Fermata Advisors, LLC | 134.241 | 6,08 | 6.947 | 3,03 | ||||
| 2026-02-09 | 13F | Texas Capital Bank Wealth Management Services Inc | 4.045 | 209 | ||||||
| 2026-01-20 | 13F | Sovran Advisors, LLC | 158.658 | -8,48 | 8.311 | -10,93 |