Grundlæggende statistik
| Institutionelle aktier (lange) | 44.492.547 - 79,75% (ex 13D/G) - change of -6,98MM shares -13,56% MRQ |
| Institutionel værdi (lang) | $ 1.610.773 USD ($1000) |
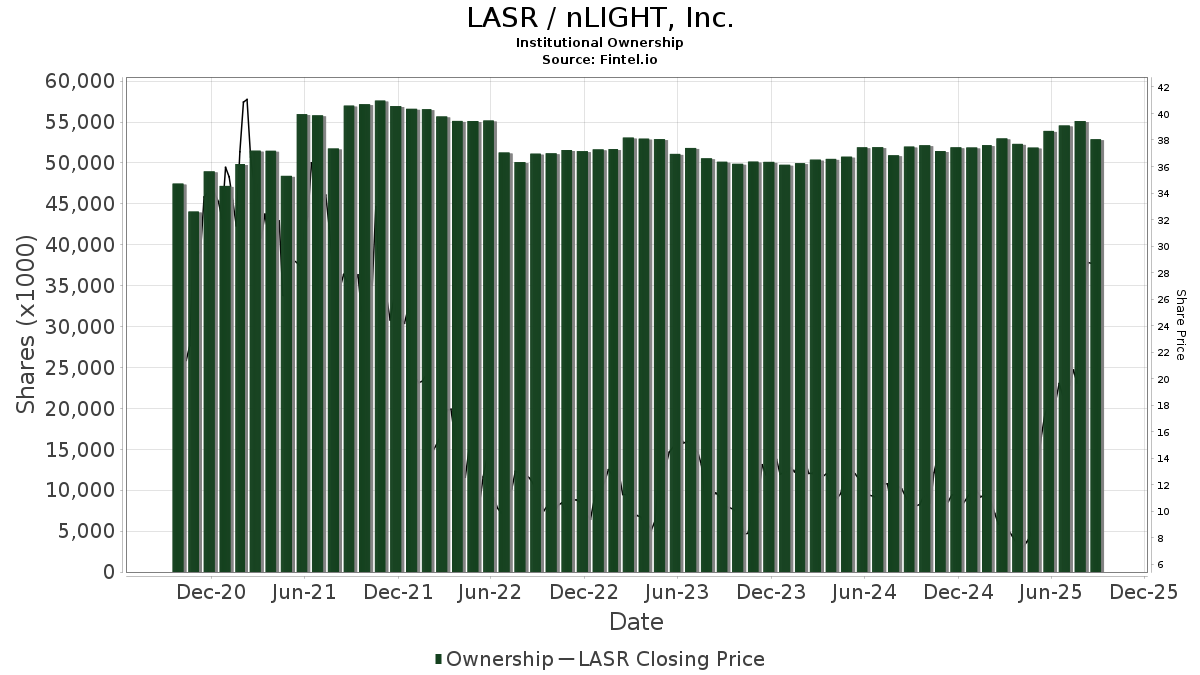
Institutionelt ejerskab og aktionærer
nLIGHT, Inc. (US:LASR) har 248 institutionelle ejere og aktionærer, der har indsendt 13D/G- eller 13F-formularer til Securities Exchange Commission (SEC). Disse institutioner har i alt 44,492,547 aktier. Største aktionærer omfatter Vanguard Group Inc, BlackRock, Inc., Needham Investment Management Llc, Neuberger Berman Group LLC, Invesco Ltd., Geode Capital Management, Llc, Harvey Partners, LLC, AWM Investment Company, Inc., Artisan Partners Limited Partnership, and State Street Corp .
nLIGHT, Inc. (NasdaqGS:LASR) institutionel ejerskabsstruktur viser aktuelle positioner i virksomheden efter institutioner og fonde, samt seneste ændringer i positionsstørrelse. Større aktionærer kan omfatte individuelle investorer, investeringsforeninger, hedgefonde eller institutioner. Skema 13D angiver, at investoren besidder (eller besidder) mere end 5 % af virksomheden og har til hensigt (eller har til hensigt at) aktivt at forfølge en ændring i forretningsstrategi. Skema 13G indikerer en passiv investering på over 5%.
The share price as of April 8, 2026 is 60,32 / share. Previously, on April 9, 2025, the share price was 7,63 / share. This represents an increase of 690,56% over that period.
Fondens stemningsscore
Fund Sentiment Score (fka Ownership Accumulation Score) finder de aktier, der bliver mest købt af fonde. Det er resultatet af en sofistikeret, multi-faktor kvantitativ model, der identificerer virksomheder med de højeste niveauer af institutionel akkumulering. Scoringsmodellen bruger en kombination af den samlede stigning i oplyste ejere, ændringerne i porteføljeallokeringer i disse ejere og andre målinger. Tallet går fra 0 til 100, hvor højere tal indikerer et højere niveau af akkumulering for sine jævnaldrende, og 50 er gennemsnittet.
Opdateringsfrekvens: Dagligt
Se Ownership Explorer, som giver en liste over højest rangerende virksomheder.
AI+ Ask Fintel’s AI assistant about nLIGHT, Inc..
Select a question to share a public post with an AI-crafted answer.
Thinking of good questions…
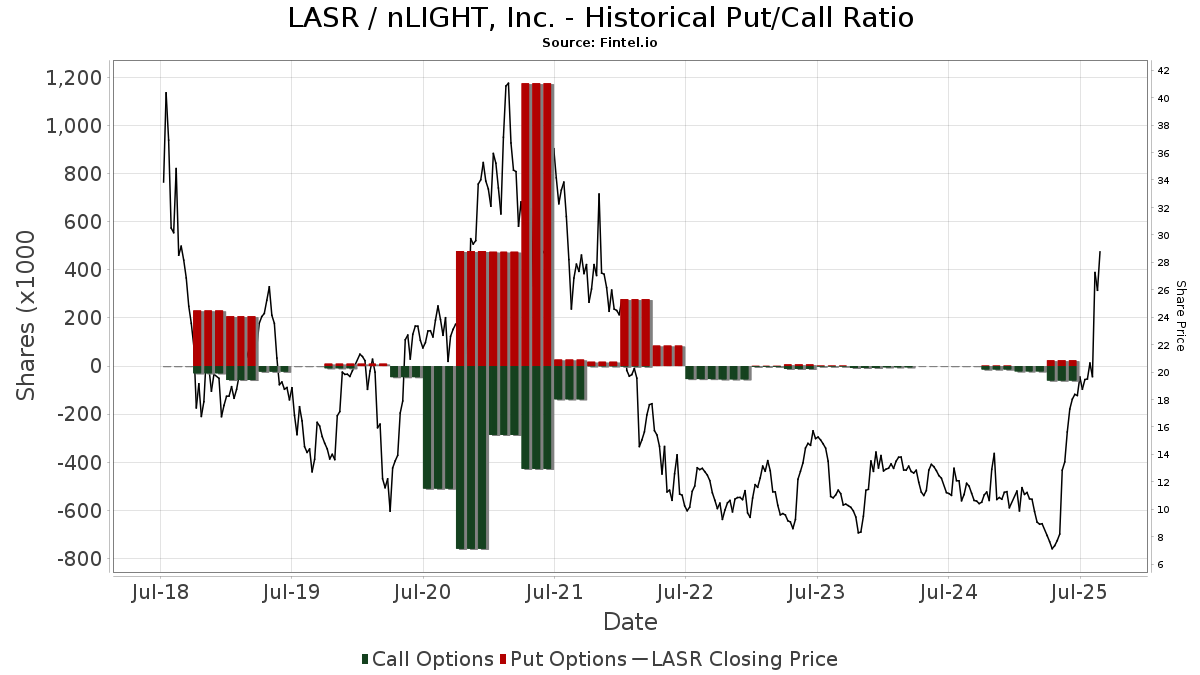
Institutionel Put/Call-forhold
Ud over at indberette standardaktie- og gældsudstedelser skal institutter med mere end 100 mill. aktiver under forvaltning også oplyse deres put- og call-optionsbeholdninger. Da salgsoptioner generelt indikerer negativ stemning, og købsoptioner indikerer positiv stemning, kan vi få en fornemmelse af den overordnede institutionelle stemning ved at plotte forholdet mellem put og kald. Diagrammet til højre viser det historiske put/call-forhold for dette instrument.
Brug af Put/Call Ratio som en indikator for investorernes stemning overvinder en af de vigtigste mangler ved at bruge totalt institutionelt ejerskab, som er, at en betydelig mængde af aktiver under forvaltning investeres passivt for at spore indekser. Passivt forvaltede fonde køber typisk ikke optioner, så indikatoren for put/call-forholdet følger mere nøje følelsen af aktivt forvaltede fonde.
13D/G-arkivering
Vi præsenterer 13D/G ansøgninger separat fra 13F ansøgninger på grund af den forskellige behandling af SEC. 13D/G-ansøgninger kan indgives af grupper af investorer (med én ledende), hvorimod 13F-ansøgninger ikke kan. Dette resulterer i situationer, hvor en investor kan indsende en 13D/G, der rapporterer én værdi for de samlede aktier (der repræsenterer alle de aktier, der ejes af investorgruppen), men derefter indsender en 13F, der rapporterer en anden værdi for de samlede aktier (der udelukkende repræsenterer deres egne) ejendomsret). Det betyder, at aktieejerskab af 13D/G-arkiver og 13F-arkiveringer ofte ikke er direkte sammenlignelige, så vi præsenterer dem separat.
Bemærk: Fra den 16. maj 2021 viser vi ikke længere ejere, der ikke har indsendt en 13D/G inden for det seneste år. Tidligere viste vi den fulde historie af 13D/G-arkiver. Generelt skal enheder, der er forpligtet til at indgive 13D/G-ansøgninger, indgive mindst årligt, før de indsender en afsluttende ansøgning. Dog forlader fonde nogle gange positioner uden at indsende en afsluttende ansøgning (dvs. de afvikler), så visning af den fulde historie resulterede nogle gange i forvirring om det nuværende ejerskab. For at undgå forvirring viser vi nu kun 'aktuelle' ejere - det vil sige - ejere, der har anmeldt inden for det seneste år.
Upgrade to unlock premium data.
| Fil dato | Form | Investor | Forrige Aktier |
Seneste Aktier |
Δ Aktier (Procent) |
Ejendomsret (Procent) |
Δ Ejerskab (Procent) |
|
|---|---|---|---|---|---|---|---|---|
| 2026-03-27 | VANGUARD GROUP INC | 4,864,312 | 0 | -100.00 | 0.00 | -100.00 | ||
| 2025-08-13 | NEEDHAM INVESTMENT MANAGEMENT LLC | 2,652,115 | 1,837,740 | -30.71 | 3.70 | -32.48 | ||
| 2025-08-11 | Senvest Management, LLC | 2,469,077 | 1,810,257 | -26.68 | 3.70 | -27.45 | ||
| 2025-07-16 | ROYCE & ASSOCIATES LP | 2,733,476 | 1,913,100 | -30.01 | 3.87 | -31.87 |
13F og NPORT arkivering
Detaljer om 13F-arkivering er gratis. Detaljer om NP-ansøgninger kræver et premium-medlemskab. Grønne rækker angiver nye positioner. Røde rækker angiver lukkede positioner. Klik på linket ikon for at se den fulde transaktionshistorik.
Opgrader
for at låse premium-data op og eksportere til Excel ![]() .
.
| Fil dato | Kilde | Investor | Type | Gennemsnitlig pris (Øst) |
Aktier | Δ Aktier (%) |
Rapporteret Værdi ($1000) |
Δ Værdi (%) |
Port Alloc (%) |
|
|---|---|---|---|---|---|---|---|---|---|---|
| 2026-02-12 | 13F | EntryPoint Capital, LLC | 8.144 | 305 | ||||||
| 2026-02-13 | 13F | Police & Firemen's Retirement System of New Jersey | 12.384 | -7,15 | 465 | 17,47 | ||||
| 2026-01-27 | 13F | Zurcher Kantonalbank (Zurich Cantonalbank) | 10.438 | 21,93 | 392 | 54,55 | ||||
| 2026-02-11 | 13F | Gwn Securities Inc. | 9.339 | 350 | ||||||
| 2025-11-14 | 13F | Ameriprise Financial Inc | 0 | -100,00 | 0 | |||||
| 2026-03-04 | 13F/A | Savant Capital, LLC | 0 | -100,00 | 0 | |||||
| 2025-10-28 | 13F | CarsonAllaria Wealth Management, Ltd. | 0 | -100,00 | 0 | |||||
| 2026-02-05 | 13F | Stephens Investment Management Group LLC | 760.729 | -10,02 | 28.535 | 13,91 | ||||
| 2026-04-07 | 13F | Signaturefd, Llc | 1.078 | 11,59 | 61 | 69,44 | ||||
| 2026-02-05 | 13F | Pinnacle Associates Ltd | 875.471 | -5,70 | 32.839 | 19,38 | ||||
| 2026-02-18 | 13F | GWM Advisors LLC | 0 | -100,00 | 0 | |||||
| 2026-02-12 | 13F | Marex Group plc | 11.245 | -49,59 | 422 | -36,21 | ||||
| 2025-11-14 | 13F | Lazard Asset Management Llc | 0 | -100,00 | 0 | |||||
| 2026-02-13 | 13F | Prudential Financial Inc | 41.825 | 27,65 | 1.569 | 61,65 | ||||
| 2025-11-14 | 13F | Occudo Quantitative Strategies Lp | 0 | -100,00 | 0 | -100,00 | ||||
| 2026-02-05 | 13F | Allworth Financial LP | 611 | 97,10 | 23 | 144,44 | ||||
| 2026-02-12 | 13F | Skopos Labs, Inc. | 5.752 | 224 | ||||||
| 2026-02-13 | 13F | Bridgewater Associates, LP | 0 | -100,00 | 0 | |||||
| 2026-02-13 | 13F | Smartleaf Asset Management LLC | 418 | 497,14 | 16 | 700,00 | ||||
| 2026-02-17 | 13F | Tower Research Capital LLC (TRC) | 2.204 | -33,95 | 83 | -16,33 | ||||
| 2025-11-12 | 13F | Quantbot Technologies LP | 0 | -100,00 | 0 | |||||
| 2026-02-13 | 13F | Citigroup Inc | 1.570 | -96,06 | 59 | -95,09 | ||||
| 2026-02-03 | 13F | Pier Capital, LLC | 131.747 | -0,74 | 4.942 | 25,66 | ||||
| 2025-10-22 | 13F | North Star Investment Management Corp. | 0 | -100,00 | 0 | |||||
| 2026-02-17 | 13F | Oberweis Asset Management Inc/ | 356.400 | 33,98 | 13.369 | 69,62 | ||||
| 2026-01-29 | 13F | UBS Group AG | 118.515 | -23,84 | 4.445 | -3,58 | ||||
| 2026-02-11 | 13F | Deutsche Bank Ag\ | 37.346 | 27,04 | 1.401 | 60,73 | ||||
| 2026-02-17 | 13F | Alliancebernstein L.p. | 52.376 | 28,69 | 1.965 | 62,99 | ||||
| 2026-02-12 | 13F | BlackRock, Inc. | 4.450.383 | -1,49 | 166.934 | 24,71 | ||||
| 2026-01-29 | 13F | Comerica Bank | 528 | -13,30 | 20 | 5,56 | ||||
| 2026-02-17 | 13F | Russell Investments Group, Ltd. | 50.493 | 14,89 | 1.894 | 45,47 | ||||
| 2026-01-26 | 13F | Merit Financial Group, LLC | 6.310 | 237 | ||||||
| 2026-02-10 | 13F | Eurizon Capital SGR S.p.A. | 2.236 | 84 | ||||||
| 2026-02-11 | 13F | Simplex Trading, Llc | 14.915 | 110,69 | 559 | |||||
| 2026-02-17 | 13F | Zacks Investment Management | 8.072 | 19,59 | 303 | 51,00 | ||||
| 2026-02-11 | 13F | Simplex Trading, Llc | Call | 1.000 | -96,44 | 38 | ||||
| 2026-02-13 | 13F | Landscape Capital Management, L.l.c. | 5.631 | -25,11 | 211 | -4,95 | ||||
| 2026-02-11 | 13F | Simplex Trading, Llc | Put | 200 | -33,33 | 8 | ||||
| 2026-02-12 | 13F | Swiss National Bank | 93.500 | 2,75 | 3.507 | 30,08 | ||||
| 2026-01-28 | 13F | Klp Kapitalforvaltning As | 10.200 | 4,08 | 383 | 31,72 | ||||
| 2026-01-27 | 13F | Brighton Jones Llc | 0 | -100,00 | 0 | |||||
| 2026-02-10 | 13F | Goldman Sachs Group Inc | 415.542 | 0,58 | 15.587 | 27,32 | ||||
| 2026-04-07 | 13F | Farther Finance Advisors, LLC | 949 | 78,72 | 55 | 189,47 | ||||
| 2026-02-11 | 13F | LPL Financial LLC | 19.221 | -19,19 | 721 | 2,27 | ||||
| 2026-02-11 | 13F | Group One Trading, L.p. | Call | 600 | -88,68 | 23 | -85,99 | |||
| 2026-02-11 | 13F | Group One Trading, L.p. | Put | 600 | -81,82 | 23 | -77,32 | |||
| 2026-02-11 | 13F | Group One Trading, L.p. | 16.665 | 12,78 | 625 | 43,02 | ||||
| 2026-02-12 | 13F | Dimensional Fund Advisors Lp | 720.624 | -0,29 | 27.034 | 26,25 | ||||
| 2026-02-11 | 13F | Fox Run Management, L.l.c. | 29.843 | 17,44 | 1.119 | 48,80 | ||||
| 2026-02-12 | 13F | Nuveen, LLC | 526.014 | 141,18 | 19.731 | 205,32 | ||||
| 2025-11-14 | 13F | Point72 Hong Kong Ltd | 3.052 | 90 | ||||||
| 2026-02-09 | 13F | Keating Financial Advisory Services, Inc. | 11 | 0 | ||||||
| 2026-02-09 | 13F | Roubaix Capital, LLC | 139.048 | -43,04 | 5.216 | -27,90 | ||||
| 2026-02-13 | 13F | AWM Investment Company, Inc. | 1.169.680 | 0,00 | 43.875 | 26,59 | ||||
| 2026-02-17 | 13F | Quantinno Capital Management LP | 41.527 | 2,91 | 1.558 | 30,29 | ||||
| 2025-11-14 | 13F | Point72 Asia (Singapore) Pte. Ltd. | 0 | -100,00 | 0 | |||||
| 2026-02-06 | 13F | IFP Advisors, Inc | 405 | 1.587,50 | 15 | |||||
| 2026-02-12 | 13F | Senvest Management, LLC | 997.501 | 10,77 | 37.416 | 40,22 | ||||
| 2026-04-06 | 13F | Versant Capital Management, Inc | 5.081 | -0,70 | 290 | 51,31 | ||||
| 2026-02-09 | 13F | Geode Capital Management, Llc | 1.234.696 | 1,65 | 46.320 | 28,68 | ||||
| 2026-02-17 | 13F | VARCOV Co. | 10.114 | 379 | ||||||
| 2026-02-11 | 13F | Meeder Asset Management Inc | 259 | 10 | ||||||
| 2026-02-10 | 13F | Bank of New York Mellon Corp | 137.214 | -4,09 | 5.147 | 21,40 | ||||
| 2025-11-14 | 13F | Virtu Financial LLC | 0 | -100,00 | 0 | |||||
| 2026-02-13 | 13F | MYDA Advisors LLC | 239.042 | -28,00 | 8.966 | -8,85 | ||||
| 2026-02-17 | 13F | Susquehanna International Group, Llp | Put | 0 | -100,00 | 0 | ||||
| 2026-01-14 | 13F | ORG Partners LLC | 420 | 75,00 | 16 | 114,29 | ||||
| 2026-02-13 | 13F | Ieq Capital, Llc | 51.337 | 91,86 | 1.926 | 143,06 | ||||
| 2025-11-14 | 13F | Beaconlight Capital, Llc | 0 | -100,00 | 0 | |||||
| 2026-02-12 | 13F | Granite Investment Partners, LLC | 186.815 | 7.007 | ||||||
| 2026-02-17 | 13F | PharVision Advisers, LLC | 9.327 | -42,10 | 350 | -26,83 | ||||
| 2025-10-29 | 13F | AMH Equity Ltd | 50.000 | -50,00 | 1.482 | -24,75 | ||||
| 2026-04-08 | 13F | Wealth Enhancement Advisory Services, Llc | 14.829 | 18,36 | 892 | 88,77 | ||||
| 2026-02-13 | 13F | Victory Capital Management Inc | 114.898 | 97,53 | 4.310 | 150,09 | ||||
| 2026-02-17 | 13F | Mercer Global Advisors Inc /adv | 9.412 | 353 | ||||||
| 2026-02-10 | 13F | Envestnet Asset Management Inc | 12.335 | 31,97 | 463 | 67,39 | ||||
| 2026-02-11 | 13F | Cedar Mountain Advisors, LLC | 282 | 0,00 | 11 | 25,00 | ||||
| 2026-04-07 | 13F/A | Round Rock Advisors, LLC | 6.694 | 251 | ||||||
| 2026-01-28 | 13F | Universal- Beteiligungs- und Servicegesellschaft mbH | 20.601 | 788 | ||||||
| 2026-01-29 | 13F | Vanguard Group Inc | 4.989.758 | 2,58 | 187.166 | 29,86 | ||||
| 2026-02-05 | 13F | Amalgamated Bank | 1.456 | -3,13 | 0 | |||||
| 2026-02-13 | 13F | First Trust Advisors Lp | 263.617 | 2.502,08 | 9.888 | 3.196,00 | ||||
| 2026-02-17 | 13F | Graham Capital Management, L.P. | 5.762 | -74,61 | 216 | -67,86 | ||||
| 2025-11-14 | 13F | ExodusPoint Capital Management, LP | 0 | -100,00 | 0 | |||||
| 2026-02-13 | 13F | OMERS ADMINISTRATION Corp | 0 | -100,00 | 0 | |||||
| 2026-02-13 | 13F | Sterling Capital Management LLC | 2.518 | -19,35 | 94 | 2,17 | ||||
| 2026-02-13 | 13F | Aigen Investment Management, Lp | 0 | -100,00 | 0 | |||||
| 2026-02-13 | 13F | Ubs Asset Management Americas Inc | 59.673 | 34,59 | 2.238 | 70,45 | ||||
| 2026-02-17 | 13F | Numerai GP LLC | 0 | -100,00 | 0 | |||||
| 2026-02-13 | 13F | Walleye Capital LLC | 0 | -100,00 | 0 | |||||
| 2026-02-17 | 13F | Optiver Holding B.V. | 132 | -64,13 | 5 | -60,00 | ||||
| 2026-02-12 | 13F | Jane Street Group, Llc | 66.343 | -68,00 | 2.489 | -59,50 | ||||
| 2026-02-10 | 13F | State of Wyoming | 19.941 | -2,28 | 748 | 23,68 | ||||
| 2026-02-17 | 13F | Price T Rowe Associates Inc /md/ | 26.574 | 1,61 | 1 | |||||
| 2026-01-22 | 13F | Financial Consulate, Inc | 1.100 | 41 | ||||||
| 2026-02-11 | 13F | Ameritas Investment Partners, Inc. | 3.762 | 141 | ||||||
| 2026-02-13 | 13F | Wexford Capital Lp | 0 | -100,00 | 0 | |||||
| 2025-11-14 | 13F | Cubist Systematic Strategies, LLC | 97.726 | -43,58 | 2.896 | -15,05 | ||||
| 2026-02-14 | 13F | Rockefeller Capital Management L.P. | 3.850 | 144 | ||||||
| 2026-02-17 | 13F | Engineers Gate Manager LP | 109.376 | -18,03 | 4.103 | 3,77 | ||||
| 2026-02-09 | 13F | Legal & General Group Plc | 45.590 | -6,97 | 1.710 | 17,77 | ||||
| 2026-02-11 | 13F | Primecap Management Co/ca/ | 226.739 | -7,84 | 8.505 | 16,65 | ||||
| 2026-02-17 | 13F | Canada Pension Plan Investment Board | 35.700 | 1.339 | ||||||
| 2026-02-17 | 13F | California State Teachers Retirement System | 44.085 | -0,32 | 1.654 | 26,18 | ||||
| 2026-02-09 | 13F | Quest Partners LLC | 11.700 | -31,77 | 439 | -13,78 | ||||
| 2026-02-17 | 13F | Raymond James Financial Inc | 312.373 | -5,58 | 11.717 | 19,54 | ||||
| 2026-02-13 | 13F | Sei Investments Co | 180.959 | 243,13 | 6.788 | 334,51 | ||||
| 2026-02-17 | 13F | Voloridge Investment Management, Llc | 141.254 | -38,96 | 5.298 | -22,74 | ||||
| 2026-02-13 | 13F | Great West Life Assurance Co /can/ | 3.804 | 0,00 | 0 | |||||
| 2026-01-26 | 13F | Cwm, Llc | 19.057 | 35,50 | 1 | |||||
| 2025-11-13 | 13F | FORA Capital, LLC | 0 | -100,00 | 0 | -100,00 | ||||
| 2026-02-17 | 13F | Twinbeech Capital Lp | 0 | -100,00 | 0 | |||||
| 2026-02-19 | 13F | Invesco Ltd. | 1.399.229 | 32,34 | 52.485 | 67,54 | ||||
| 2026-02-12 | 13F | Virtue Capital Management, LLC | 0 | -100,00 | 0 | |||||
| 2026-02-02 | 13F | Oppenheimer & Co Inc | 6.324 | -22,40 | 237 | -1,66 | ||||
| 2026-02-12 | 13F | Counterpoint Mutual Funds LLC | 0 | -100,00 | 0 | |||||
| 2026-02-13 | 13F | Resources Investment Advisors, LLC. | 10.006 | 0,00 | 375 | 26,69 | ||||
| 2026-02-17 | 13F | Apis Capital Advisors, LLC | 250.800 | 736,00 | 9.408 | 959,35 | ||||
| 2026-02-05 | 13F | Gabelli Funds Llc | 33.000 | -37,74 | 1.238 | -21,21 | ||||
| 2026-01-22 | 13F | Massachusetts Financial Services Co /ma/ | 770.492 | -7,94 | 28.901 | 16,54 | ||||
| 2026-02-13 | 13F | Panagora Asset Management Inc | 16.284 | 0,00 | 611 | 26,56 | ||||
| 2026-02-10 | 13F | Root Financial Partners, LLC | 6 | 0 | ||||||
| 2026-02-13 | 13F | Caitong International Asset Management Co., Ltd | 89 | 535,71 | 3 | |||||
| 2026-01-15 | 13F | Allspring Global Investments Holdings, LLC | 20.227 | 776 | ||||||
| 2026-03-26 | 13F | Leonteq Securities AG | 0 | -100,00 | 0 | |||||
| 2026-02-17 | 13F | Hood River Capital Management LLC | 804.457 | 41,70 | 30.175 | 79,39 | ||||
| 2026-02-12 | 13F | New York State Common Retirement Fund | 342.080 | 2.027,63 | 12.831 | 2.595,59 | ||||
| 2026-01-20 | 13F | October Effect Ltd | 18.350 | 688 | ||||||
| 2026-02-17 | 13F | MIRAE ASSET GLOBAL ETFS HOLDINGS Ltd. | 21.553 | -3,09 | 808 | 22,61 | ||||
| 2026-02-17 | 13F | XTX Topco Ltd | 24.877 | -22,68 | 933 | -2,10 | ||||
| 2026-02-09 | 13F | Emerald Mutual Fund Advisers Trust | 429.772 | 47,63 | 16.121 | 86,90 | ||||
| 2026-02-17 | 13F | Citadel Advisors Llc | Call | 30.100 | -12,50 | 1.129 | 10,79 | |||
| 2026-02-17 | 13F | Citadel Advisors Llc | 288.852 | 129,04 | 10.835 | 189,99 | ||||
| 2026-02-17 | 13F | Oxford Asset Management Llp | 0 | -100,00 | 0 | -100,00 | ||||
| 2026-02-17 | 13F | Cinctive Capital Management LP | 28.206 | 98,47 | 1.058 | 151,31 | ||||
| 2026-02-06 | 13F | ProShare Advisors LLC | 13.745 | 2,67 | 516 | 30,05 | ||||
| 2026-02-13 | 13F | Stifel Financial Corp | 95.490 | -5,32 | 3.582 | 19,85 | ||||
| 2026-02-05 | 13F | Baader Bank INC | 0 | -100,00 | 0 | |||||
| 2026-02-12 | 13F | State Board Of Administration Of Florida Retirement System | 12.693 | 0,00 | 476 | 26,60 | ||||
| 2026-02-11 | 13F | Dorsey & Whitney Trust CO LLC | 30.905 | 0,00 | 1.159 | 26,67 | ||||
| 2026-02-17 | 13F | Bayesian Capital Management, LP | 0 | -100,00 | 0 | |||||
| 2026-02-13 | 13F | Herald Investment Management Ltd | 215.000 | -14,00 | 8.056 | 8,76 | ||||
| 2026-02-17 | 13F | Mangrove Partners | 7.039 | 264 | ||||||
| 2026-02-17 | 13F | Bank Of America Corp /de/ | 177.126 | -37,64 | 6.644 | -21,06 | ||||
| 2026-02-13 | 13F | Needham Investment Management Llc | 1.857.740 | 3,63 | 69.684 | 31,19 | ||||
| 2026-01-21 | 13F | SJS Investment Consulting Inc. | 30 | 1 | ||||||
| 2026-02-12 | 13F | Fuller & Thaler Asset Management, Inc. | 16.420 | -2,38 | 616 | 23,49 | ||||
| 2026-02-13 | 13F | Quarry LP | 630 | -74,89 | 24 | -68,92 | ||||
| 2026-02-11 | 13F | Los Angeles Capital Management Llc | 98 | 3 | ||||||
| 2026-02-13 | 13F | MAI Capital Management | 14 | -93,72 | 1 | -100,00 | ||||
| 2026-02-17 | 13F | Citadel Advisors Llc | Put | 14.800 | -18,68 | 555 | 2,97 | |||
| 2026-01-30 | 13F | Us Bancorp \de\ | 441 | 0,00 | 17 | 23,08 | ||||
| 2026-02-10 | 13F | Rothschild Investment Llc | 123 | 173,33 | 5 | 300,00 | ||||
| 2026-02-17 | 13F | Royal Bank Of Canada | 1.672 | -98,33 | 62 | -97,91 | ||||
| 2026-01-29 | 13F | Nbc Securities, Inc. | 3.627 | 139,25 | 136 | 209,09 | ||||
| 2026-02-17 | 13F | Two Sigma Investments, Lp | 27.447 | 255,90 | 1.030 | 351,32 | ||||
| 2025-11-14 | 13F | Balyasny Asset Management Llc | 0 | -100,00 | 0 | |||||
| 2026-01-23 | 13F | Burney Co/ | 25.226 | 3,99 | 946 | 31,75 | ||||
| 2026-01-09 | 13F | Assenagon Asset Management S.A. | 22.301 | 0,00 | 837 | 26,67 | ||||
| 2026-02-17 | 13F | Artisan Partners Limited Partnership | 1.101.436 | 41.315 | ||||||
| 2026-02-04 | 13F | Bailard, Inc. | 7.100 | 266 | ||||||
| 2026-02-17 | 13F | Boothbay Fund Management, Llc | 24.712 | -37,68 | 927 | -21,12 | ||||
| 2026-02-10 | 13F | Intech Investment Management Llc | 22.665 | 12,29 | 850 | 42,14 | ||||
| 2026-02-17 | 13F | Jones Financial Companies Lllp | 250 | 0,00 | 9 | 28,57 | ||||
| 2026-02-10 | 13F | Acadian Asset Management Llc | 572.191 | 23,82 | 21 | 61,54 | ||||
| 2026-02-11 | 13F | Picton Mahoney Asset Management | 41.070 | 1.541 | ||||||
| 2026-02-09 | 13F | Royce & Associates Lp | 924.383 | -30,44 | 34.674 | -11,94 | ||||
| 2026-02-13 | 13F | Lord, Abbett & Co. Llc | 349.570 | 99,58 | 13 | 160,00 | ||||
| 2026-02-17 | 13F | Fmr Llc | 117.970 | 15,63 | 4.425 | 46,43 | ||||
| 2026-02-02 | 13F | Pittenger & Anderson Inc | 175 | 0,00 | 7 | 20,00 | ||||
| 2026-01-26 | 13F | Moss Adams Wealth Advisors LLC | 6.276 | 235 | ||||||
| 2026-02-09 | 13F | Coldstream Capital Management Inc | 16.821 | -34,90 | 631 | -17,65 | ||||
| 2026-02-17 | 13F | Portolan Capital Management, LLC | 590.433 | -23,30 | 22.147 | -2,90 | ||||
| 2026-02-12 | 13F | Hrt Financial Lp | 104.429 | 71,13 | 4 | 200,00 | ||||
| 2026-02-06 | 13F | Gsa Capital Partners Llp | 40.056 | -0,34 | 2 | 0,00 | ||||
| 2026-02-11 | 13F | Franklin Resources Inc | 66.003 | 2,52 | 2.476 | 29,79 | ||||
| 2026-02-06 | 13F | Larson Financial Group LLC | 2.911 | -16,54 | 109 | 5,83 | ||||
| 2026-02-17 | 13F | Magnetar Financial LLC | 11.719 | -29,69 | 440 | -10,95 | ||||
| 2025-11-14 | 13F | Manchester Capital Management LLC | 2.878 | -21,47 | 85 | 18,06 | ||||
| 2026-02-13 | 13F | Pin Oak Investment Advisors Inc | 200 | 0 | ||||||
| 2026-02-13 | 13F | Barclays Plc | 73.759 | 4,48 | 2.767 | 266,84 | ||||
| 2026-02-13 | 13F | State Street Corp | 1.050.869 | 0,09 | 39.418 | 26,71 | ||||
| 2026-02-17 | 13F | Brevan Howard Capital Management LP | 12.148 | -41,66 | 456 | -26,14 | ||||
| 2026-02-06 | 13F | EverSource Wealth Advisors, LLC | 1.062 | 155,90 | 40 | 225,00 | ||||
| 2026-02-17 | 13F | Fred Alger Management, Llc | 6.524 | -6,10 | 245 | 19,02 | ||||
| 2026-03-04 | 13F | SHP Wealth Management | 10 | 0 | ||||||
| 2026-02-14 | 13F | Militia Capital Partners, LP | 21.200 | 795 | ||||||
| 2026-01-16 | 13F | FNY Investment Advisers, LLC | 44.108 | 5,47 | 2 | 0,00 | ||||
| 2026-02-12 | 13F | EAM Investors, LLC | 274.215 | -1,30 | 10.286 | 26,29 | ||||
| 2026-02-17 | 13F | Captrust Financial Advisors | 37.615 | 1.411 | ||||||
| 2026-02-17 | 13F | Susquehanna International Group, Llp | Call | 13.300 | -51,28 | 499 | -38,37 | |||
| 2026-02-13 | 13F | Squarepoint Ops LLC | 258.529 | 223,85 | 9.697 | 310,02 | ||||
| 2026-02-17 | 13F | Susquehanna International Group, Llp | 91.819 | 2,39 | 3.444 | 29,62 | ||||
| 2026-02-17 | 13F | Two Sigma Advisers, Lp | 24.500 | 919 | ||||||
| 2026-02-17 | 13F | Algert Global Llc | 365.760 | 10,54 | 14 | 44,44 | ||||
| 2026-04-06 | 13F | GAMMA Investing LLC | 1.609 | -2,31 | 92 | 49,18 | ||||
| 2026-02-13 | 13F | Towarzystwo Funduszy Inwestycyjnych Pzu Sa | 380 | 14 | ||||||
| 2026-01-28 | 13F | Arizona State Retirement System | 13.275 | -4,48 | 498 | 20,92 | ||||
| 2026-02-13 | 13F | Anb Bank | 8.266 | 310 | ||||||
| 2026-02-13 | 13F | Mariner, LLC | 15.544 | 584 | ||||||
| 2026-02-12 | 13F | Quadrant Capital Group Llc | 1.911 | 0,00 | 72 | 26,79 | ||||
| 2026-02-13 | 13F | SRS Capital Advisors, Inc. | 488 | -80,92 | 18 | -76,00 | ||||
| 2026-02-13 | 13F | MYDA Advisors LLC | Call | 0 | -100,00 | 0 | -100,00 | |||
| 2026-02-02 | 13F | Strs Ohio | 22.800 | -9,88 | 855 | 14,15 | ||||
| 2026-02-17 | 13F | Jain Global LLC | 14.062 | 527 | ||||||
| 2026-02-17 | 13F | Northern Trust Corp | 491.254 | 8,18 | 18.427 | 36,95 | ||||
| 2026-01-29 | 13F | Cornerstone Investment Partners, LLC | 6.111 | 229 | ||||||
| 2025-11-14 | 13F | Sittner & Nelson, Llc | 0 | -100,00 | 0 | -100,00 | ||||
| 2026-02-11 | 13F | Hughes Financial Services, LLC | 59 | -7,81 | 2 | 0,00 | ||||
| 2026-02-17 | 13F | Janus Henderson Group Plc | 19.580 | 0,00 | 734 | 26,55 | ||||
| 2026-01-15 | 13F | Nisa Investment Advisors, Llc | 2.991 | 0,00 | 112 | 27,27 | ||||
| 2026-02-13 | 13F | Rice Hall James & Associates, Llc | 84.995 | -14,62 | 3.188 | 8,10 | ||||
| 2026-02-03 | 13F | Wesbanco Bank Inc | 10.000 | 375 | ||||||
| 2026-02-13 | 13F | First Washington CORP | 0 | -100,00 | 0 | |||||
| 2026-02-17 | 13F | State Of Wisconsin Investment Board | 84.919 | 41,39 | 3.185 | 79,03 | ||||
| 2026-01-27 | 13F | Krilogy Financial LLC | 7.638 | 333 | ||||||
| 2026-01-29 | 13F | UMA Financial Services, Inc. | 27 | 0,00 | 1 | |||||
| 2026-02-13 | 13F | Rhumbline Advisers | 63.279 | -13,79 | 2.374 | 9,15 | ||||
| 2026-02-13 | 13F | Neuberger Berman Group LLC | 1.486.380 | 15,12 | 55.813 | 46,00 | ||||
| 2026-02-17 | 13F | Qube Research & Technologies Ltd | 216.741 | 46,76 | 8.130 | 85,81 | ||||
| 2026-02-17 | 13F | Harvest Investment Services, LLC | 27.507 | 1.032 | ||||||
| 2026-02-06 | 13F | Global Retirement Partners, LLC | 10.069 | 505,11 | 378 | 669,39 | ||||
| 2026-02-17 | 13F | Driehaus Capital Management Llc | 732.547 | 27.478 | ||||||
| 2026-02-12 | 13F | Federated Hermes, Inc. | 112.306 | 41,62 | 4.213 | 79,31 | ||||
| 2026-02-13 | 13F | Pathstone Holdings, LLC | 42.562 | -1,01 | 1.597 | 25,27 | ||||
| 2026-02-12 | 13F | Steward Partners Investment Advisory, Llc | 0 | -100,00 | 0 | |||||
| 2026-02-09 | 13F | Kingsview Wealth Management, LLC | 6.359 | -7,67 | 239 | 16,67 | ||||
| 2026-02-09 | 13F | Lisanti Capital Growth, LLC | 103.978 | 22,99 | 3.900 | 55,69 | ||||
| 2026-02-13 | 13F | Bridgefront Capital, LLC | 0 | -100,00 | 0 | |||||
| 2026-02-12 | 13F | Principal Securities, Inc. | 0 | -100,00 | 0 | |||||
| 2026-02-03 | 13F | CGC Financial Services, LLC | 523 | 0,00 | 20 | 26,67 | ||||
| 2026-02-13 | 13F | Charles Schwab Investment Management Inc | 414.861 | 1,52 | 15.561 | 28,53 | ||||
| 2026-02-09 | 13F | Hartland & Co., LLC | 14 | -92,75 | 1 | -100,00 | ||||
| 2026-02-17 | 13F | Gotham Asset Management, LLC | 90.652 | 31,32 | 3.400 | 66,26 | ||||
| 2026-01-09 | 13F | SG Americas Securities, LLC | 14.107 | -28,37 | 1 | |||||
| 2026-02-13 | 13F | Y-Intercept (Hong Kong) Ltd | 13.817 | 45,83 | 518 | 85,00 | ||||
| 2026-02-17 | 13F | Harvey Partners, LLC | 1.202.502 | -13,95 | 45.106 | 8,93 | ||||
| 2026-02-06 | 13F | Marathon Asset Mgmt Ltd | 0 | -100,00 | 0 | |||||
| 2026-02-20 | 13F | Sunbelt Securities, Inc. | 1.014 | 7.142,86 | 38 | |||||
| 2025-11-14 | 13F | Polar Capital Holdings Plc | 0 | -100,00 | 0 | |||||
| 2026-02-12 | 13F | Integrated Quantitative Investments LLC | 9.950 | 373 | ||||||
| 2026-02-12 | 13F | MetLife Investment Management, LLC | 26.565 | -7,71 | 996 | 16,90 | ||||
| 2025-11-12 | 13F | Mach-1 Financial Group, Inc. | 0 | -100,00 | 0 | |||||
| 2025-11-14 | 13F | Invenomic Capital Management LP | 0 | -100,00 | 0 | |||||
| 2026-02-12 | 13F | Voya Investment Management Llc | 8.502 | -4,11 | 319 | 21,37 | ||||
| 2026-02-12 | 13F | Brinker Capital Investments, LLC | 9.992 | 15,57 | 375 | 46,09 | ||||
| 2026-02-17 | 13F | Divisar Capital Management LLC | 288.438 | -49,88 | 10.819 | -36,55 | ||||
| 2026-02-10 | 13F | Bnp Paribas Arbitrage, Sa | 80.329 | -49,91 | 3.013 | -36,58 | ||||
| 2026-02-11 | 13F | Cerity Partners LLC | 14.542 | 21,54 | 545 | 53,95 | ||||
| 2026-01-08 | 13F | True Wealth Design, LLC | 656 | 0,00 | 25 | 26,32 | ||||
| 2026-02-17 | 13F | Petrus Trust Company, LTA | 0 | -100,00 | 0 | -100,00 | ||||
| 2026-02-13 | 13F | Arrowstreet Capital, Limited Partnership | 861.839 | 14,04 | 32.328 | 44,37 | ||||
| 2026-02-13 | 13F | Entropy Technologies, LP | 0 | -100,00 | 0 | |||||
| 2026-02-11 | 13F | Jpmorgan Chase & Co | 333.740 | 4,52 | 12.519 | 32,31 | ||||
| 2026-01-29 | 13F | Pictet Asset Management Holding SA | 8.931 | 335 | ||||||
| 2026-02-17 | 13F | Creative Planning | 69.813 | 9,03 | 2.619 | 38,01 | ||||
| 2026-02-03 | 13F | SBI Securities Co., Ltd. | 1.225 | 22,26 | 46 | 55,17 | ||||
| 2026-02-12 | 13F | Polen Capital Management Llc | 0 | -100,00 | 0 | |||||
| 2026-02-17 | 13F | Aqr Capital Management Llc | 499.485 | 34,75 | 18.736 | 70,60 | ||||
| 2026-03-06 | 13F | Hsbc Holdings Plc | 6.671 | 254 | ||||||
| 2026-02-09 | 13F | Fisher Asset Management, LLC | 85.627 | -6,43 | 3.212 | 18,44 | ||||
| 2026-02-17 | 13F | Warren Averett Asset Management, LLC | 7.561 | 2,07 | 284 | 29,22 | ||||
| 2026-02-17 | 13F | Advisor Group Holdings, Inc. | 7.275 | 31,51 | 273 | 66,87 | ||||
| 2026-02-13 | 13F | Manufacturers Life Insurance Company, The | 0 | -100,00 | 0 | |||||
| 2026-02-02 | 13F | AIGH Capital Management LLC | 600.103 | 0,00 | 22.510 | 26,59 | ||||
| 2026-02-17 | 13F | ArrowMark Colorado Holdings LLC | 416.717 | 0,00 | 15.631 | 26,60 | ||||
| 2026-02-10 | 13F | Hillsdale Investment Management Inc. | 280 | -20,00 | 11 | 0,00 | ||||
| 2026-01-09 | 13F | Capstone Wealth Management Group LLC | 27.278 | 0,00 | 1.023 | 26,61 | ||||
| 2026-01-29 | 13F | Kestra Private Wealth Services, Llc | 10.232 | 0,77 | 384 | 27,67 | ||||
| 2026-02-17 | 13F | D. E. Shaw & Co., Inc. | 306.106 | -20,66 | 11.482 | 0,45 | ||||
| 2026-02-17 | 13F | Dark Forest Capital Management Lp | 23.073 | 865 | ||||||
| 2026-02-13 | 13F | Wells Fargo & Company/mn | 57.943 | 43,18 | 2.173 | 81,23 | ||||
| 2026-02-09 | 13F | Bleakley Financial Group, LLC | 14.088 | 17,18 | 528 | 48,31 | ||||
| 2026-02-13 | 13F | Morgan Stanley | 361.769 | 33,72 | 13.570 | 69,27 | ||||
| 2026-02-17 | 13F | Sender Co & Partners, Inc. | 48.292 | 1.811 | ||||||
| 2026-02-17 | 13F | Point72 Asset Management, L.P. | 7.517 | -68,22 | 282 | -59,86 | ||||
| 2026-02-11 | 13F | CenterBook Partners LP | 30.573 | 1.147 | ||||||
| 2026-02-06 | 13F | Pnc Financial Services Group, Inc. | 107 | -27,21 | 4 | 0,00 | ||||
| 2026-02-13 | 13F | American Century Companies Inc | 6.699 | -41,59 | 251 | -25,96 | ||||
| 2026-02-13 | 13F | BNP Paribas Asset Management Holding S.A. | 559 | 57,46 | 0 | |||||
| 2026-02-17 | 13F | Advisory Services Network, LLC | 0 | -100,00 | 0 | |||||
| 2025-11-12 | 13F | Segall Bryant & Hamill, Llc | 0 | -100,00 | 0 | |||||
| 2026-02-13 | 13F | Caxton Associates Llp | 0 | -100,00 | 0 | |||||
| 2026-02-17 | 13F | Tudor Investment Corp Et Al | 213.234 | -28,56 | 7.998 | -9,57 | ||||
| 2026-02-17 | 13F | Millennium Management Llc | 87.120 | -92,12 | 3.268 | -90,02 | ||||
| 2026-04-09 | 13F | Moody National Bank Trust Division | 15.907 | 907 | ||||||
| 2026-02-13 | 13F | Marshall Wace, Llp | 142.619 | 5.350 | ||||||
| 2026-02-17 | 13F | Trexquant Investment LP | 60.498 | -41,48 | 2.269 | -25,92 | ||||
| 2025-11-10 | 13F | Options Solutions, Llc | 0 | -100,00 | 0 | -100,00 | ||||
| 2026-02-06 | 13F | Legato Capital Management LLC | 38.475 | 84,13 | 1.443 | 133,12 | ||||
| 2026-02-13 | 13F | Verition Fund Management LLC | 38.471 | -8,60 | 1.443 | 15,72 | ||||
| 2026-02-17 | 13F | Schonfeld Strategic Advisors LLC | 8.764 | -22,18 | 329 | -1,50 | ||||
| 2026-02-02 | 13F | Kornitzer Capital Management Inc /ks | 20.085 | 0,42 | 753 | 27,20 | ||||
| 2026-02-12 | 13F | CIBC Private Wealth Group, LLC | 3.531 | 132 | ||||||
| 2026-02-17 | 13F | Aquatic Capital Management LLC | 8.558 | -81,80 | 321 | -76,96 | ||||
| 2026-02-09 | 13F | Harbour Investments, Inc. | 6 | 0,00 | 0 | |||||
| 2026-02-11 | 13F | Hilton Head Capital Partners, LLC | 239 | 9 | ||||||
| 2026-02-17 | 13F | Raymond James Financial Inc | Put | 0 | -100,00 | 0 | ||||
| 2026-02-12 | 13F | Renaissance Technologies Llc | 107.500 | -48,79 | 4.032 | -35,17 | ||||
| 2026-02-13 | 13F | Dynamic Technology Lab Private Ltd | 13.070 | 490 | ||||||
| 2026-02-09 | 13F | King Luther Capital Management Corp | 9.000 | -65,38 | 338 | -56,23 | ||||
| 2026-02-10 | 13F | Connor, Clark & Lunn Investment Management Ltd. | 212.105 | 29,49 | 7.956 | 63,94 | ||||
| 2026-02-09 | 13F | Emerald Advisers, Llc | 781.877 | 60,72 | 29.328 | 103,47 |