Grundlæggende statistik
| Institutionelle ejere | 126 total, 126 long only, 0 short only, 0 long/short - change of 2,44% MRQ |
| Gennemsnitlig porteføljeallokering | 0.2268 % - change of 11,13% MRQ |
| Institutionelle aktier (lange) | 39.133.611 (ex 13D/G) - change of 0,17MM shares 0,45% MRQ |
| Institutionel værdi (lang) | $ 2.037.141 USD ($1000) |
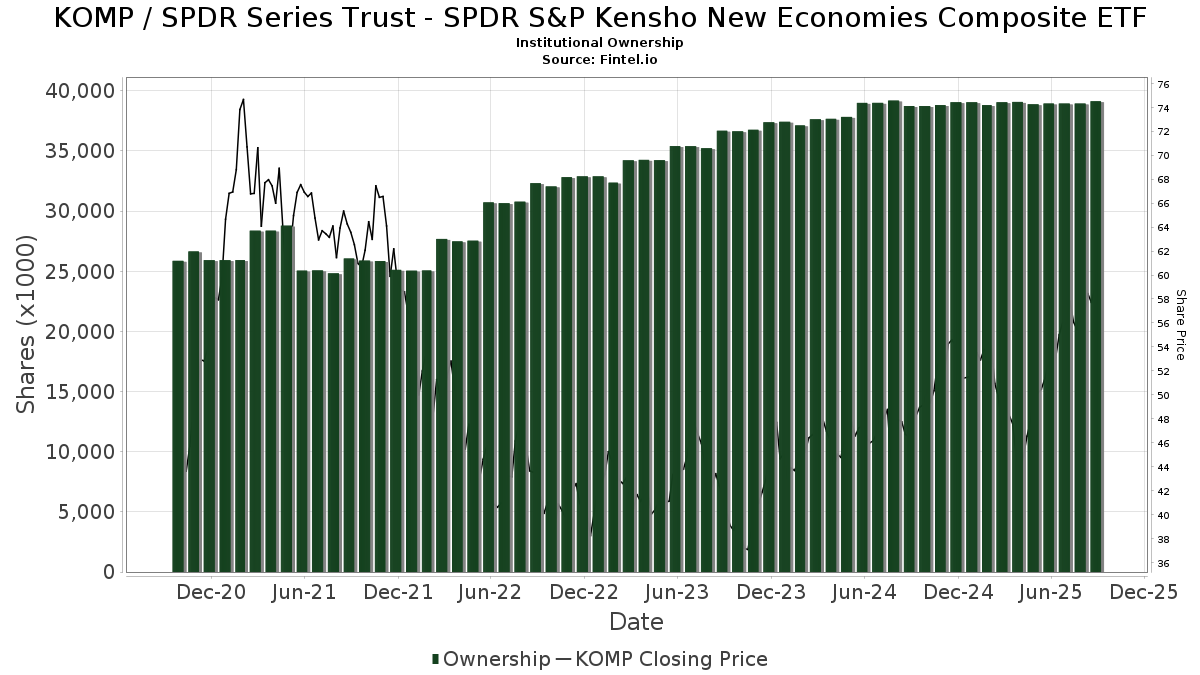
Institutionelt ejerskab og aktionærer
SPDR Series Trust - SPDR S&P Kensho New Economies Composite ETF (US:KOMP) har 126 institutionelle ejere og aktionærer, der har indsendt 13D/G- eller 13F-formularer til Securities Exchange Commission (SEC). Disse institutioner har i alt 39,133,611 aktier. Største aktionærer omfatter Financial Engines Advisors L.L.C., Betterment LLC, Strategic Advocates LLC, Morgan Stanley, Mariner, LLC, Royal Bank Of Canada, LPL Financial LLC, Christopher J. Hasenberg, Inc, Baird Financial Group, Inc., and Towerpoint Wealth, LLC .
SPDR Series Trust - SPDR S&P Kensho New Economies Composite ETF (ARCA:KOMP) institutionel ejerskabsstruktur viser aktuelle positioner i virksomheden efter institutioner og fonde, samt seneste ændringer i positionsstørrelse. Større aktionærer kan omfatte individuelle investorer, investeringsforeninger, hedgefonde eller institutioner. Skema 13D angiver, at investoren besidder (eller besidder) mere end 5 % af virksomheden og har til hensigt (eller har til hensigt at) aktivt at forfølge en ændring i forretningsstrategi. Skema 13G indikerer en passiv investering på over 5%.
The share price as of September 19, 2025 is 62,14 / share. Previously, on September 20, 2024, the share price was 48,25 / share. This represents an increase of 28,79% over that period.
Fondens stemningsscore
Fund Sentiment Score (fka Ownership Accumulation Score) finder de aktier, der bliver mest købt af fonde. Det er resultatet af en sofistikeret, multi-faktor kvantitativ model, der identificerer virksomheder med de højeste niveauer af institutionel akkumulering. Scoringsmodellen bruger en kombination af den samlede stigning i oplyste ejere, ændringerne i porteføljeallokeringer i disse ejere og andre målinger. Tallet går fra 0 til 100, hvor højere tal indikerer et højere niveau af akkumulering for sine jævnaldrende, og 50 er gennemsnittet.
Opdateringsfrekvens: Dagligt
Se Ownership Explorer, som giver en liste over højest rangerende virksomheder.
AI+ Ask Fintel’s AI assistant about SPDR Series Trust - SPDR S&P Kensho New Economies Composite ETF.
Thinking of good questions…
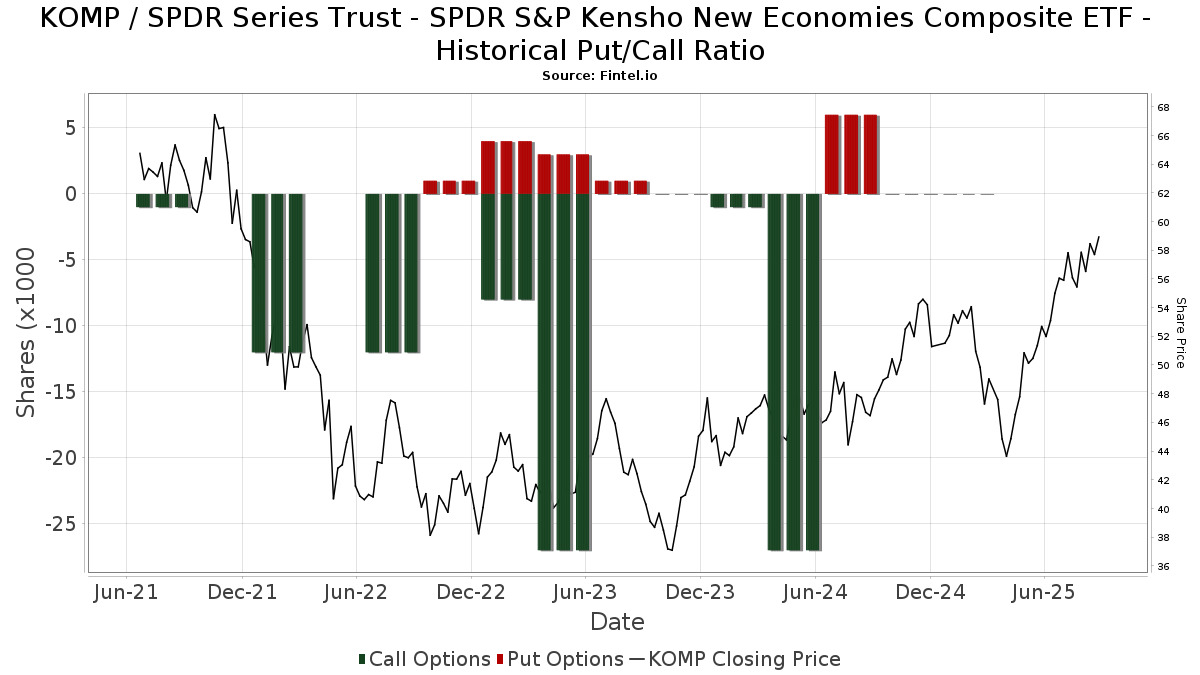
Institutionel Put/Call-forhold
Ud over at indberette standardaktie- og gældsudstedelser skal institutter med mere end 100 mill. aktiver under forvaltning også oplyse deres put- og call-optionsbeholdninger. Da salgsoptioner generelt indikerer negativ stemning, og købsoptioner indikerer positiv stemning, kan vi få en fornemmelse af den overordnede institutionelle stemning ved at plotte forholdet mellem put og kald. Diagrammet til højre viser det historiske put/call-forhold for dette instrument.
Brug af Put/Call Ratio som en indikator for investorernes stemning overvinder en af de vigtigste mangler ved at bruge totalt institutionelt ejerskab, som er, at en betydelig mængde af aktiver under forvaltning investeres passivt for at spore indekser. Passivt forvaltede fonde køber typisk ikke optioner, så indikatoren for put/call-forholdet følger mere nøje følelsen af aktivt forvaltede fonde.
13F og NPORT arkivering
Detaljer om 13F-arkivering er gratis. Detaljer om NP-ansøgninger kræver et premium-medlemskab. Grønne rækker angiver nye positioner. Røde rækker angiver lukkede positioner. Klik på linket ikon for at se den fulde transaktionshistorik.
Opgrader
for at låse premium-data op og eksportere til Excel ![]() .
.
| Fil dato | Kilde | Investor | Type | Gennemsnitlig pris (Øst) |
Aktier | Δ Aktier (%) |
Rapporteret Værdi ($1000) |
Δ Værdi (%) |
Port Alloc (%) |
|
|---|---|---|---|---|---|---|---|---|---|---|
| 2025-08-14 | 13F | Ancora Advisors, LLC | 640 | 126,15 | 35 | 161,54 | ||||
| 2025-07-11 | 13F | Pinnacle Bancorp, Inc. | 468 | 0,00 | 25 | 19,05 | ||||
| 2025-08-08 | 13F | Austin Wealth Management, LLC | 37.713 | -3,77 | 2.104 | 16,24 | ||||
| 2025-07-30 | 13F | Crewe Advisors LLC | 351 | 216,22 | 19 | 280,00 | ||||
| 2025-07-24 | 13F | Comprehensive Money Management Services LLC | 20.210 | 3,99 | 1.099 | 21,71 | ||||
| 2025-08-12 | 13F | Wayfinding Financial, LLC | 0 | -100,00 | 0 | |||||
| 2025-05-12 | 13F | Sandy Spring Bank | 1.543 | 0,00 | 72 | -8,97 | ||||
| 2025-08-01 | 13F | Envestnet Asset Management Inc | 5.720 | 1,74 | 311 | 19,16 | ||||
| 2025-05-07 | 13F | Evermay Wealth Management Llc | 0 | -100,00 | 0 | -100,00 | ||||
| 2025-07-24 | 13F | Horizon Bancorp Inc /in/ | 8 | 0,00 | 0 | |||||
| 2025-08-14 | 13F | CoreCap Advisors, LLC | 279 | -70,88 | 15 | -65,91 | ||||
| 2025-08-14 | 13F | UBS Group AG | 35.996 | 625,14 | 1.957 | 750,87 | ||||
| 2025-08-13 | 13F | Kilter Group LLC | 202 | 11 | ||||||
| 2025-05-12 | 13F | Quantinno Capital Management LP | 0 | -100,00 | 0 | |||||
| 2025-08-06 | 13F | Commonwealth Equity Services, Llc | 62.700 | -43,57 | 3 | -40,00 | ||||
| 2025-06-17 | 13F | Howe & Rusling Inc | 0 | -100,00 | 0 | |||||
| 2025-08-12 | 13F | RPG Investment Advisory, LLC | 8.182 | -55,76 | 445 | -48,31 | ||||
| 2025-08-14 | 13F | Main Street Financial Solutions, LLC | 0 | -100,00 | 0 | |||||
| 2025-07-24 | 13F | Us Bancorp \de\ | 142 | 389,66 | 8 | 600,00 | ||||
| 2025-07-30 | 13F | Brookstone Capital Management | 6.011 | -2,09 | 327 | 14,39 | ||||
| 2025-07-21 | 13F | Crews Bank & Trust | 500 | 0,00 | 27 | 17,39 | ||||
| 2025-08-14 | 13F | Talon Private Wealth, LLC | 1.056 | 57 | ||||||
| 2025-07-24 | 13F | Capital Advisors, Ltd. LLC | 1.382 | 0,00 | 0 | |||||
| 2025-08-06 | 13F | Entrewealth, Llc | 4.452 | 242 | ||||||
| 2025-08-25 | NP | Connetic Venture Capital Access Fund | 6.028 | 328 | ||||||
| 2025-08-12 | 13F | Proequities, Inc. | 0 | 0 | ||||||
| 2025-08-08 | 13F | SBI Securities Co., Ltd. | 50 | 0,00 | 3 | 0,00 | ||||
| 2025-07-16 | 13F | Meridian Financial, LLC | 5.657 | -5,81 | 308 | 10,04 | ||||
| 2025-07-23 | 13F | Opulen Financial Group LLC | 8.012 | -5,82 | 436 | 10,13 | ||||
| 2025-08-13 | 13F | Continuum Advisory, LLC | 0 | -100,00 | 0 | |||||
| 2025-08-05 | 13F | Bank Of Montreal /can/ | 1.636 | 0,00 | 89 | 15,79 | ||||
| 2025-07-29 | 13F | Stratos Wealth Advisors, LLC | 32.906 | -6,48 | 1.789 | 9,42 | ||||
| 2025-08-11 | 13F | Strategic Wealth Partners, Ltd. | 91 | 5 | ||||||
| 2025-05-15 | 13F | Human Investing LLC | 0 | -100,00 | 0 | |||||
| 2025-07-18 | 13F | Lynx Investment Advisory | 5.467 | 0,24 | 297 | 17,39 | ||||
| 2025-08-08 | 13F | Crossmark Global Holdings, Inc. | 17.561 | -0,35 | 955 | 16,89 | ||||
| 2025-08-08 | 13F | Creative Planning | 8.494 | 0,85 | 462 | 17,90 | ||||
| 2025-07-24 | 13F | IFP Advisors, Inc | 3.124 | 0,06 | 170 | 16,55 | ||||
| 2025-04-22 | 13F | Cambridge Investment Research Advisors, Inc. | 0 | -100,00 | 0 | |||||
| 2025-04-23 | 13F | Sheets Smith Wealth Management | 0 | -100,00 | 0 | |||||
| 2025-05-12 | 13F | Berger Financial Group, Inc | 0 | -100,00 | 0 | |||||
| 2025-08-07 | 13F | Allworth Financial LP | 785 | 0,00 | 43 | 16,67 | ||||
| 2025-08-14 | 13F | Ameriprise Financial Inc | 38.511 | -9,67 | 2.092 | 5,82 | ||||
| 2025-07-28 | 13F | Aries Wealth Management | 3.745 | 204 | ||||||
| 2025-07-15 | 13F | McCarthy & Cox | 56.515 | 17,28 | 3.073 | 37,19 | ||||
| 2025-08-06 | 13F | Atlantic Union Bankshares Corp | 1.543 | 84 | ||||||
| 2025-07-28 | 13F | Harbour Investments, Inc. | 96 | 0,00 | 5 | 25,00 | ||||
| 2025-08-18 | 13F | Geneos Wealth Management Inc. | 34.388 | -1,51 | 1.870 | 15,22 | ||||
| 2025-07-25 | 13F | Northwest Capital Management Inc | 0 | -100,00 | 0 | |||||
| 2025-08-06 | 13F | SNS Financial Group, LLC | 6.265 | 341 | ||||||
| 2025-07-17 | 13F | Sound Income Strategies, LLC | 102 | 3.300,00 | 6 | |||||
| 2025-05-12 | 13F | Founders Financial Alliance, LLC | 0 | -100,00 | 0 | |||||
| 2025-08-08 | 13F | Larson Financial Group LLC | 1.418 | 0,07 | 77 | 18,46 | ||||
| 2025-05-05 | 13F | CBIZ Investment Advisory Services, LLC | 27 | 1 | ||||||
| 2025-05-28 | 13F | Intrua Financial, LLC | 0 | -100,00 | 0 | |||||
| 2025-07-09 | 13F | Towerpoint Wealth, LLC | 101.300 | 8,15 | 5.509 | 26,50 | ||||
| 2025-08-14 | 13F | Capital Planning Advisors, LLC | 8.470 | 0,00 | 461 | 17,05 | ||||
| 2025-08-14 | 13F | Goldman Sachs Group Inc | 19.175 | -79,65 | 1.043 | -76,20 | ||||
| 2025-08-14 | 13F | Colony Group, LLC | 17.894 | 10,79 | 973 | 29,73 | ||||
| 2025-08-04 | 13F | Hantz Financial Services, Inc. | 21 | 0,00 | 0 | |||||
| 2025-05-15 | 13F/A | Orion Portfolio Solutions, LLC | 34.978 | -4,71 | 1.626 | -12,82 | ||||
| 2025-05-15 | 13F | Citadel Advisors Llc | Call | 0 | -100,00 | 0 | -100,00 | |||
| 2025-08-14 | 13F | Bank Of America Corp /de/ | 76.697 | -0,01 | 4.171 | 16,94 | ||||
| 2025-05-15 | 13F | Citadel Advisors Llc | Put | 0 | -100,00 | 0 | -100,00 | |||
| 2025-08-13 | 13F | Russell Investments Group, Ltd. | 58 | -7,94 | 3 | 50,00 | ||||
| 2025-07-15 | 13F | Mather Group, Llc. | 0 | -100,00 | 0 | |||||
| 2025-07-28 | 13F | Essex LLC | 11.155 | -0,40 | 607 | 16,54 | ||||
| 2025-08-11 | 13F | HHM Wealth Advisors, LLC | 195 | 0,00 | 11 | 11,11 | ||||
| 2025-08-14 | 13F | Comerica Bank | 66 | -61,18 | 4 | -57,14 | ||||
| 2025-05-12 | 13F | Richard W. Paul & Associates, LLC | 0 | -100,00 | 0 | -100,00 | ||||
| 2025-08-06 | 13F | AE Wealth Management LLC | 1.544 | -33,04 | 84 | -22,43 | ||||
| 2025-08-12 | 13F | Steward Partners Investment Advisory, Llc | 361 | 0,00 | 20 | 18,75 | ||||
| 2025-08-14 | 13F | Murphy & Mullick Capital Management Corp | 20 | 1 | ||||||
| 2025-04-21 | 13F | Nelson, Van Denburg & Campbell Wealth Management Group, LLC | 0 | -100,00 | 0 | |||||
| 2025-04-22 | 13F | Synergy Financial Management, LLC | 0 | -100,00 | 0 | |||||
| 2025-08-27 | 13F/A | Brinker Capital Investments, LLC | 34.275 | -2,01 | 1.864 | 14,58 | ||||
| 2025-09-04 | 13F/A | Advisor Group Holdings, Inc. | 15.164 | -20,35 | 825 | -6,89 | ||||
| 2025-07-11 | 13F | SILVER OAK SECURITIES, Inc | 17.252 | 0,05 | 938 | 16,09 | ||||
| 2025-07-25 | 13F | We Are One Seven, LLC | 72.685 | 4,33 | 3.953 | 22,01 | ||||
| 2025-07-16 | 13F | NovaPoint Capital, LLC | 0 | -100,00 | 0 | |||||
| 2025-08-14 | 13F | Financial Engines Advisors L.L.C. | 34.307.606 | 3,18 | 1.865.648 | 20,69 | ||||
| 2025-08-14 | 13F | Citadel Advisors Llc | 13.727 | -37,53 | 746 | -26,93 | ||||
| 2025-07-24 | 13F | Trust Co Of Toledo Na /oh/ | 32 | 2 | ||||||
| 2025-07-23 | 13F | Prime Capital Investment Advisors, LLC | 13.351 | -89,68 | 726 | -87,93 | ||||
| 2025-08-05 | 13F | Summit Investment Advisory Services, LLC | 0 | -100,00 | 0 | |||||
| 2025-07-28 | 13F | Ritholtz Wealth Management | 10.755 | -60,46 | 585 | -53,80 | ||||
| 2025-08-11 | 13F | Aptus Capital Advisors, LLC | 92.470 | 8,53 | 5.028 | 26,97 | ||||
| 2025-05-15 | 13F | Two Sigma Securities, Llc | 0 | -100,00 | 0 | |||||
| 2025-07-30 | 13F | Advantage Trust Co | 23.955 | 0,00 | 1.303 | 16,98 | ||||
| 2025-07-22 | 13F | Wealthcare Advisory Partners LLC | 44.561 | 12,68 | 2.423 | 31,83 | ||||
| 2025-08-14 | 13F | Mariner, LLC | 169.266 | 1,88 | 9.205 | 19,18 | ||||
| 2025-08-12 | 13F | Jpmorgan Chase & Co | 118 | -22,88 | 6 | -14,29 | ||||
| 2025-07-09 | 13F | Christopher J. Hasenberg, Inc | 117.008 | 6.363 | ||||||
| 2025-05-15 | 13F | Family Office Research LLC | 0 | -100,00 | 0 | |||||
| 2025-07-14 | 13F | Painted Porch Advisors LLC | 154 | 8 | ||||||
| 2025-08-12 | 13F | Global Retirement Partners, LLC | 986 | -1,79 | 54 | 3,92 | ||||
| 2025-07-25 | 13F | Cwm, Llc | 60.964 | 0,20 | 3 | 50,00 | ||||
| 2025-08-07 | 13F | Hughes Financial Services, LLC | 20.912 | -41,91 | 1.160 | -31,26 | ||||
| 2025-08-13 | 13F | Jones Financial Companies Lllp | 397 | 21 | ||||||
| 2025-05-15 | 13F | Two Sigma Investments, Lp | 0 | -100,00 | 0 | |||||
| 2025-07-29 | 13F | Mezzasalma Advisors, LLC | 3.776 | 205 | ||||||
| 2025-07-09 | 13F | WealthCare Investment Partners, LLC | 22.880 | 4,93 | 1.274 | 36,70 | ||||
| 2025-07-28 | 13F | RFG Advisory, LLC | 0 | -100,00 | 0 | |||||
| 2025-07-28 | 13F | Lunt Capital Management, Inc. | 41.996 | -0,58 | 2.284 | 16,30 | ||||
| 2025-08-13 | 13F | Capital Analysts, Inc. | 491 | 0,00 | 0 | |||||
| 2025-08-11 | 13F | Anfield Capital Management, LLC | 26 | 0,00 | 1 | 0,00 | ||||
| 2025-08-04 | 13F | Assetmark, Inc | 5 | 0 | ||||||
| 2025-08-12 | 13F | O'shaughnessy Asset Management, Llc | 7.485 | 212,27 | 407 | 266,67 | ||||
| 2025-08-14 | 13F | Mercer Global Advisors Inc /adv | 4.119 | -7,17 | 224 | 8,25 | ||||
| 2025-07-14 | 13F | Financial Enhancement Group LLC | 18.105 | 1.005 | ||||||
| 2025-07-25 | 13F | Concord Wealth Partners | 242 | 0,00 | 13 | 18,18 | ||||
| 2025-08-14 | 13F | Jane Street Group, Llc | 0 | -100,00 | 0 | |||||
| 2025-08-13 | 13F | Baird Financial Group, Inc. | 103.639 | 5,85 | 5.636 | 23,82 | ||||
| 2025-08-14 | 13F | GWM Advisors LLC | 540 | 40,26 | 29 | 70,59 | ||||
| 2025-08-11 | 13F | Bellwether Advisors, LLC | 1.179 | 0,00 | 64 | 18,52 | ||||
| 2025-07-30 | 13F | Princeton Global Asset Management LLC | 400 | 0,00 | 22 | 16,67 | ||||
| 2025-05-15 | 13F | EP Wealth Advisors, Inc. | 0 | -100,00 | 0 | -100,00 | ||||
| 2025-07-23 | 13F | 1 North Wealth Services Llc | 25 | 0,00 | 1 | 0,00 | ||||
| 2025-08-07 | 13F | Resources Investment Advisors, LLC. | 10.146 | 2,99 | 552 | 20,57 | ||||
| 2025-07-22 | 13F | SOL Capital Management CO | 25.988 | -24,26 | 1 | 0,00 | ||||
| 2025-07-15 | 13F | North Star Investment Management Corp. | 350 | 0,00 | 19 | 18,75 | ||||
| 2025-08-11 | 13F | HighTower Advisors, LLC | 27.192 | -13,47 | 1.479 | 1,16 | ||||
| 2025-08-11 | 13F | Root Financial Partners, LLC | 4.155 | 226 | ||||||
| 2025-08-15 | 13F | Tower Research Capital LLC (TRC) | 9.145 | -29,51 | 497 | -17,58 | ||||
| 2025-07-10 | 13F | Exchange Traded Concepts, Llc | 4.815 | 262 | ||||||
| 2025-08-05 | 13F | Key FInancial Inc | 97 | 16,87 | 5 | 66,67 | ||||
| 2025-08-05 | 13F | Simplex Trading, Llc | 0 | -100,00 | 0 | |||||
| 2025-08-08 | 13F | Capital Investment Advisory Services, LLC | 571 | 0,00 | 31 | 19,23 | ||||
| 2025-07-11 | 13F | Farther Finance Advisors, LLC | 7.372 | -38,17 | 401 | -28,32 | ||||
| 2025-08-14 | 13F | Wells Fargo & Company/mn | 23.181 | 2,81 | 1.261 | 20,23 | ||||
| 2025-07-29 | 13F | Fundamentun, Llc | 0 | -100,00 | 0 | -100,00 | ||||
| 2025-08-14 | 13F | Sherman Asset Management, Inc. | 7.594 | -52,51 | 413 | -44,55 | ||||
| 2025-08-14 | 13F | Royal Bank Of Canada | 141.721 | 41,61 | 7.707 | 65,64 | ||||
| 2025-08-13 | 13F | Northwestern Mutual Wealth Management Co | 1.525 | 6,87 | 83 | 24,24 | ||||
| 2025-08-15 | 13F | Morgan Stanley | 353.742 | -58,01 | 19.237 | -50,88 | ||||
| 2025-07-08 | 13F | Parallel Advisors, LLC | 28 | 21,74 | 2 | 0,00 | ||||
| 2025-07-25 | 13F | Apollon Wealth Management, LLC | 0 | -100,00 | 0 | |||||
| 2025-05-14 | 13F | Toroso Investments, LLC | 0 | -100,00 | 0 | |||||
| 2025-08-08 | 13F | Good Life Advisors, LLC | 50.838 | 1,91 | 2.765 | 19,19 | ||||
| 2025-08-14 | 13F | Susquehanna International Group, Llp | 30.132 | 178,56 | 1.639 | 226,29 | ||||
| 2025-08-04 | 13F | Quaker Wealth Management, LLC | 49 | 3 | ||||||
| 2025-08-14 | 13F | Integrated Wealth Concepts LLC | 5.036 | -0,92 | 274 | 15,68 | ||||
| 2025-08-08 | 13F | Gts Securities Llc | 18.402 | 279,11 | 1.001 | 344,44 | ||||
| 2025-08-14 | 13F | Betterment LLC | 1.517.997 | -14,40 | 83 | 0,00 | ||||
| 2025-08-14 | 13F | Stifel Financial Corp | 17.636 | -0,88 | 959 | 15,96 | ||||
| 2025-07-08 | 13F | Strategic Advocates LLC | 551.043 | 2,71 | 29.966 | 20,14 | ||||
| 2025-08-01 | 13F | Penobscot Wealth Management | 49.701 | 8,95 | 2.703 | 27,45 | ||||
| 2025-04-15 | 13F | Fifth Third Bancorp | 0 | -100,00 | 0 | |||||
| 2025-07-29 | 13F | Financial Guidance Group, Inc. | 92.333 | 8,55 | 5.021 | 26,99 | ||||
| 2025-07-07 | 13F | Global Wealth Strategies & Associates | 0 | -100,00 | 0 | |||||
| 2025-08-12 | 13F | Archer Investment Corp | 67 | 0,00 | 4 | 0,00 | ||||
| 2025-08-14 | 13F | Raymond James Financial Inc | 91.819 | -5,86 | 4.993 | 10,12 | ||||
| 2025-08-04 | 13F | Quaker Wealth Management, LLC | Put | 0 | -100,00 | 0 | -100,00 | |||
| 2025-07-31 | 13F | Wealthfront Advisers Llc | 5.466 | 21,52 | 297 | 42,11 | ||||
| 2025-07-31 | 13F | Optimum Investment Advisors | 796 | 0,00 | 43 | 16,22 | ||||
| 2025-08-08 | 13F | Cetera Investment Advisers | 21.734 | 60,37 | 1.182 | 87,46 | ||||
| 2025-08-12 | 13F | LPL Financial LLC | 127.668 | -33,76 | 6.943 | -22,51 | ||||
| 2025-05-14 | 13F | Fisher Asset Management, LLC | 0 | -100,00 | 0 | |||||
| 2025-07-10 | 13F | Global Financial Private Client, LLC | 0 | -100,00 | 0 | |||||
| 2025-08-14 | 13F | Fmr Llc | 6.322 | -13,80 | 344 | 0,88 | ||||
| 2025-08-14 | 13F | IHT Wealth Management, LLC | 10.688 | -2,61 | 581 | 13,92 | ||||
| 2025-07-28 | 13F | Duncker Streett & Co Inc | 0 | -100,00 | 0 | -100,00 | ||||
| 2025-05-16 | 13F | Coppell Advisory Solutions LLC | 0 | -100,00 | 0 | |||||
| 2025-08-12 | 13F | Coston, McIsaac & Partners | 349 | 0,00 | 0 | |||||
| 2025-08-08 | 13F | Pnc Financial Services Group, Inc. | 5.457 | 251,84 | 297 | 311,11 |
Other Listings
| MX:KOMP |