Grundlæggende statistik
| Institutionelle ejere | 109 total, 109 long only, 0 short only, 0 long/short - change of 10,10% MRQ |
| Gennemsnitlig porteføljeallokering | 0.4307 % - change of 105,32% MRQ |
| Institutionelle aktier (lange) | 8.118.786 (ex 13D/G) - change of 0,60MM shares 8,01% MRQ |
| Institutionel værdi (lang) | $ 672.289 USD ($1000) |
Institutionelt ejerskab og aktionærer
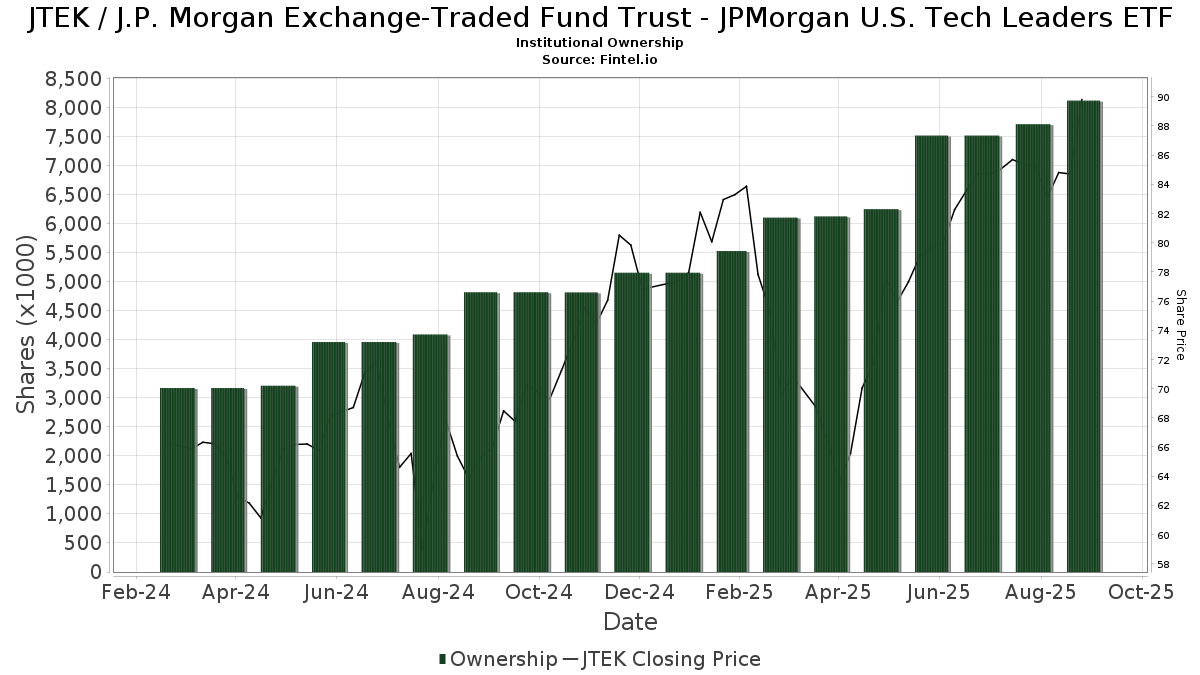
J.P. Morgan Exchange-Traded Fund Trust - JPMorgan U.S. Tech Leaders ETF (US:JTEK) har 109 institutionelle ejere og aktionærer, der har indsendt 13D/G- eller 13F-formularer til Securities Exchange Commission (SEC). Disse institutioner har i alt 8,118,786 aktier. Største aktionærer omfatter Jpmorgan Chase & Co, Hughes Financial Services, LLC, Wells Fargo & Company/mn, UBS Group AG, Miracle Mile Advisors, LLC, LPL Financial LLC, Financially Speaking Inc, Kestra Advisory Services, LLC, Vertex Planning Partners, LLC, and Tradition Wealth Management, LLC .
J.P. Morgan Exchange-Traded Fund Trust - JPMorgan U.S. Tech Leaders ETF (NasdaqGM:JTEK) institutionel ejerskabsstruktur viser aktuelle positioner i virksomheden efter institutioner og fonde, samt seneste ændringer i positionsstørrelse. Større aktionærer kan omfatte individuelle investorer, investeringsforeninger, hedgefonde eller institutioner. Skema 13D angiver, at investoren besidder (eller besidder) mere end 5 % af virksomheden og har til hensigt (eller har til hensigt at) aktivt at forfølge en ændring i forretningsstrategi. Skema 13G indikerer en passiv investering på over 5%.
The share price as of September 12, 2025 is 89,86 / share. Previously, on September 16, 2024, the share price was 66,22 / share. This represents an increase of 35,70% over that period.
Fondens stemningsscore
Fund Sentiment Score (fka Ownership Accumulation Score) finder de aktier, der bliver mest købt af fonde. Det er resultatet af en sofistikeret, multi-faktor kvantitativ model, der identificerer virksomheder med de højeste niveauer af institutionel akkumulering. Scoringsmodellen bruger en kombination af den samlede stigning i oplyste ejere, ændringerne i porteføljeallokeringer i disse ejere og andre målinger. Tallet går fra 0 til 100, hvor højere tal indikerer et højere niveau af akkumulering for sine jævnaldrende, og 50 er gennemsnittet.
Opdateringsfrekvens: Dagligt
Se Ownership Explorer, som giver en liste over højest rangerende virksomheder.
Institutionel Put/Call-forhold
Ud over at indberette standardaktie- og gældsudstedelser skal institutter med mere end 100 mill. aktiver under forvaltning også oplyse deres put- og call-optionsbeholdninger. Da salgsoptioner generelt indikerer negativ stemning, og købsoptioner indikerer positiv stemning, kan vi få en fornemmelse af den overordnede institutionelle stemning ved at plotte forholdet mellem put og kald. Diagrammet til højre viser det historiske put/call-forhold for dette instrument.
Brug af Put/Call Ratio som en indikator for investorernes stemning overvinder en af de vigtigste mangler ved at bruge totalt institutionelt ejerskab, som er, at en betydelig mængde af aktiver under forvaltning investeres passivt for at spore indekser. Passivt forvaltede fonde køber typisk ikke optioner, så indikatoren for put/call-forholdet følger mere nøje følelsen af aktivt forvaltede fonde.
13F og NPORT arkivering
Detaljer om 13F-arkivering er gratis. Detaljer om NP-ansøgninger kræver et premium-medlemskab. Grønne rækker angiver nye positioner. Røde rækker angiver lukkede positioner. Klik på linket ikon for at se den fulde transaktionshistorik.
Opgrader
for at låse premium-data op og eksportere til Excel ![]() .
.
| Fil dato | Kilde | Investor | Type | Gennemsnitlig pris (Øst) |
Aktier | Δ Aktier (%) |
Rapporteret Værdi ($1000) |
Δ Værdi (%) |
Port Alloc (%) |
|
|---|---|---|---|---|---|---|---|---|---|---|
| 2025-07-21 | 13F | HighMark Wealth Management LLC | 1.726 | 0,00 | 146 | 26,09 | ||||
| 2025-08-06 | 13F | Mascagni Wealth Management, Inc. | 3.987 | -23,68 | 337 | -4,27 | ||||
| 2025-07-17 | 13F | Janney Montgomery Scott LLC | 8.174 | 80,12 | 1 | |||||
| 2025-08-14 | 13F | GWM Advisors LLC | 0 | -100,00 | 0 | |||||
| 2025-08-08 | 13F/A | Ignite Planners, LLC | 3.227 | -6,41 | 276 | 13,58 | ||||
| 2025-08-14 | 13F | Circle Wealth Management, LLC | 7.060 | 0,00 | 596 | 25,74 | ||||
| 2025-08-14 | 13F | IHT Wealth Management, LLC | 2.508 | -18,04 | 212 | -4,09 | ||||
| 2025-07-31 | 13F | CVA Family Office, LLC | 25.175 | 14,36 | 2.126 | 43,75 | ||||
| 2025-08-25 | 13F | BLVD Private Wealth, LLC | 23.099 | 1.951 | ||||||
| 2025-07-10 | 13F | Guided Capital Wealth Management, LLC | 37.595 | -1,23 | 3.175 | 24,17 | ||||
| 2025-08-12 | 13F | Tradition Wealth Management, LLC | 127.414 | 3,15 | 10.761 | 29,67 | ||||
| 2025-07-28 | 13F | Mutual Advisors, LLC | 2.974 | -9,52 | 254 | 10,96 | ||||
| 2025-05-14 | 13F | Monterey Private Wealth, Inc. | 3.175 | 213 | ||||||
| 2025-08-13 | 13F | Russell Investments Group, Ltd. | 14 | 1 | ||||||
| 2025-07-25 | 13F | Concurrent Investment Advisors, LLC | 4.583 | 387 | ||||||
| 2025-07-31 | 13F | Cambridge Investment Research Advisors, Inc. | 14.462 | 51,58 | 1 | |||||
| 2025-07-28 | 13F | Mowery & Schoenfeld Wealth Management, LLC | 0 | -100,00 | 0 | |||||
| 2025-08-14 | 13F | Stifel Financial Corp | 0 | -100,00 | 0 | |||||
| 2025-08-18 | 13F | Geneos Wealth Management Inc. | 0 | -100,00 | 0 | -100,00 | ||||
| 2025-04-21 | 13F | Nelson, Van Denburg & Campbell Wealth Management Group, LLC | 0 | -100,00 | 0 | |||||
| 2025-07-22 | 13F | Miracle Mile Advisors, LLC | 348.356 | 41,74 | 29.422 | 78,17 | ||||
| 2025-08-14 | 13F | D. E. Shaw & Co., Inc. | 17.048 | 315,80 | 1.440 | 423,27 | ||||
| 2025-07-18 | 13F | Truist Financial Corp | 10.150 | 0,18 | 857 | 26,03 | ||||
| 2025-08-13 | 13F | Flow Traders U.s. Llc | 0 | -100,00 | 0 | |||||
| 2025-08-13 | 13F | Northwestern Mutual Wealth Management Co | 53 | -29,33 | 4 | -20,00 | ||||
| 2025-07-22 | 13F | Sutton Place Investors Llc | 2.509 | 212 | ||||||
| 2025-08-13 | 13F | Kayne Anderson Rudnick Investment Management Llc | 0 | -100,00 | 0 | |||||
| 2025-08-12 | 13F | Proequities, Inc. | 0 | 0 | ||||||
| 2025-08-18 | 13F/A | Kestra Investment Management, LLC | 239 | 20 | ||||||
| 2025-05-06 | 13F | Proficio Capital Partners LLC | 0 | -100,00 | 0 | -100,00 | ||||
| 2025-07-29 | 13F | SilverOak Wealth Management LLC | 124.425 | 16,64 | 10.509 | 46,62 | ||||
| 2025-08-14 | 13F | Kovitz Investment Group Partners, LLC | 3.253 | 275 | ||||||
| 2025-08-14 | 13F | Comerica Bank | 500 | 0,00 | 42 | 27,27 | ||||
| 2025-07-28 | 13F | BRYN MAWR TRUST Co | 357 | -16,98 | 30 | 7,14 | ||||
| 2025-08-14 | 13F | Mariner, LLC | 19.360 | 34,48 | 1.635 | 69,08 | ||||
| 2025-08-14 | 13F | Wells Fargo & Company/mn | 484.656 | 87,00 | 40.934 | 135,06 | ||||
| 2025-08-08 | 13F | Kingsview Wealth Management, LLC | 17.351 | 4,45 | 1.465 | 31,27 | ||||
| 2025-05-15 | 13F | Talon Private Wealth, LLC | 0 | -100,00 | 0 | -100,00 | ||||
| 2025-04-04 | 13F | Quent Capital, LLC | 0 | -100,00 | 0 | |||||
| 2025-08-14 | 13F | Wiley Bros.-aintree Capital, Llc | 7.748 | 654 | ||||||
| 2025-08-14 | 13F | UBS Group AG | 433.790 | 19,16 | 36.638 | 49,79 | ||||
| 2025-08-08 | 13F | Creative Planning | 4.195 | -3,41 | 354 | 21,65 | ||||
| 2025-08-12 | 13F | Integras Partners LLC | 29.163 | 698,99 | 2.463 | 905,31 | ||||
| 2025-07-16 | 13F | Stephenson National Bank & Trust | 1.300 | 8,33 | 110 | 36,25 | ||||
| 2025-08-01 | 13F | Bessemer Group Inc | 42 | 0,00 | 0 | |||||
| 2025-08-13 | 13F | Capital Analysts, Inc. | 0 | -100,00 | 0 | |||||
| 2025-07-17 | 13F | Sound Income Strategies, LLC | 145 | 0,00 | 12 | 33,33 | ||||
| 2025-07-17 | 13F | Archford Capital Strategies, LLC | 11.247 | -17,02 | 950 | 4,29 | ||||
| 2025-08-06 | 13F | Hallmark Capital Management Inc | 34.898 | 4,51 | 2.947 | 31,39 | ||||
| 2025-07-23 | 13F | Dohj, Llc | 8.817 | 578 | ||||||
| 2025-07-15 | 13F | Cranbrook Wealth Management, LLC | 0 | -100,00 | 0 | |||||
| 2025-08-07 | 13F | Hughes Financial Services, LLC | 541.805 | 433.344,00 | 46.259 | 578.137,50 | ||||
| 2025-08-11 | 13F | Private Advisor Group, LLC | 12.778 | 3,56 | 1.079 | 30,16 | ||||
| 2025-08-12 | 13F | Global Retirement Partners, LLC | 30 | 3 | ||||||
| 2025-08-14 | 13F | Bank Of America Corp /de/ | 14.930 | -52,01 | 1.261 | -39,71 | ||||
| 2025-08-01 | 13F | Private Wealth Partners, LLC | 17.345 | 6,38 | 1.465 | 33,70 | ||||
| 2025-08-12 | 13F | Vestor Capital, Llc | 4.646 | 0 | ||||||
| 2025-07-24 | 13F | Ulland Investment Advisors, LLC | 22.328 | -2,56 | 2 | 0,00 | ||||
| 2025-08-14 | 13F | Qube Research & Technologies Ltd | 586 | -97,13 | 49 | -96,42 | ||||
| 2025-08-11 | 13F | Aptus Capital Advisors, LLC | 149 | 198,00 | 13 | 300,00 | ||||
| 2025-08-13 | 13F | Renaissance Technologies Llc | 6.300 | 532 | ||||||
| 2025-08-12 | 13F | Jpmorgan Chase & Co | 3.722.157 | -17,45 | 314.373 | 3,77 | ||||
| 2025-07-18 | 13F | Foundry Financial Group, Inc. | 97.293 | -0,01 | 8.217 | 25,70 | ||||
| 2025-08-14 | 13F | Citadel Advisors Llc | 23.620 | 333,00 | 1.995 | 444,81 | ||||
| 2025-07-17 | 13F | Wagner Wealth Management, Llc | 11.098 | 290,64 | 937 | 393,16 | ||||
| 2025-08-14 | 13F | Goldman Sachs Group Inc | 10.627 | -53,93 | 898 | -42,13 | ||||
| 2025-08-13 | 13F | Vertex Planning Partners, LLC | 143.240 | 2,91 | 12.098 | 29,36 | ||||
| 2025-07-25 | 13F | Yarger Wealth Strategies, Llc | 11.863 | 1.002 | ||||||
| 2025-07-18 | 13F | Cooper Financial Group | 5.451 | 0,93 | 460 | 27,07 | ||||
| 2025-08-08 | 13F | Pnc Financial Services Group, Inc. | 150 | 13 | ||||||
| 2025-07-25 | 13F | Cwm, Llc | 1.300 | 0 | ||||||
| 2025-07-09 | 13F | Triumph Capital Management | 20.288 | 50,97 | 1.714 | 89,91 | ||||
| 2025-08-13 | 13F | Twin Peaks Wealth Advisors, LLC | 174 | 15 | ||||||
| 2025-08-14 | 13F | Freedom Financial Partners LLC | 41.551 | 8,81 | 3.508 | 36,76 | ||||
| 2025-07-17 | 13F | Tritonpoint Wealth, Llc | 0 | -100,00 | 0 | |||||
| 2025-08-12 | 13F | Tableaux Llc | 7.759 | 154,48 | 278 | 36,27 | ||||
| 2025-08-14 | 13F | Susquehanna International Group, Llp | 14.524 | -22,26 | 1.227 | -2,31 | ||||
| 2025-08-05 | 13F | Plante Moran Financial Advisors, LLC | 84 | 0,00 | 7 | 40,00 | ||||
| 2025-08-04 | 13F | Pensionmark Financial Group, Llc | 5.720 | -7,74 | 483 | 16,11 | ||||
| 2025-08-12 | 13F | CIBC Private Wealth Group, LLC | 36 | 3 | ||||||
| 2025-07-31 | 13F | Hartford Financial Management Inc. | 64.891 | 11,40 | 5.481 | 40,05 | ||||
| 2025-07-11 | 13F | SILVER OAK SECURITIES, Inc | 10.363 | 190,69 | 875 | 263,07 | ||||
| 2025-07-10 | 13F | Atticus Wealth Management, Llc | 185 | 16 | ||||||
| 2025-08-04 | 13F | Spire Wealth Management | 110 | 9 | ||||||
| 2025-08-07 | 13F | Financially Speaking Inc | 199.329 | 16.835 | ||||||
| 2025-08-06 | 13F | AE Wealth Management LLC | 119 | 52,56 | 10 | 100,00 | ||||
| 2025-07-22 | 13F | MBL Wealth, LLC | 30.574 | 7,02 | 2.582 | 34,55 | ||||
| 2025-08-14 | 13F | Royal Bank Of Canada | 74.831 | 25,05 | 6.320 | 57,21 | ||||
| 2025-08-15 | 13F | Tower Research Capital LLC (TRC) | 360 | -83,38 | 30 | -79,31 | ||||
| 2025-07-30 | NP | ENDW - Cambria Endowment Style ETF | 1.667 | 128 | ||||||
| 2025-08-11 | 13F | HighTower Advisors, LLC | 19.929 | 2,75 | 1.683 | 29,16 | ||||
| 2025-08-14 | 13F | Mml Investors Services, Llc | 3.499 | 0 | ||||||
| 2025-08-14 | 13F | Silvercrest Asset Management Group Llc | 30.910 | -14,07 | 2.611 | 8,03 | ||||
| 2025-08-15 | 13F | Kestra Advisory Services, LLC | 177.855 | 18,29 | 15.022 | 48,69 | ||||
| 2025-08-07 | 13F | Fagan Associates, Inc. | 67.359 | -27,04 | 5.689 | -8,27 | ||||
| 2025-08-13 | 13F | Jones Financial Companies Lllp | 9.610 | 306,00 | 802 | 401,25 | ||||
| 2025-08-14 | 13F | Horizon Investments, LLC | 49.099 | 4.147 | ||||||
| 2025-07-24 | 13F | Us Bancorp \de\ | 0 | -100,00 | 0 | |||||
| 2025-07-23 | 13F | Valmark Advisers, Inc. | 3.246 | 4,01 | 274 | 31,10 | ||||
| 2025-08-06 | 13F | Commonwealth Equity Services, Llc | 101.937 | 5,36 | 9 | 33,33 | ||||
| 2025-07-09 | 13F | Krilogy Financial LLC | 19.232 | 34,12 | 1.624 | 68,64 | ||||
| 2025-08-14 | 13F | Operose Advisors LLC | 72 | 6 | ||||||
| 2025-08-15 | 13F | Morgan Stanley | 2.198 | 65,64 | 186 | 107,87 | ||||
| 2025-07-24 | 13F | IFP Advisors, Inc | 3.425 | 289 | ||||||
| 2025-08-07 | 13F | Allworth Financial LP | 142 | 0,00 | 12 | 22,22 | ||||
| 2025-07-31 | 13F | Briaud Financial Planning, Inc | 760 | 0,00 | 0 | |||||
| 2025-08-14 | 13F | Family Management Corp | 6.480 | 13,49 | 547 | 42,82 | ||||
| 2025-07-30 | 13F | Avidian Wealth Solutions, LLC | 5.242 | 8,57 | 443 | 36,42 | ||||
| 2025-08-06 | 13F | Founders Financial Securities Llc | 49.099 | -3,71 | 4.147 | 17,12 | ||||
| 2025-09-04 | 13F/A | Advisor Group Holdings, Inc. | 57.018 | 97,75 | 4.816 | 148,58 | ||||
| 2025-07-15 | 13F | Mather Group, Llc. | 0 | -100,00 | 0 | |||||
| 2025-08-08 | 13F | Comprehensive Financial Planning, Inc./PA | 241 | 0,00 | 20 | 25,00 | ||||
| 2025-08-13 | 13F | Beacon Pointe Advisors, LLC | 11.030 | -0,45 | 932 | 25,13 | ||||
| 2025-08-14 | 13F | Jane Street Group, Llc | 0 | -100,00 | 0 | |||||
| 2025-08-12 | 13F | LPL Financial LLC | 293.794 | 21,95 | 24.814 | 53,29 | ||||
| 2025-08-12 | 13F | Armor Investment Advisors, LLC | 20 | 0,00 | 2 | 0,00 | ||||
| 2025-08-13 | 13F | Truvestments Capital Llc | 0 | -100,00 | 0 | |||||
| 2025-07-21 | 13F | Mattern Capital Management, Llc | 4.201 | 355 | ||||||
| 2025-05-07 | 13F | Indie Asset Partners, LLC | 0 | -100,00 | 0 | |||||
| 2025-08-14 | 13F | Raymond James Financial Inc | 117.874 | 23,82 | 9.956 | 55,64 | ||||
| 2025-08-08 | 13F | TD Capital Management LLC | 66 | 0,00 | 6 | 25,00 | ||||
| 2025-08-14 | 13F | Vienna Asset Management LLC | 13.993 | -71,59 | 1.182 | -64,31 | ||||
| 2025-07-10 | 13F | Wealth Enhancement Advisory Services, Llc | 17.153 | -9,05 | 1.453 | 14,60 | ||||
| 2025-07-29 | 13F | Private Trust Co Na | 170 | 14 | ||||||
| 2025-08-12 | 13F | Resolute Wealth Strategies, LLC | 3.208 | -9,35 | 271 | 13,92 | ||||
| 2025-08-11 | 13F | Ritter Daniher Financial Advisory LLC / DE | 84 | 0,00 | 7 | 40,00 | ||||
| 2025-08-08 | 13F | Cetera Investment Advisers | 57.695 | 13,14 | 4.873 | 42,21 | ||||
| 2025-08-13 | 13F | Quadrature Capital Ltd | 0 | -100,00 | 0 | |||||
| 2025-08-01 | 13F | Envestnet Asset Management Inc | 47.109 | 11,56 | 3.979 | 40,22 |