Grundlæggende statistik
| Institutionelle ejere | 117 total, 117 long only, 0 short only, 0 long/short - change of 4,46% MRQ |
| Gennemsnitlig porteføljeallokering | 0.1802 % - change of -2,77% MRQ |
| Institutionelle aktier (lange) | 4.844.690 (ex 13D/G) - change of -0,20MM shares -4,00% MRQ |
| Institutionel værdi (lang) | $ 293.520 USD ($1000) |
Institutionelt ejerskab og aktionærer
J.P. Morgan Exchange-Traded Fund Trust - JPMorgan Diversified Return Emerging Markets Equity ETF (US:JPEM) har 117 institutionelle ejere og aktionærer, der har indsendt 13D/G- eller 13F-formularer til Securities Exchange Commission (SEC). Disse institutioner har i alt 4,844,690 aktier. Største aktionærer omfatter LPL Financial LLC, Bank Of America Corp /de/, Morgan Stanley, Cetera Investment Advisers, SAM Advisors, LLC, American Money Management, LLC, Prime Capital Investment Advisors, LLC, KWB Wealth, Colony Group, LLC, and Amplius Wealth Advisors, LLC .
J.P. Morgan Exchange-Traded Fund Trust - JPMorgan Diversified Return Emerging Markets Equity ETF (ARCA:JPEM) institutionel ejerskabsstruktur viser aktuelle positioner i virksomheden efter institutioner og fonde, samt seneste ændringer i positionsstørrelse. Større aktionærer kan omfatte individuelle investorer, investeringsforeninger, hedgefonde eller institutioner. Skema 13D angiver, at investoren besidder (eller besidder) mere end 5 % af virksomheden og har til hensigt (eller har til hensigt at) aktivt at forfølge en ændring i forretningsstrategi. Skema 13G indikerer en passiv investering på over 5%.
The share price as of March 27, 2026 is 60,17 / share. Previously, on March 31, 2025, the share price was 52,72 / share. This represents an increase of 14,13% over that period.

Fondens stemningsscore
Fund Sentiment Score (fka Ownership Accumulation Score) finder de aktier, der bliver mest købt af fonde. Det er resultatet af en sofistikeret, multi-faktor kvantitativ model, der identificerer virksomheder med de højeste niveauer af institutionel akkumulering. Scoringsmodellen bruger en kombination af den samlede stigning i oplyste ejere, ændringerne i porteføljeallokeringer i disse ejere og andre målinger. Tallet går fra 0 til 100, hvor højere tal indikerer et højere niveau af akkumulering for sine jævnaldrende, og 50 er gennemsnittet.
Opdateringsfrekvens: Dagligt
Se Ownership Explorer, som giver en liste over højest rangerende virksomheder.
AI+ Ask Fintel’s AI assistant about J.P. Morgan Exchange-Traded Fund Trust - JPMorgan Diversified Return Emerging Markets Equity ETF.
Select a question to share a public post with an AI-crafted answer.
Thinking of good questions…
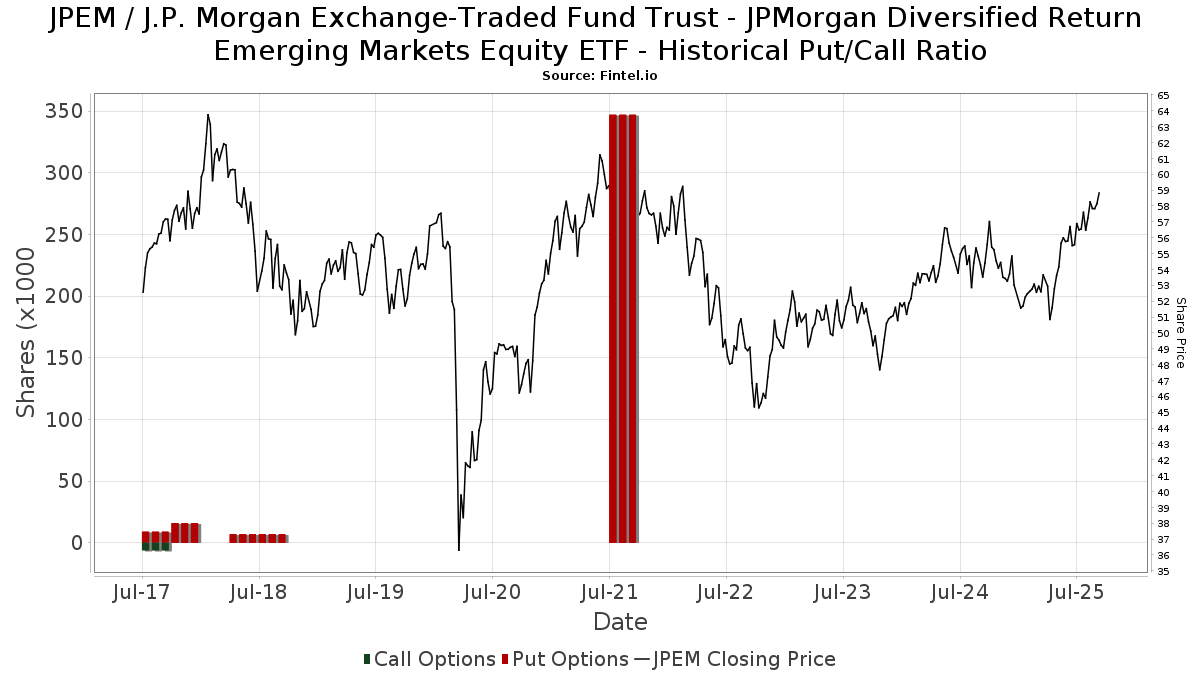
Institutionel Put/Call-forhold
Ud over at indberette standardaktie- og gældsudstedelser skal institutter med mere end 100 mill. aktiver under forvaltning også oplyse deres put- og call-optionsbeholdninger. Da salgsoptioner generelt indikerer negativ stemning, og købsoptioner indikerer positiv stemning, kan vi få en fornemmelse af den overordnede institutionelle stemning ved at plotte forholdet mellem put og kald. Diagrammet til højre viser det historiske put/call-forhold for dette instrument.
Brug af Put/Call Ratio som en indikator for investorernes stemning overvinder en af de vigtigste mangler ved at bruge totalt institutionelt ejerskab, som er, at en betydelig mængde af aktiver under forvaltning investeres passivt for at spore indekser. Passivt forvaltede fonde køber typisk ikke optioner, så indikatoren for put/call-forholdet følger mere nøje følelsen af aktivt forvaltede fonde.
13F og NPORT arkivering
Detaljer om 13F-arkivering er gratis. Detaljer om NP-ansøgninger kræver et premium-medlemskab. Grønne rækker angiver nye positioner. Røde rækker angiver lukkede positioner. Klik på linket ikon for at se den fulde transaktionshistorik.
Opgrader
for at låse premium-data op og eksportere til Excel ![]() .
.
| Fil dato | Kilde | Investor | Type | Gennemsnitlig pris (Øst) |
Aktier | Δ Aktier (%) |
Rapporteret Værdi ($1000) |
Δ Værdi (%) |
Port Alloc (%) |
|
|---|---|---|---|---|---|---|---|---|---|---|
| 2026-02-11 | 13F | Jpmorgan Chase & Co | 82.982 | 4,73 | 5.040 | 7,81 | ||||
| 2026-02-13 | 13F | Sofos Investments, Inc. | 278 | 0,00 | 17 | 0,00 | ||||
| 2026-02-13 | 13F | Citigroup Inc | 51.524 | -12,11 | 3.129 | -9,51 | ||||
| 2026-02-09 | 13F | Kingsview Wealth Management, LLC | 47.428 | 6,22 | 2.880 | 9,34 | ||||
| 2026-01-26 | 13F | Whittier Trust Co Of Nevada Inc | 120 | 7 | ||||||
| 2026-01-08 | 13F | Signet Financial Management, Llc | 18.881 | 10,35 | 1.147 | 13,58 | ||||
| 2026-02-17 | 13F | Asset One Wealth Management LLC | 7.004 | 451 | ||||||
| 2026-02-10 | 13F | 3Chopt Investment Partners, LLC | 4.147 | -2,08 | 252 | 0,80 | ||||
| 2026-02-13 | 13F | Morgan Stanley | 254.970 | 1,17 | 15.484 | 4,14 | ||||
| 2026-02-17 | 13F | Royal Bank Of Canada | 24.046 | -1,18 | 1.460 | 1,67 | ||||
| 2026-02-10 | 13F | Argent Trust Co | 14.489 | -2,73 | 880 | 0,11 | ||||
| 2026-01-16 | 13F | First Pacific Financial | 530 | -2,39 | 32 | 0,00 | ||||
| 2026-02-13 | 13F | Kestra Advisory Services, LLC | 1.431 | 87 | ||||||
| 2026-01-29 | 13F | Nbc Securities, Inc. | 200 | 100,00 | 12 | 140,00 | ||||
| 2026-02-13 | 13F | Wells Fargo & Company/mn | 114.207 | 27,79 | 6.936 | 31,54 | ||||
| 2026-02-05 | 13F | L & S Advisors Inc | 9.300 | -0,79 | 565 | 1,99 | ||||
| 2026-01-26 | 13F | Harbor Asset Planning, Inc. | 2.428 | 1,55 | 147 | 4,26 | ||||
| 2026-02-17 | 13F | Advisory Services Network, LLC | 0 | -100,00 | 0 | |||||
| 2026-01-20 | 13F | Sovran Advisors, LLC | 10.280 | -83,53 | 649 | -82,70 | ||||
| 2026-01-26 | 13F | AE Wealth Management LLC | 46 | -67,14 | 3 | -75,00 | ||||
| 2026-02-19 | 13F | CI Private Wealth, LLC | 131.841 | -4,92 | 8.013 | -2,05 | ||||
| 2025-11-13 | 13F | Total Investment Management Inc | 0 | -100,00 | 0 | -100,00 | ||||
| 2026-02-18 | 13F | GWM Advisors LLC | 660 | 1,38 | 40 | 5,26 | ||||
| 2026-01-12 | 13F | RVW Wealth, LLC | 3.779 | 0,00 | 229 | 3,15 | ||||
| 2026-01-28 | 13F | Hoey Investments, Inc | 120 | 7 | ||||||
| 2026-01-21 | 13F | Prime Capital Investment Advisors, LLC | 179.244 | -0,04 | 10.885 | 2,90 | ||||
| 2026-01-21 | 13F | Walkner Condon Financial Advisors LLC | 3.413 | 207 | ||||||
| 2026-02-17 | 13F | Bank Of America Corp /de/ | 327.933 | 1,50 | 19.915 | 4,49 | ||||
| 2026-02-10 | 13F | American Money Management, LLC | 186.472 | 1,71 | 11.324 | 4,70 | ||||
| 2026-01-09 | 13F | Tactive Advisors, LLC | 131.424 | 33,92 | 7.981 | 37,86 | ||||
| 2026-01-13 | 13F | Sharkey, Howes & Javer | 9.984 | -17,28 | 606 | -14,89 | ||||
| 2026-01-15 | 13F | Lodestone Wealth Management LLC | 5.780 | 1,49 | 351 | 4,78 | ||||
| 2026-01-23 | 13F | Farther Finance Advisors, LLC | 1.248 | 126,09 | 76 | 134,38 | ||||
| 2026-01-07 | 13F | Precedent Wealth Partners, Llc | 5.528 | -3,74 | 336 | -0,89 | ||||
| 2026-02-05 | 13F | Allworth Financial LP | 13.921 | -13,67 | 845 | -11,15 | ||||
| 2026-02-14 | 13F | Rockefeller Capital Management L.P. | 22 | 0,00 | 1 | 0,00 | ||||
| 2026-02-13 | 13F | Potentia Wealth | 0 | -100,00 | 0 | |||||
| 2026-02-10 | 13F | Goldman Sachs Group Inc | 11.587 | 704 | ||||||
| 2026-02-09 | 13F | Strategic Financial Concepts, LLC | 30.551 | 560,28 | 1.855 | 569,68 | ||||
| 2026-02-17 | 13F | Cetera Investment Advisers | 236.262 | 1,66 | 14.348 | 4,65 | ||||
| 2026-02-03 | 13F | International Assets Investment Management, Llc | 168 | 10 | ||||||
| 2026-02-12 | 13F | Commonwealth Equity Services, Llc | 92.694 | 2,40 | 5.629 | 112.480,00 | ||||
| 2026-02-06 | 13F | IFP Advisors, Inc | 250 | 1,63 | 15 | 7,14 | ||||
| 2026-02-11 | 13F | O'shaughnessy Asset Management, Llc | 186 | 0,00 | 11 | 10,00 | ||||
| 2026-02-17 | 13F | Captrust Financial Advisors | 7.686 | 1,07 | 467 | 4,02 | ||||
| 2026-02-12 | 13F | Steward Partners Investment Advisory, Llc | 14 | 0,00 | 1 | |||||
| 2026-02-13 | 13F | Shepherd Kaplan Krochuk, Llc | 8.145 | -44,00 | 495 | -42,42 | ||||
| 2026-02-17 | 13F | Old Mission Capital Llc | 0 | -100,00 | 0 | |||||
| 2025-11-06 | 13F | Ameritas Advisory Services, LLC | 0 | -100,00 | 0 | -100,00 | ||||
| 2026-01-20 | 13F | Accel Wealth Management | 33.537 | -3,98 | 2.037 | -1,17 | ||||
| 2026-02-13 | 13F | Aptus Capital Advisors, LLC | 575 | 475,00 | 35 | 580,00 | ||||
| 2026-02-13 | 13F | Colony Group, LLC | 156.273 | 5,88 | 9.491 | 8,99 | ||||
| 2026-01-28 | 13F | Edge Financial Advisors LLC | 18.717 | 0,89 | 1.137 | 3,84 | ||||
| 2026-02-11 | 13F | SAM Advisors, LLC | 194.578 | 0,62 | 11.817 | 3,58 | ||||
| 2026-02-17 | 13F | Ancora Advisors, LLC | 350 | 0,00 | 21 | 5,00 | ||||
| 2025-10-07 | 13F | Thurston, Springer, Miller, Herd & Titak, Inc. | 0 | -100,00 | 0 | |||||
| 2026-02-17 | 13F | Coppell Advisory Solutions LLC | 5.163 | 16,63 | 314 | 20,38 | ||||
| 2026-01-29 | 13F | Aprio Wealth Management, LLC | 3.500 | 213 | ||||||
| 2026-02-10 | 13F | Linscomb & Williams, Inc. | 136.572 | -1,10 | 8.294 | 1,80 | ||||
| 2026-01-26 | 13F | Cwm, Llc | 966 | 0 | ||||||
| 2026-02-17 | 13F | Wealthedge Investment Advisors, Llc | 11.243 | -5,39 | 683 | -2,71 | ||||
| 2026-02-13 | 13F | Marshall Wace, Llp | 87.740 | 5.328 | ||||||
| 2026-02-17 | 13F | Advisor Group Holdings, Inc. | 91.241 | -4,33 | 5.544 | -1,00 | ||||
| 2026-02-04 | 13F | MONECO Advisors, LLC | 10.991 | 24,30 | 668 | 28,02 | ||||
| 2026-02-12 | 13F | Litman Gregory Asset Management LLC | 2.193 | 133 | ||||||
| 2025-11-12 | 13F | IAG Wealth Partners, LLC | 0 | -100,00 | 0 | |||||
| 2026-02-17 | 13F | Fmr Llc | 377 | 175,18 | 23 | 175,00 | ||||
| 2026-02-06 | 13F | Pnc Financial Services Group, Inc. | 2.345 | 0,00 | 142 | 2,90 | ||||
| 2026-02-13 | 13F | Segall Bryant & Hamill, Llc | 125.416 | -4,82 | 7.617 | -2,03 | ||||
| 2026-02-12 | 13F | Summit Financial, LLC | 35.547 | -2,78 | 2.159 | 0,05 | ||||
| 2026-01-26 | 13F | Merit Financial Group, LLC | 31.898 | -0,44 | 1.937 | 2,49 | ||||
| 2026-02-13 | 13F | Mml Investors Services, Llc | 6.986 | 1,14 | 424 | 4,18 | ||||
| 2025-11-14 | 13F | Jane Street Group, Llc | 0 | -100,00 | 0 | |||||
| 2026-01-29 | 13F | BKM Wealth Management, LLC | 30.306 | 49,53 | 1.840 | 53,97 | ||||
| 2026-01-30 | 13F | Barnes Pettey Financial Advisors, Llc | 8.239 | 0,96 | 500 | 3,95 | ||||
| 2026-01-30 | 13F | BancorpSouth Bank | 4.093 | 0,00 | 249 | 2,90 | ||||
| 2026-01-26 | 13F | Private Trust Co Na | 1.623 | 0,00 | 99 | 3,16 | ||||
| 2026-01-27 | 13F | 5T Wealth, LLC | 13.021 | 6,25 | 791 | 9,42 | ||||
| 2026-02-11 | 13F | LPL Financial LLC | 417.623 | 5,23 | 25.362 | 8,33 | ||||
| 2025-10-16 | 13F | Lowe Wealth Advisors, LLC | 117 | 0,00 | 7 | 0,00 | ||||
| 2026-01-23 | 13F | LOM Asset Management Ltd | 3.055 | 15,07 | 186 | 17,83 | ||||
| 2025-11-03 | 13F | Truist Financial Corp | 0 | -100,00 | 0 | |||||
| 2026-01-12 | 13F | Focus Financial Network, Inc. | 25.202 | -0,61 | 1.531 | 2,34 | ||||
| 2026-02-13 | 13F | MAI Capital Management | 537 | 129,49 | 33 | 146,15 | ||||
| 2026-02-12 | 13F | Wealthspire Advisors, LLC | 0 | -100,00 | 0 | |||||
| 2026-01-30 | 13F | Wagner Wealth Management, Llc | 282 | 1,81 | 17 | 6,25 | ||||
| 2026-02-17 | 13F | Wiley Bros.-aintree Capital, Llc | 24.294 | -2,63 | 1.475 | 0,27 | ||||
| 2025-11-14 | 13F | Gts Securities Llc | 0 | -100,00 | 0 | |||||
| 2026-01-14 | 13F | Bond & Devick Financial Network, Inc. | 14.186 | 0,00 | 862 | 2,99 | ||||
| 2026-02-05 | 13F | Cambridge Investment Research Advisors, Inc. | 10.708 | 21,82 | 1 | |||||
| 2026-01-12 | 13F | Amplius Wealth Advisors, LLC | 137.618 | 5,50 | 8.358 | 8,60 | ||||
| 2025-10-30 | 13F | Twin Peaks Wealth Advisors, LLC | 0 | -100,00 | 0 | |||||
| 2026-02-19 | 13F | Birchwood Financial Partners, Inc. | 28.733 | 1.745 | ||||||
| 2026-02-02 | 13F | MN Wealth Advisors, LLC | 3.965 | 0,33 | 241 | 3,00 | ||||
| 2026-02-12 | 13F | Schiavi & Co LLC | 46.252 | -14,42 | 2.809 | -11,92 | ||||
| 2026-02-11 | 13F | Cedar Point Capital Partners, LLC | 32.480 | 10,68 | 1.973 | 13,92 | ||||
| 2026-01-21 | 13F | Sound Income Strategies, LLC | 63 | 0,00 | 4 | 0,00 | ||||
| 2026-01-26 | 13F | Slow Capital, Inc. | 0 | -100,00 | 0 | |||||
| 2026-01-27 | 13F | Berger Financial Group, Inc | 69.845 | 0,95 | 4.242 | 3,92 | ||||
| 2026-02-13 | 13F | Jacobi Capital Management LLC | 48.257 | 3,90 | 2.931 | 6,93 | ||||
| 2026-02-13 | 13F | SYM FINANCIAL Corp | 1.654 | 0,00 | 100 | 3,09 | ||||
| 2026-02-13 | 13F | Integrated Wealth Concepts LLC | 11.502 | -62,34 | 699 | -61,24 | ||||
| 2026-02-17 | 13F | Private Advisor Group, LLC | 5.312 | -1,04 | 323 | 1,90 | ||||
| 2026-02-17 | 13F | Equitable Holdings, Inc. | 6.791 | -11,48 | 412 | -8,85 | ||||
| 2025-10-02 | 13F | Investors Research Corp | 0 | -100,00 | 0 | |||||
| 2026-02-11 | 13F | Cerity Partners LLC | 132.839 | -8,26 | 8.067 | -5,56 | ||||
| 2026-02-17 | 13F | Susquehanna International Group, Llp | 36.789 | 2.234 | ||||||
| 2026-02-05 | 13F | Avantax Planning Partners, Inc. | 122.545 | -1,72 | 7.442 | 1,17 | ||||
| 2026-02-04 | 13F | 49 Wealth Management, Llc | 4.129 | -9,95 | 251 | -7,41 | ||||
| 2026-02-11 | 13F | Empowered Funds, LLC | 4.781 | 1,70 | 290 | 4,69 | ||||
| 2026-01-16 | 13F | RHS Financial, LLC | 59.748 | 5,06 | 3.628 | 8,14 | ||||
| 2026-01-12 | 13F | KWB Wealth | 159.191 | 1,09 | 9.668 | 8,83 | ||||
| 2026-02-10 | 13F/A | Northwestern Mutual Wealth Management Co | 154 | 9 | ||||||
| 2026-01-08 | 13F | Wealth Enhancement Advisory Services, Llc | 15.744 | 8,44 | 976 | 14,71 | ||||
| 2026-02-17 | 13F | Raymond James Financial Inc | 56.160 | 0,26 | 3.411 | 3,21 | ||||
| 2026-02-06 | 13F | GPS Wealth Strategies Group, LLC | 0 | -100,00 | 0 | |||||
| 2026-02-10 | 13F | Avestar Capital, LLC | 66.150 | 0,81 | 4.017 | 3,77 | ||||
| 2026-01-23 | 13F | Kelly Financial Group Llc | 11.153 | -0,84 | 677 | 2,11 | ||||
| 2026-02-10 | 13F | Envestnet Asset Management Inc | 6.803 | 7,02 | 413 | 10,13 | ||||
| 2026-01-12 | 13F | Daymark Wealth Partners, Llc | 6.571 | 1,20 | 399 | 4,18 | ||||
| 2026-01-12 | 13F | Richard P Slaughter Associates Inc | 4.341 | 0,00 | 264 | 2,73 | ||||
| 2026-01-30 | 13F | Sigma Planning Corp | 10.595 | 8,92 | 643 | 12,22 | ||||
| 2026-02-17 | 13F | Ameriprise Financial Inc | 111.423 | 13,43 | 6.764 | 16,72 | ||||
| 2026-02-06 | 13F | Larson Financial Group LLC | 16 | 1 | ||||||
| 2026-02-12 | 13F | BlackRock, Inc. | 1.088 | 66 | ||||||
| 2026-02-17 | 13F | Jones Financial Companies Lllp | 44.797 | 25,71 | 2.721 | 30,27 | ||||
| 2026-01-27 | 13F | First Horizon Corp | 1.362 | 83 | ||||||
| 2026-02-06 | 13F | Global Retirement Partners, LLC | 106 | 0,95 | 6 | 0,00 | ||||
| 2026-01-30 | 13F | Bogart Wealth, LLC | 155 | 0,00 | 9 | 0,00 | ||||
| 2026-02-12 | 13F | Tiemann Investment Advisors, Llc | 37.457 | 0,98 | 2.275 | 3,93 | ||||
| 2025-11-03 | 13F | Townsquare Capital Llc | 5.029 | 0,00 | 297 | 4,59 | ||||
| 2026-01-29 | 13F | UBS Group AG | 10.395 | 14,63 | 631 | 18,16 |